


1. Scale interactions in wall-bounded turbulence
The importance of large-scale coherent motions to wall-bounded turbulence has been recognized since early observations of very long time-scale correlations, indicating the presence of features many times the size of the outer length scale of the flow (Favre, Gaviglio & Dumas Reference Favre, Gaviglio and Dumas1967; Blackwelder & Kovasznay Reference Blackwelder and Kovasznay1972). These large, meandering regions of high momentum have been identified in the outer layer (Kim & Adrian Reference Kim and Adrian1999) and log layers (Hutchins & Marusic Reference Hutchins and Marusic2007) of all forms of wall-bounded flows, with slight differences between internal and external flows (Monty et al. Reference Monty, Hutchins, Ng, Marusic and Chong2009). Moreover, the large-scale motions were shown to contain half of the turbulent kinetic energy in wall-bounded flows (Guala, Hommema & Adrian Reference Guala, Hommema and Adrian2006), and thus appear well suited for low-order modelling.
A variety of modal decompositions have been used to represent the dynamically significant large-scale motions in turbulence, reviewed recently by Taira et al. (Reference Taira, Brunton, Dawson, Rowley, Colonius, McKeon, Schmidt, Gordeyev, Theofilis and Ukeiley2017), including variations on the proper orthogonal decomposition (POD) technique, along with dynamic mode decomposition (DMD), and a growing literature based on linearizing the Navier–Stokes equations, referred to as the resolvent framework.
The resolvent approach uses the linearized Navier–Stokes operator to construct a transfer function (the ‘resolvent operator’) to analyse the input–output relationship between the nonlinear forcing terms of the momentum equation and the resulting velocity fluctuations (McKeon Reference McKeon2017). A singular value decomposition (SVD) of an appropriately weighted resolvent operator is used to identify the forcing and response modes which result in the greatest (linear) energy amplification of the system, and which are supposed to be energetically representative modes within the flow. McKeon & Sharma (Reference McKeon and Sharma2010) showed that a special class of resolvent modes whose phase speed is equal to the local mean velocity results in uniquely strong amplification, similar to the critical layer modes traditionally studied in stability analysis. Since then, critical resolvent modes have been applied to a wide variety of wall-bounded flows (McKeon Reference McKeon2017), and have been shown to relate directly to the spectral form of the POD technique (Towne, Schmidt & Colonius Reference Towne, Schmidt and Colonius2018) under idealized conditions (although, practically, differences have been observed between SPOD and resolvent modes Abreu et al. Reference Abreu, Cavalieri, Schlatter, Vinuesa and Henningson2020). Similarly, DMD has been related to both SPOD and the resolvent modes, and has been suggested as a tool for constructing a data-driven (equation-free) resolvent framework (Herrmann et al. Reference Herrmann, Baddoo, Semaan, Brunton and Mckeon2021).
Because the resolvent represents energy-maximizing modes (within a linearized analysis), it has successfully captured certain large-scale energetic features of flows. However, generally it has not been employed for modelling the small-scale fluctuations within the turbulence that are particularly important for understanding the near-wall physics.
The first systematic treatment of the relationship between the large, energetic coherent motions and the small-scale features of wall-bounded turbulence appeared in the work of Bandyopadhyay & Hussain (Reference Bandyopadhyay and Hussain1984), where instantaneous velocity signals,  $u_i$, were decomposed into large and small-scale components by filtering, and the two resulting signals were compared by correlation techniques to show that variations in the large scales were indeed strongly correlated with variations in the amplitude of the small-scale fluctuations. This approach was revived by Mathis, Hutchins & Marusic (Reference Mathis, Hutchins and Marusic2009), who formulated a correlation coefficient, $R$, to quantify the inter-scale amplitude modulation as it varied across the boundary layer, which was eventually shown to be a consequence of triadic interactions between different scales of turbulence (Duvvuri & McKeon Reference Duvvuri and McKeon2015).
Although the mathematical origin of the scale interactions is clear, the physical interpretation of those interactions remains an open question. Initial studies suggested an amplitude modulation between the large and small scales, while others proposed a frequency modulation instead (Baars et al. Reference Baars, Talluru, Hutchins and Marusic2015). And even within the amplitude modulation approach, the modulation has been interpreted in the form of a spatial phase lag between the large and small scales (Chung & McKeon Reference Chung and McKeon2010; Jacobi & McKeon Reference Jacobi and McKeon2017) as well as a kind of interaction delay associated with the quadratic (advective) nonlinearity (Cui & Jacobi Reference Cui and Jacobi2021).
Understanding and potentially predicting the behaviour of turbulent scale interactions has significant implications for turbulence modelling and control, particularly as part of outer-layer models for near-wall turbulent fluctuations (Marusic, Mathis & Hutchins Reference Marusic, Mathis and Hutchins2010; Mathis et al. Reference Mathis, Marusic, Hutchins and Sreenivasan2011b; Baars, Hutchins & Marusic Reference Baars, Hutchins and Marusic2016a). More recently, the scale-interaction problem has been exploited to demonstrate net-energy-positive drag reduction scheme using wall oscillations (Marusic et al. Reference Marusic, Chandran, Rouhi, Fu, Wine, Holloway, Chung and Smits2021), in which large-scale spanwise wall oscillations were used to enhance inter-scale interactions (Deshpande et al. Reference Deshpande, Chandran, Smits and Marusic2022a) and thereby exert indirect control over the small scales associated with turbulent drag generation in the near-wall cycle.
Recently, Jacobi et al. (Reference Jacobi, Chung, Duvvuri and McKeon2021) outlined an analytical approach towards modelling the relationship between the large- and small-scale motions based on the resolvent framework. Following Reynolds & Hussain (Reference Reynolds and Hussain1972), they decomposed the coupled momentum and Reynolds stress equations and then filtered both equations to include the dynamics of only a single, isolated scale at wavenumber triplet  $\boldsymbol {k_f}$. In this way, the filtered, streamwise component of the momentum equation, $\tilde {u}$, was used to represent the dynamics of the most prominent, isolated very large-scale motion (VLSM) that had been shown (Jacobi & McKeon Reference Jacobi and McKeon2017) to dominate other large scales in the scale-interaction correlation analysis. The streamwise Reynolds normal stress, $\widetilde {u^2}$, was used to represent the envelope of small-scale fluctuations, $u$, acting at that same, isolated wavenumber. The empirical average phase lag between large and small scales reported in Bandyopadhyay & Hussain (Reference Bandyopadhyay and Hussain1984) was then taken to be the phase difference between complex representations of the $\tilde {u}$ and $\widetilde {u^2}$ signals that were governed by a system of two nonlinear equations.
In order to solve the system, Jacobi et al. (Reference Jacobi, Chung, Duvvuri and McKeon2021) employed two key simplifications: (i) the large-scale mode,  $\tilde {u}$, was modelled to be a self-similar resolvent mode, and (ii) the component of the small-scale mode, $\widetilde {u^2}$, which contributed towards the correlation with $\tilde {u}$, was assumed to be independent of the nonlinear forcing in the Reynolds stress equation. This latter assumption is reminiscent of the restricted nonlinear (RNL) Navier–Stokes analysis which similarly truncates the ‘closure’ problem at the level of the Reynolds stress dynamics (Thomas et al. Reference Thomas, Lieu, Jovanović, Farrell, Ioannou and Gayme2014; Gayme & Minnick Reference Gayme and Minnick2019). In addition to these assumptions, they also assumed that, as a practical matter, the contribution of the wall-normal isolated velocity fluctuation, $\tilde {v}$, to the normal Reynolds stress, $\widetilde {u^2}$, was negligible for high Reynolds numbers.
Under these assumptions, the phase difference,  $\Delta \phi$, between $\tilde {u}$ and $\widetilde {u^2}$ was obtained analytically and shown to be consistent with empirical observations reporting that the envelope of small scales spatially leads the large-scale fluctuations, with a phase difference of $\Delta \phi \approx -{\rm \pi} /2$ evaluated at the wall-normal location of the critical layer height for the isolated VLSM, i.e. the height of the streamwise, outer, spectral energetic peak, $y_{op}$.
Although this analytical approach was able to ascertain the correct sign of the phase difference between the scales, it was based on approximate resolvent mode shapes evaluated only in the immediate vicinity of the critical layer. Therefore, Jacobi et al. (Reference Jacobi, Chung, Duvvuri and McKeon2021) were not able to predict the full profile of the inter-scale phase difference across the boundary layer. More fundamentally, their key programmatic assumption that velocity and stress modes at a single wavenumber are sufficient to capture the average phase-lag behaviour from filtered large- and small-scale signals including many wavenumbers was never examined in detail. And their additional, practical assumptions about model inputs were not rigorously tested by using known mean velocity and Reynolds stress profiles, nor by calculating exact resolvent mode shapes as outputs.
In this paper, we first re-examine the resolvent framework for scale interactions and its fundamental assumptions. We show that a single phase-speed model cannot capture the phase difference between velocity and stress modes, and develop a composite approach to represent realistic VLSMs. We then develop a new quasi-empirical model based on resolvent modes to identify the components of this composite mode and accurately reproduce the average phase-difference profiles between velocity and stress fluctuations measured empirically in a channel flow direct numerical simulation (DNS). In § 2, we provide a detailed justification and physical interpretation for the single-wavenumber resolvent modelling approach to the scale-interaction problem. Then, we define the Reynolds stress resolvent framework in matrix form and describe the numerical approach for finding the phase relationship between velocity and stress fluctuations. In § 3 we numerically calculate the resolvent mode shape for just the dominant VLSM mode, assuming it is centred at the outer spectral peak location and that it convects with the local mean velocity there. We show that this mode shape does not represent the VLSM modes that predominate closer to the wall, and thus cannot be used to accurately unwrap the phase profile near the wall, resulting in an incorrect prediction of the inter-mode phase difference. Therefore, in § 4, we introduce the idea of a composite mode shape composed of VLSMs with differing convection velocities at each wall-normal position. The convection velocities were selected assuming that a single resolvent mode dominates at each wall-normal position by utilizing a new, quasi-empirical energy-based ‘forcing’ weighting. The phase-difference profile for the resulting composite modes was then calculated by simultaneous integration and unwrapping of the phases from each of the constituent resolvent modes in order to preserve physically meaningful phase information across the wall layer. Finally, the phase-difference profile from the composite resolvent modes was compared with empirical phase profiles extracted from DNS channel data, and wavenumber and Reynolds number trends were explored.
2. Reynolds stress resolvent operators
2.1. Justifying the single-scale analysis
The present work develops a new model for predicting phase profiles of scale interactions based on the analytical foundations of Jacobi et al. (Reference Jacobi, Chung, Duvvuri and McKeon2021). In order to develop this new model, it is necessary to first revisit those analytical foundations. In particular, the traditional approach to quantifying scale interactions involves filtering large- and small-scale velocity signals and computing correlations between them, whereas the analytical resolvent approach considers correlations of velocity and Reynolds stress fluctuations at a single, isolated scale, without filtering to separate between large- and small-scale motions. At first glance, these two techniques seem quite different. The single-scale approach assumed that isolated, VLSM-scale velocity and stress fluctuations are the dominant contributors to inter-scale interactions and thus capture the relevant trends obtained from the traditional filtered correlations.
To justify the assumption of the single-scale approach, we performed a spectral comparison of the correlation coefficient of Mathis et al. (Reference Mathis, Hutchins and Marusic2009), calculated by filtering, and an analogous correlation coefficient based on single-scale velocity and Reynolds stress calculations, without filtering. In this way, we can identify the conditions under which the velocity and stress signals (without filtering) can replicate trends obtained from filtering the velocity signal, and also when the single scale of the velocity and stress signals can capture the integrated effect of a wide range of scales. These conditions will then provide a physical context to the resolvent-based model developed in the following sections.
Throughout the paper, we non-dimensionalize the incompressible Navier–Stokes equations with respect to the friction velocity  $u_\tau$ and outer length scale, $h$, corresponding to a half-channel height that is relevant for later comparisons with channel DNS calculations. The Reynolds number is defined as ${Re} \equiv {u_\tau h}/{\nu }$, where $\nu$ is the kinematic viscosity; $U_0$ denotes the centreline velocity and $(x,y,z)$ and $(u,v,w)$ are the streamwise, wall-normal and spanwise coordinates and velocities, respectively.
Mathis et al. (Reference Mathis, Hutchins and Marusic2009) defined their amplitude modulation coefficient in terms of a large-scale signal,  $u_L$, obtained by low-pass filtering the instantaneous velocity, $u$, and a small-scale remainder signal, $u_S$, obtained by subtraction, $u_S = u - u_L$. The envelope of the small scales was then calculated by the Hilbert transform in order to describe the large-scale manifestation of the small-scale fluctuations; in our analysis, we calculate a roughly equivalent envelope by squaring the small-scale signal, $u_S^2$, following the approach of Chung & McKeon (Reference Chung and McKeon2010). The resulting large-scale and envelope signals were then Fourier transformed into wavenumber space, denoted by the $\widehat {( {\cdot } )}$, to yield the amplitude modulation coefficient via the cross-correlation theorem
 \begin{equation} R(y) = \frac{
\mathbb{R} [ \int_{-\infty}^\infty \hat{u}_L^*
\widehat{u^2_S} \, {\rm d}k_x ]}{[
\int_{-\infty}^\infty |\hat{u}_L|^2 \, {\rm d}k_x ]^{1/2} [ \int_{-\infty}^\infty
|\widehat{u^2_S}|^2 \, {\rm d}k_x]^{1/2}},
\end{equation}
\begin{equation} R(y) = \frac{
\mathbb{R} [ \int_{-\infty}^\infty \hat{u}_L^*
\widehat{u^2_S} \, {\rm d}k_x ]}{[
\int_{-\infty}^\infty |\hat{u}_L|^2 \, {\rm d}k_x ]^{1/2} [ \int_{-\infty}^\infty
|\widehat{u^2_S}|^2 \, {\rm d}k_x]^{1/2}},
\end{equation}
where  $^*$ denotes the complex conjugate. Rewriting the complex signals, at each wavenumber $k_x$, in terms of their magnitudes and the phase difference between them, $\Delta \phi (k)$, according to
 \begin{equation} \hat{u}_L^* \widehat{u^2_S} = |\hat{u}_L| |\widehat{u^2_S}| {\rm e}^{{\rm i} \Delta \phi} = |\hat{u}_L| |\widehat{u^2_S}| \left[\cos{(\Delta \phi)} + {\rm i} \sin{(\Delta \phi)} \right], \end{equation}
we can then rewrite the modulation coefficient as
 \begin{equation} R(y) = \frac{ \int_{-\infty}^\infty |\hat{u}_L| |\widehat{u^2_S}| \cos{(\Delta \phi)} \, {\rm d}k_x }{[ \int_{-\infty}^\infty |\hat{u}_L|^2 \, {\rm d}k_x ]^{1/2} [ \int_{-\infty}^\infty |\widehat{u^2_S}|^2 \, {\rm d}k_x ]^{1/2}} = \langle \cos{(\Delta \phi)} \rangle_w. \end{equation}
From this integral, the amplitude modulation coefficient can be naturally interpreted as an average phase cosine,  $\langle \cos {(\Delta \phi )} \rangle _w$, weighted by the magnitude of the cross-spectral density, $\hat {u}_L^* \widehat {u^2_S}$. Therefore, the amplitude modulation coefficient can be interpreted physically as an average phase difference between the large- and small-scale signals. (Note that the definition of the cross-spectrum here differs in the complex conjugate from that defined in Jacobi & McKeon (Reference Jacobi and McKeon2013) in order to make the phase difference consistent with Jacobi et al. (Reference Jacobi, Chung, Duvvuri and McKeon2021).)
Figure 1(a) shows the premultiplied cross-spectral energy density  $|\hat {u}_L^* \widehat {u^2_S}|$ in the inner region of a channel flow DNS at ${Re} = 5200$ by Lee & Moser (Reference Lee and Moser2015), ensemble averaged over 15 300 streamwise/wall-normal velocity-field slices. The cross-spectral energy density represents the weighting factor for the phase cosine and the integral of the normalized cross-spectrum yields the amplitude modulation coefficient, shown as the solid blue line in figure 1(b). Despite the different envelope used here, the general shape of the modulation profile is consistent with previous reports of Mathis et al. (Reference Mathis, Hutchins and Marusic2009) and others, specifically showing a zero-crossing location near the wall, which represents the location of a $-{\rm \pi} /2$ average phase difference between the two signals. Except for the signature of the near-wall cycle, most of the co-spectral energy in the inner region is concentrated in the large-scale motions, for $0.4 \lessapprox k_x \lessapprox 2$, consistent with experiments by Jacobi & McKeon (Reference Jacobi and McKeon2013).

Figure 1. Magnitude of the pre-multiplied cross-spectrum of (a)  $| \langle k_x \hat {u}^*_L \widehat {u^2_S} \rangle |$ following Mathis et al. (Reference Mathis, Hutchins and Marusic2009) with a root mean square (r.m.s.) envelope, and (c) $| \langle k_x \hat {u}^* \widehat {u^2} \rangle |$ used in the present study. The two white dashed lines represent the large-scale region $0.4 < k_x < 2$. Integrating the cross-spectrum over all wavenumbers yields the amplitude modulation coefficient, $R(y)$, shown in (b) for both cases: the filtered cross-spectrum of (a) shown in blue, and the unfiltered cross-spectrum of (c) shown in red. The difference between the two coefficient profiles is no greater than the variability due to the choice of filter cutoff explained in Mathis et al. (Reference Mathis, Hutchins and Marusic2009). The coefficient $R(y)$ resulting from integrating over only the large-scale sub-region in (c) is shown as the dashed line, and nearly coincides with the full integral in red, except very near the wall.
Figure 1(c) shows the premultiplied co-spectral energy density for the raw, unfiltered velocity and stress signals,  $|\hat {u}^* \widehat {u^2}|$, to compare with the filtered results in (a). Both spectral maps show the same dominant contribution from the VLSMs, although the unfiltered case is more intense. The similarity between the filtered and unfiltered cross-spectral maps at the large scales can be explained by considering their algebraic relationship
 \begin{equation}
\underbrace{\vphantom{\left(\widehat{u^2_S}^* + 2
\widehat{u_L u_S}^*+ \widehat{u^2_L}^* \right)} \hat{u}^*
\widehat{u^2}}_\text{unfiltered} =
\underbrace{\vphantom{\left(\widehat{u^2_S}^* + 2
\widehat{u_L u_S}^*+ \widehat{u^2_L}^* \right)}\hat{u}^*_L
\widehat{u^2_S}}_\text{filtered} +
\underbrace{\vphantom{\left(\widehat{u^2_S}^* + 2
\widehat{u_L u_S}^*+ \widehat{u^2_L}^* \right)}2
\hat{u}^*_L \widehat{u_L u_S}}_\text{negligible} +
\underbrace{\vphantom{\left(\widehat{u^2_S}^* + 2
\widehat{u_L u_S}^*+ \widehat{u^2_L}^* \right)}\hat{u}^*_L
\widehat{u^2_L}}_\text{self-modulation} +
\underbrace{\vphantom{\left(\widehat{u^2_S}^* + 2
\widehat{u_L u_S}^*+ \widehat{u^2_L}^* \right)}\hat{u}^*_S(\widehat{u^2_S} + 2 \widehat{u_L
u_S}+ \widehat{u^2_L} )}_\text{small-scale contribution}.
\end{equation}
\begin{equation}
\underbrace{\vphantom{\left(\widehat{u^2_S}^* + 2
\widehat{u_L u_S}^*+ \widehat{u^2_L}^* \right)} \hat{u}^*
\widehat{u^2}}_\text{unfiltered} =
\underbrace{\vphantom{\left(\widehat{u^2_S}^* + 2
\widehat{u_L u_S}^*+ \widehat{u^2_L}^* \right)}\hat{u}^*_L
\widehat{u^2_S}}_\text{filtered} +
\underbrace{\vphantom{\left(\widehat{u^2_S}^* + 2
\widehat{u_L u_S}^*+ \widehat{u^2_L}^* \right)}2
\hat{u}^*_L \widehat{u_L u_S}}_\text{negligible} +
\underbrace{\vphantom{\left(\widehat{u^2_S}^* + 2
\widehat{u_L u_S}^*+ \widehat{u^2_L}^* \right)}\hat{u}^*_L
\widehat{u^2_L}}_\text{self-modulation} +
\underbrace{\vphantom{\left(\widehat{u^2_S}^* + 2
\widehat{u_L u_S}^*+ \widehat{u^2_L}^* \right)}\hat{u}^*_S(\widehat{u^2_S} + 2 \widehat{u_L
u_S}+ \widehat{u^2_L} )}_\text{small-scale contribution}.
\end{equation}
The terms that multiply  $\hat {u}_S$ contribute energy only at the small scales and can be neglected when considering interactions at small wavenumbers. The remaining terms that explain the discrepancy between the filtered and unfiltered signals are (i) a cross-interaction term $\hat {u}_L^* \widehat {u_L u_S}$ which contributes very little due to the lack of spectral overlap between the large- and small-scale signals, and (ii) a self-modulation term, $\hat {u}^*_L \widehat {u^2_L}$, which represents interactions between large scales and the envelope of other large scales on the same side of the filter cutoff.
The relative energetic balance between the filtered scale-interaction term  $\hat {u}^*_L \widehat {u^2_S}$ and the self-interaction term $\hat {u}^*_L \widehat {u^2_L}$ determines the extent to which the unfiltered cross-spectrum mimics the filtered cross-spectrum, and this balance is a result of the choice of filter cutoff. As the filter cutoff increases, the cross-spectral energy at the large scales decreases and Mathis et al. (Reference Mathis, Hutchins and Marusic2009) noted that the magnitude of the modulation effect also decreases. This decrease in cross-spectral energy is due to the fact that the modulation effect primarily represents interactions between VLSMs and scales that are (relatively speaking) smaller, but not strictly small. If the filter-cutoff wavenumber is too high, then the only scales in the envelope signal are too small to interact with the VLSMs, and all of the cross-spectral energy shifts to the self-modulation term. As the filter-cutoff wavenumber is decreased, the energy in the self-modulation also decreases and the filtered and unfiltered scale-interaction terms become more aligned, as shown in detail in Appendix A. As long as the filter-cutoff wavenumber is sufficiently low, the unfiltered cross-spectrum will capture the same interactions between VLSMs and relatively smaller scales as the filtered cross-spectrum.
Therefore, instead of filtering the instantaneous velocity signals to construct a cross-spectrum of  $\hat {u}_L^* \widehat {u^2_S}$, we can actually skip the filtering step altogether and construct a cross-spectrum based on the instantaneous velocity and stress signals, $\hat {u}^* \widehat {u^2}$, and the discrepancy between these two representations should be of the same order of magnitude as the variability observed in $\hat {u}_L^* \widehat {u^2_S}$ alone due to changing the filter cutoff (Mathis et al. Reference Mathis, Hutchins and Marusic2009). The resulting amplitude modulation coefficient from the unfiltered signals, shown as the solid red line in figure 1(b), exhibits all of the same qualitative behaviour as the coefficient calculated from the filtered signals, and a quantitatively similar zero-crossing location.
In addition to showing that the velocity/stress cross-spectrum can approximate the filtered cross-spectrum, figure 1 also shows that only a narrow range of wavenumbers contributes significantly to the scale-interaction effect, marked in the region between the two vertical dashed lines. Integrating the cross-spectrum within just this wavenumber range produces an amplitude modulation coefficient in figure 1(b) that is nearly identical to the coefficient resulting from integrating over all wavenumbers. Therefore, we can focus on just isolated VLSM wavenumbers in the resolvent analysis without filtering, and these should represent the dominant contribution to the overall scale-interaction behaviour.
The use of unfiltered velocity and stress signals appears to be consistent with the traditional filter-based analysis of scale interactions, at least for VLSMs interacting with smaller scales; and the assumption that isolated wavenumbers can capture the integrated effect appears to apply except very close to the wall. Figure 1(c) shows that the VLSM contribution to  $R(y)$ varies with wall-normal location. Beneath the log layer ( $y<0.025$ or $y^+ < 130$), the cross-spectral energy density is broadly distributed across a wide range of wavenumbers, so the single-scale modelling will be less accurate. Special techniques will be developed in § 4 to unwrap the phase difference between the large-scale velocity mode and Reynolds stress fluctuations at VLSM scales in this near-wall region.
2.2. Triple-decomposed equations
Having established that the single-scale representations of velocity and stress can be used as a proxy for studying large- and small-scale turbulent interactions, we now briefly explain the resolvent-based representation for scale interactions used in Jacobi et al. (Reference Jacobi, Chung, Duvvuri and McKeon2021), which was based on earlier work by Reynolds & Hussain (Reference Reynolds and Hussain1972).
A triple decomposition of the instantaneous velocity,  $u_i$, and pressure, $p$, fields was then performed, separating the ensemble average values, denoted $\overline {(\;)}$, from a single, isolated coherent scale, denoted $\widetilde {(\;)}$, and the remaining turbulent components, denoted $(\;)'$, according to
 \begin{equation} u_i = \bar{u}_i + \tilde{u}_i + u_i', \quad p = \bar{p} + \tilde{p} + p'. \end{equation}
 This triple decomposition can be accomplished practically by a very narrow, bandpass spectral filter around a single (vector-valued) wavenumber triplet of interest,  $\boldsymbol {k_f}=(k_x,k_z,\omega )$, which will reflect the large-scale wavenumber of the VLSMs. The components of $\boldsymbol {k_f}$ are the real wavenumbers in the wall-parallel directions, $k_x$ and $k_z$, and the real angular frequency of the associated coherent structure, $\omega$. Thus $\tilde {u}_i$ represents just a single, isolated velocity mode, and $u_i'$ represents all of the remaining wavenumber triplets in the turbulence signal, $\boldsymbol {k} \neq \boldsymbol {k_f}$.
Substituting the triple decomposition (2.5a,b) into the incompressible Navier–Stokes equations results in a dynamical equation that includes an instantaneous Reynolds stress term,  $u_i' u_j'$, which represents content from all wavenumber triplets, including $\boldsymbol {k_f}$, due to the quadratic nonlinearity. Filtering the resulting equation at the isolated scale, $\boldsymbol {k_f}$, results in a dynamical description of just the isolated scale motion, $\tilde {u}_i$
 \begin{equation} \frac{\partial \tilde{u}_i}{\partial t} + \bar{u}_j\frac{\partial \tilde{u}_i}{\partial x_j} + \tilde{u}_j\frac{\partial \bar{u}_i}{\partial x_j} + \frac{\partial \tilde{p}}{\partial x_i} - \frac{1}{Re} \frac{\partial^2 \tilde{u}_i}{\partial x_j^2} ={-} \frac{\partial \tilde{r}_{ij}}{\partial x_j} \equiv {\tilde{f}_i}, \quad \frac{\partial \tilde{u}_i}{\partial x_i} = 0, \end{equation}
which depends on the filtered Reynolds stress,  $\tilde {r}_{ij} = \widetilde {u_i' u_j'}$.
If we consider just the streamwise component, for illustrative purposes, then the isolated scale,  $\tilde {u}$, can be thought of as representing the dominant streamwise VLSM mode. Thus, $\tilde {u}$ can be interpreted as the large-scale, streamwise velocity signal commonly derived in previous studies of inter-scale interactions via low-pass filtering, $u_L$.
Similarly, the instantaneous Reynolds stress,  $u'^2$, can be thought of as a variance envelope of the remainder turbulent fluctuations, $u'$, after the VLSM component was removed, as discussed in detail in § 2.1. Filtering the enveloped fluctuations to obtain $\widetilde {u'^2}$ is then equivalent to rectifying the enveloped signal at the same scale as the large-scale signal, $\tilde {u}$. The enveloped, non-VLSM signal, $\widetilde {u'^2}$, differs from the enveloped small-scale signal used in previous studies of scale interactions, $u_S$ or $\mathcal {E}(u_S)$, due to the presence of large-scale (albeit non-VLSM) contributions in $u'$. Nevertheless, $\widetilde {u'^2}$ can still be interpreted as equivalent to the traditional, small-scale envelope assuming that the non-VLSM contributions to the scale interactions are negligible, as shown above in figure 1.
The dynamical equation for the filtered Reynolds stress,  $\tilde {r}_{ij}$, was derived in similar fashion
 \begin{gather} \frac{\partial \tilde{r}_{ij}}{\partial t} + \bar{u}_k \frac{\partial \tilde{r}_{ij}}{\partial x_k} + \tilde{u}_k \frac{\partial \bar{r}_{ij}}{\partial x_k} + \tilde{r}_{jk} \frac{\partial \bar{u}_i}{\partial x_k} + \tilde{r}_{ik} \frac{\partial \bar{u}_j}{\partial x_k} + \bar{r}_{jk} \frac{\partial \tilde{u}_i}{\partial x_k} + \bar{r}_{ik} \frac{\partial \tilde{u}_j}{\partial x_k} - \frac{1}{Re}\frac{\partial^2 \tilde{r}_{ij}}{\partial x_k^2} = \tilde{g}_{ij}, \end{gather}
 \begin{gather} \tilde{g}_{ij} ={-} \frac{\partial }{\partial x_k} {\widetilde{u_i' u_j' u_k'}} - \widetilde{u_j'\frac{\partial {p'}}{\partial x_i}} - \widetilde{u_i'\frac{\partial {p'}}{\partial x_j}} - \frac{2}{Re} \widetilde{\frac{\partial {u}_i'}{\partial x_k}\frac{\partial {u}_j'}{\partial x_k}}, \end{gather}
where the nonlinear terms have been grouped together on the right-hand side, labelled  $\tilde {g}_{ij}$. Note that the filtered Reynolds stress dynamical equation depends on the ensemble averaged Reynolds stress profiles, $\bar {r}_{jk} = \overline {u'_j u'_k}$. The channel flow geometry resulted in simplifications of the mean flow
 \begin{equation} \bar{u} = \bar{u}(y), \quad \{\bar{v}, \bar{w}\} = 0, \end{equation}
and mean Reynolds stresses
 \begin{equation} \{ \bar{r}_{xx},\bar{r}_{yy},\bar{r}_{zz}, \bar{r}_{xy}\} = \{\bar{r}_{xx},\bar{r}_{yy},\bar{r}_{zz}, \bar{r}_{xy}\}(y), \quad \{\bar{r}_{xz},\bar{r}_{yz}\} = 0, \end{equation}
based on geometrical and statistical symmetries.
2.3. Resolvent formulation
To apply the resolvent analysis to this system of equations, the isolated (large) scale,  $\tilde {u}_i$, and filtered Reynolds stress, $\tilde {r}_{ij}$, signals were expressed in the form of normal modes. In addition, the nonlinear forcing of the isolated mode (which appears as the divergence of the filtered Reynolds stress in (2.6)) was also assumed to exhibit normal mode form, according to
 \begin{equation} {\{\tilde{u}_i, \tilde{r}_{ij}, \tilde{f}_i \}(x,y,z,t) = \{\tilde{U}_i, \tilde{R}_{ij}, \tilde{F}_i\}(y;k_x,k_z,\omega) \exp({\mathrm{i}(k_x x + k_z z - \omega t)}){+ \text{c.c.}}}, \end{equation}
where  $\tilde {f}_i$ is the forcing term in (2.6). The complex mode profiles, $\tilde {U}_i$, $\tilde {R}_{ij}$ and $\tilde {F}_i$ can be decomposed in terms of a magnitude and phase as $\tilde {U}_i = |\tilde {U}_i| {\rm e}^{{\rm i} \phi _{U_i}}$, $\tilde {R}_{ij} = |\tilde {R}_{ij}| {\rm e}^{{\rm i} \phi _{R_{ij}}}$ and $\tilde {F}_{i} = |\tilde {F}_{i}| {\rm e}^{{\rm i} \phi _{F_{i}}}$, and the phase difference between large-scale velocity and stress modes is defined as $\Delta \phi = \phi _{\tilde {R}_{xx}}-\phi _{\tilde {U}}$. The $\text {c.c.}$ denotes the complex conjugate of the preceding normal modes.
Substituting the normal mode decomposition (2.10) into the large-scale dynamics (2.6) results in a dynamical equation for each wavenumber  $(k_x,k_z,\omega )$. Combining the three components of velocity modes $\tilde {u}_i$ into a matrix form, $\boldsymbol{\mathsf{U}}$, and then re-writing the velocity components in wall-normal velocity/vorticity form, $\boldsymbol{\mathsf{Q}}$ (following Schmid & Henningson (Reference Schmid and Henningson2001)), equation (2.6) can be written entirely in terms of matrix operators as
 \begin{equation} (-\mathrm{i} \omega \boldsymbol{\mathsf{M}} + \boldsymbol{\mathsf{L}})\boldsymbol{\mathsf{Q}} = \boldsymbol{\mathsf{B}}_1 \boldsymbol{\mathsf{F}} = \boldsymbol{\mathsf{B}}_1 \boldsymbol{\mathsf{B}}_2 \boldsymbol{\mathsf{R}}, \end{equation}
where the individual matrices are given as
 \begin{gather} \renewcommand{\arraystretch}{1.3} \boldsymbol{\mathsf{M}} = \left[\begin{array}{@{}cc@{}} -\Delta & 0\\ 0 & 1 \end{array}\right] ; \renewcommand{\arraystretch}{1.3} \quad \boldsymbol{\mathsf{L}} = \left[\begin{array}{@{}cc@{}} {Re}^{{-}1} \Delta^2 + \mathrm{i} k_x \left(\mathrm{d}^2 \bar{u} - \bar{u} \Delta \right) & 0\\ \mathrm{i} k_z \mathrm{d} \bar{u} & -{Re}^{{-}1} \Delta + \mathrm{i} k_x \bar{u} \end{array}\right]; \end{gather}
 \begin{gather} \renewcommand{\arraystretch}{1.3} \boldsymbol{\mathsf{B}}_1 = \mathrm{i} \left[\begin{array}{@{}ccc@{}} k_x \mathrm{d} & -\mathrm{i} k^2 & k_z \mathrm{d} \\ k_z & 0 & - k_x \end{array}\right]; \end{gather}
 \begin{gather} \renewcommand{\arraystretch}{1.3} \boldsymbol{\mathsf{B}}_2 = \left[\begin{array}{@{}cccccc@{}} -\mathrm{i} k_x & 0 & 0 & -\mathrm{d} & -\mathrm{i} k_z & 0 \\ 0 & -\mathrm{d} & 0 & -\mathrm{i} k_x & 0 & -\mathrm{i} k_z \\ 0 & 0 & -\mathrm{i} k_z & 0 & -\mathrm{i} k_x & -\mathrm{d} \end{array}\right]; \quad \renewcommand{\arraystretch}{1.3} \boldsymbol{\mathsf{C}} = \dfrac{\mathrm{i}}{k^2}\left[\begin{array}{@{}cc@{}} k_x \mathrm{d} & -k_z \\ - \mathrm{i} k^2 & 0\\ k_z \mathrm{d} & k_x \end{array}\right]; \end{gather}
 \begin{gather} \boldsymbol{\mathsf{Q}} = \left[\begin{array}{@{}c@{}} \tilde{V} \\ \tilde{\eta} \end{array}\right];\quad \boldsymbol{\mathsf{R}} =\left[\begin{array}{@{}c@{}} \tilde{R}_{xx} \\ \tilde{R}_{yy} \\ \tilde{R}_{zz} \\ \tilde{R}_{xy} \\ \tilde{R}_{xz} \\ \tilde{R}_{yz} \end{array}\right]; \quad \boldsymbol{\mathsf{U}} = \left[\begin{array}{@{}c@{}} \tilde{U} \\ \tilde{V} \\ \tilde{W} \end{array}\right]; \quad \renewcommand{\arraystretch}{1.3} \boldsymbol{\mathsf{F}} = \left[\begin{array}{@{}c@{}} \tilde{F}_x \\ \tilde{F}_y \\ \tilde{F}_z \end{array}\right]; \end{gather}
where  $\boldsymbol{\mathsf{I}}$ is the identity matrix and $\Delta = (\mathrm {d}^2 - k^2)$ is the Laplacian operator, with $\mathrm {d} \equiv \mathrm {d}/\mathrm {d} y$ and $k^2 = k_x^2 + k_z^2$. The velocity–vorticity vector, $\boldsymbol{\mathsf{Q}}$, is related to the Cartesian velocity components, $\boldsymbol{\mathsf{U}}$ as $\boldsymbol{\mathsf{U}}=\boldsymbol{\mathsf{C}}\boldsymbol{\mathsf{Q}}$, where $\tilde {\eta }$ is the wall-normal vorticity component.
Isolating the velocity modes,  $\boldsymbol{\mathsf{Q}}$ in (2.11) and rewriting them in Cartesian form, $\boldsymbol{\mathsf{U}}$, yields
 \begin{equation} \underbrace{\boldsymbol{\mathsf{C}}\boldsymbol{\mathsf{Q}}}_{\boldsymbol{\mathsf{U}}} = \underbrace{\boldsymbol{\mathsf{C}} (-\mathrm{i} \omega + \boldsymbol{\mathsf{M}}^{{-}1} \boldsymbol{\mathsf{L}})^{{-}1} (\boldsymbol{\mathsf{C}}^H \boldsymbol{\mathsf{C}})^{{-}1} \boldsymbol{\mathsf{C}}^H}_{\mathcal{H}(\boldsymbol{k})} \underbrace{\boldsymbol{\mathsf{B}}_2 \boldsymbol{\mathsf{R}}}_{\boldsymbol{\mathsf{F}}}, \end{equation}
where superscript  $H$ denotes the Hermitian transpose. Thus we can define a transfer function $\mathcal {H}(\boldsymbol {k})$ to relate the nonlinear Reynolds mode input, $\boldsymbol{\mathsf{F}}$, to the velocity output modes, $\boldsymbol{\mathsf{U}}$. This formulation is identical to the traditional resolvent as discussed in Moarref et al. (Reference Moarref, Sharma, Tropp and McKeon2013), except for a sign reversal in their equation (2.7b), in element $(2.1)$ of their forcing operator $C^{\dagger}$ (corresponding to our $\boldsymbol{\mathsf{B}}_1$).
The dynamics of the Reynolds stress in (2.7a) can also be written in terms of the substituted normal modes and then rewritten in matrix form for each  $(k_x,k_z,\omega )$ as
 \begin{equation} \boldsymbol{\mathsf{A}}\boldsymbol{\mathsf{R}}+\boldsymbol{\mathsf{J}}\boldsymbol{\mathsf{U}} = \boldsymbol{\mathsf{G}}, \end{equation}
where the operator matrices are defined as
 \begin{equation} \renewcommand{\arraystretch}{1.3} \boldsymbol{\mathsf{A}} = \mathrm{i}(-\omega + k_x \bar{u}) \left[\begin{array}{@{}cccccc@{}} 1 & 0 & 0 & 2\gamma & 0 & 0\\ 0 & 1 & 0 & 0 & 0 & 0 \\ 0 & 0 & 1 & 0 & 0 & 0 \\ 0 & \gamma & 0 & 1 & 0 & 0 \\ 0 & 0 & 0 & 0 & 1 & \gamma \\ 0 & 0 & 0 & 0 & 0 & 1 \end{array}\right] - {Re}^{{-}1}(\mathrm{d}^2-k^2)\boldsymbol{\mathsf{I}}; \end{equation}
 \begin{equation} \renewcommand{\arraystretch}{1.3} \boldsymbol{\mathsf{J}} = \left[\begin{array}{@{}ccc@{}} 2\bar{r}_{xx}\mathrm{i}k_x + 2\bar{r}_{xy}\mathrm{d} & \bar{r}_{xx,y} & 0 \\ 0 & \bar{r}_{yy,y} + 2 \bar{r}_{xy} \mathrm{i} k_x + 2 \bar{r}_{yy} \mathrm{d} & 0 \\ 0 & \bar{r}_{zz,y} & 2\bar{r}_{zz}\mathrm{i}k_z \\ \bar{r}_{xy} \mathrm{i} k_x + \bar{r}_{yy}\mathrm{d} & \bar{r}_{xy,y} + \bar{r}_{xx} \mathrm{i} k_x + \bar{r}_{xy} \mathrm{d} & 0 \\ \bar{r}_{zz} \mathrm{i} k_z & 0 & \bar{r}_{xx} \mathrm{i} k_x + \bar{r}_{xy} \mathrm{d} \\ 0 & \bar{r}_{zz} \mathrm{i} k_z & \bar{r}_{xy} \mathrm{i}k_x + \bar{r}_{yy} \mathrm{d}, \end{array}\right] \end{equation}
with  $\gamma =(\mathrm {d}\bar {u}/\mathrm {d} y)/[\mathrm {i}(-\omega + k_x\bar {u})]$; $\overline {(\;)}_{,y} \equiv \mathrm {d}\overline {(\;)}/\mathrm {d} y$, and $\boldsymbol{\mathsf{G}}$ corresponds to the forcing term $\tilde {g}_{ij}$ in (2.7).
The denominator of  $\gamma$ expresses the difference between the streamwise phase speed of the normal mode, $c = \omega /k_x$, and the local mean velocity in the channel, $\bar {u}$, and thus $\boldsymbol{\mathsf{A}}$ exhibits a inviscid singularity at the wall-normal location, $y_c$, when the two speeds are matched, such that $\bar {u}(y_c)=c$. This singularity also appears in the large-scale dynamics, within the resolvent operator $\mathcal {H}(\boldsymbol {k})$. In both cases, viscosity (expressed through ${Re}$) resolves this singularity via the generation of a critical layer in the neighbourhood of $y_c$, near where the amplitude of the related ‘critical’ mode reaches its maximum.
2.4. Most amplified velocity modes
In order to obtain the modes shapes for the large- and small-scale structures represented by  $\boldsymbol{\mathsf{U}}$ and $\boldsymbol{\mathsf{R}}$, we apply the resolvent framework to the analysis of (2.11) and (2.13). Assuming that the fluctuating Reynolds stresses, $\boldsymbol{\mathsf{R}}$ (and thus the related nonlinear forcing, $\boldsymbol{\mathsf{F}}$) is unknown, the most amplified velocity modes can be modelled by a SVD of the operator, $\mathcal {H}$, linking $\boldsymbol{\mathsf{U}}$ and $\boldsymbol{\mathsf{F}}$, under a kinetic energy norm, following Reddy, Schmid & Henningson (Reference Reddy, Schmid and Henningson1993).
The SVD of the resolvent operator evaluated at a wavenumber triplet  $\boldsymbol {k_f}$ can be expressed as the sum of left, $\psi _j$, and right, $\phi _j$, singular vectors, each associated with an ordered sequence of singular values, $\sigma _j$
 \begin{equation} {\mathcal{H}} = \sum_{j=1}^{\infty} \psi_j \sigma_j \phi_j^H. \end{equation}
The orthonormal singular vectors represent the shape (phase and amplitude) of the velocity (output) and forcing (input) modes that most strongly amplify the kinetic energy associated with the resolvent operator, as given (in vector form) by
 $$\begin{gather} \tilde{F}_i = \sum_{j=1}^{\infty} \phi_{i, j} \bar{\chi}_{j}, \end{gather}$$
 $$\begin{gather}\tilde{U}_i = \sum_{j=1}^{\infty} \sigma_{j} \psi_{i, j} \bar{\chi}_{j} = \sum_{j=1}^{\infty} \psi_{i, j} \chi_{j} , \end{gather}$$
where  $\sigma _j$ represents the magnitude of the linear amplification of mode $j$, and $\bar {\chi}_{j}$ represents the a priori unknown projection coefficient of the true forcing onto the linearly amplified forcing mode, such that the inputs and outputs of the system are self-consistent. For broadband forcing, $\bar {\chi}_{j}$ is assumed to be unity (i.e. the forcing and principal forcing directions are aligned). Combining the projection coefficient with the linear amplification captured by the singular value, McKeon (Reference McKeon2017) defined an overall ‘velocity weighting factor’, $\chi_{j}= \sigma _{j} \bar {\chi}_{j}$, which conveniently captures the energy of individual disturbance modes, as described below in § 4.
The rank-1 mode of the velocity response modes (i.e. just the first singular mode,  $j=1$) has been shown to successfully capture the near-wall cycle and other energetically significant features of wall-bounded flows due to the low rank of the resolvent operator – see McKeon (Reference McKeon2017) for a review. Thus, for the subsequent scale-interaction analysis, the mode shapes of $\tilde {U}_i$ will be modelled by only $\psi _{i,1}$.
In order to obtain the Reynolds modes,  $\tilde {R}_{ij}$ corresponding to the velocity modes $\tilde {U}_i$, there are two possible approaches. In Jacobi et al. (Reference Jacobi, Chung, Duvvuri and McKeon2021), they assumed that the nonlinear forcing to the Reynolds stress, $\boldsymbol{\mathsf{G}}$, appearing in (2.13) was uncorrelated with the scale interactions (a variation on the RNL model)
 \begin{equation} \boldsymbol{\mathsf{A}}\boldsymbol{\mathsf{R}}+\boldsymbol{\mathsf{J}}\boldsymbol{\mathsf{U}} \approx 0 \end{equation}
and thus expressed  $\boldsymbol{\mathsf{R}}$ in terms of the $\boldsymbol{\mathsf{U}}$ modes obtained above via the resolvent analysis, according to
 \begin{equation} \boldsymbol{\mathsf{R}} \approx{-}(\boldsymbol{\mathsf{A}}^{{-}1} \boldsymbol{\mathsf{J}})\boldsymbol{\mathsf{U}}. \end{equation}
However, in the previous analysis, they did not actually solve for the resolvent modes via the SVD. Rather, they approximated the  $\tilde {U}_i$ and $\tilde {R}_{ij}$ mode shapes analytically, assuming they exhibited the self-similar resolvent form identified in Dawson & McKeon (Reference Dawson and McKeon2019). In the present analysis, we adopted this same general procedure, but we represented the $\boldsymbol{\mathsf{U}}$ mode shape with the first singular mode, $\psi _{i,1}$, obtained from the numerical solution of (2.11), without any additional analytical modelling.
Upon substitution of the rank-1, large-scale mode shapes,  $\psi _{i,1}$, into (2.18), we denote the resulting rank-1 Reynolds stress mode shapes as $\xi _{i,1}$. Note that these Reynolds stress modes are not orthonormal.
An alternative approach to obtaining the  $\boldsymbol{\mathsf{U}}$ and $\boldsymbol{\mathsf{R}}$ mode shapes, in which $\boldsymbol{\mathsf{G}}$ is not neglected and instead the resolvent framework is applied directly to the $\boldsymbol{\mathsf{R}}$ modes, is discussed in Appendix B.
3. Numerical solution of the inter-mode phase difference
To obtain the phase relationship between large and small scales, the large-scale mode shapes were obtained via the SVD of the resolvent operator,  $\mathcal {H}$, in (2.12), following the standard resolvent calculation. The mean velocity profile and the Reynolds stress profiles which appear in the operator were obtained from the channel flow DNS at ${Re} = 5200$ by Lee & Moser (Reference Lee and Moser2015), and the operator was discretized using spectral collocation (Trefethen Reference Trefethen2000) with a resolution of $400$ points across the full channel height, which was found to achieve grid-independent singular mode shapes. Prior to the SVD, the resolvent operator was augmented by a weighting matrix, $\boldsymbol{\mathsf{W}}$, so that the $L2$-norm of the modified operator corresponded to a kinetic energy norm of the velocity modes, following Reddy et al. (Reference Reddy, Schmid and Henningson1993).
The spatial wavenumbers,  $(k_x, k_z)$, for the large-scale mode, $\tilde {U}_i$, were selected to correspond to the dominant VLSMs in the channel flow by examining the two-dimensional, premultiplied energy spectral density map evaluated at the height of the streamwise, outer spectral energetic peak, $y_{op} \approx 3.9\, {Re}^{-1/2}$. The resulting wavenumber pair, $(k_x, k_z)= (0.75, 6)$, corresponded to a large-scale motion with streamwise extent approximately $8$ channel half-heights long. The temporal frequency of the mode, $\omega$, was selected such that the phase speed of the mode, $c = \omega /k_x$, corresponded to the local mean velocity evaluated at the outer peak location, $c_{op} = \bar {u}(y_{op}) \approx 0.71 U_0$. Previous studies have assumed that the convective velocity for the dominant VLSM ranged from $0.67 U_0$ to $0.8 U_0$. The resulting isolated mode was therefore a detached, critical mode with amplitude centred at $y_{op}$, consistent with the self-similar VLSM mode assumption of the analytical approximation in Jacobi et al. (Reference Jacobi, Chung, Duvvuri and McKeon2021).
The mode shape for the streamwise velocity fluctuation,  $\tilde {U}$ was obtained from the first orthonormal response mode $\psi _{1,1}$, which is unique up to an arbitrary phase (via the properties of the SVD) and thus the phase was assigned to be $0$ at the wall, for convenience. A map of a period of the real part of $\psi _{1,1}$ is shown in figure 2(a), where the amplitude of $\psi _{1,1}$ has been normalized by its wall-normal maximum.

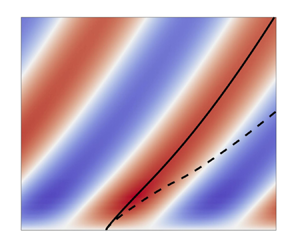
Figure 2. (a–c) The real part of the streamwise mode shapes of (a) the large-scale velocity mode,  $\psi _{1,1}$, and (b) the stress fluctuations, $\xi _{1, 1}$, for $({k_x, k_z}, \omega ) = ({0.75, 6}, {14})$. The amplitude of each mode was normalized by its maximum across the channel. The outer spectral peak, $y_{op}$ (about which the large-scale mode is centred) is marked in the dash-dotted line. The phase profiles for $\psi _{1,1}$ and $\xi _{1, 1}$ are represented by the solid and dashed black lines, respectively, so that the relative phase difference can be seen clearly in (b). In (c), the phase-difference profile, $\Delta \phi = \phi _{\xi _{1,1}} - \phi _{\psi _{1,1}}$ is shown by the black solid line. (d,e) The ensembled-averaged, spatial Fourier mode shapes extracted from the DNS data for the (d) the large-scale velocity mode and (e) the stress fluctuations. The average phase difference between these modes, calculated from the cross-spectrum, $\hat {u}^* \widehat {u^2}$, is shown in the circles in (c) for comparison with the solid line for the resolvent modes. As discussed in § 3.1, the phase difference cannot be inferred from the individual, ensemble-averaged modes due to the non-zero covariance between velocity and stress.
The  $\tilde {U}_i$ modes are related to the $\tilde {R}_{ij}$ modes via (2.18), where the operator $\boldsymbol{\mathsf{J}}$ depends on the mean Reynolds stress profiles, $\bar {r}_{ij}(y)$, obtained from the DNS. Here, $\psi _{1,1}$ was substituted into (2.18) to obtain the corresponding leading-order streamwise Reynolds normal stress mode, denoted $\xi _{1,1}$, which is shown in figure 2(b), also normalized by its wall-normal maximum. Very near the wall, the Reynolds stress mode is inclined upstream, opposite the VLSM mode. A bit farther from the wall, the inclination reverses and proceeds downstream until the outer region. This shift in inclination is inconsistent with the analytical approximation where the mode shapes of large-scale velocities and stresses were assumed similar. The location of maximum amplitude also differs between the two modes, where the Reynolds stress mode is centred closer to the wall. For $y \gtrsim 0.2$, the profile shapes are vertically oriented with very low amplitude, and thus this region is excluded from this and subsequent figures.
However, the resolvent modes appear quite different from the corresponding spatial Fourier mode shapes for the velocity and stress signals that were extracted from the DNS and are shown in the second row of figure 2. (Technically speaking, the closest empirical analogue to the resolvent mode is SPOD, as shown by Towne et al. (Reference Towne, Schmidt and Colonius2018), but Fourier modes are used here for consistency with the analytical framework of the governing equations, which is designed to capture the phase difference between velocity and stress modes, but not the ensemble-averaged mode shapes themselves. Correspondence between the resolvent and the average mode shapes does not imply correspondence of the average phase difference between mode shapes, as discussed in the next section.) Care was taken to preserve the separate phase profiles of each of the Fourier modes in the ensemble average by setting the wall phase for each snapshot to zero.
We note that the DNS velocity mode is inclined towards the wall at  $\approx 10^\circ$, consistent with observations of VLSMs, and far less steep than the corresponding resolvent mode, which traditionally exhibits inclination angles of around $2^\circ$ (Dawson & McKeon Reference Dawson and McKeon2020; Madhusudanan & McKeon Reference Madhusudanan and McKeon2022). This discrepancy between VLSM and resolvent mode shapes was observed in a number of earlier studies and was explored in detail in Morra et al. (Reference Morra, Semeraro, Henningson and Cossu2019), who showed that the resolvent operator is unable to properly resolve large-scale motions without incorporating an eddy-viscosity model. But an eddy-viscosity model is not possible under the current framework, which explicitly solves for the Reynolds stresses. Similarly, the Fourier stress mode is significantly less steeply inclined towards the wall than that predicted by the transfer function. These differences in the individual mode shapes are expected to influence the spatial lag between the modes, as expressed through the phase difference, discussed below.
3.1. Phase-difference calculations
The average phase differences between the Fourier modes, shown in figure 2(c), were obtained directly from the ensemble-averaged cross-spectrum of the DNS,  $\hat {u}^* \widehat {u^2}$. The phase differences were then unwrapped to obtain a continuous phase-difference profile. However, it is important to note that the phase difference between the two Fourier modes cannot be obtained by subtracting the phases of the separate, ensemble-averaged mode shapes in figure 2(d,e) due to the non-zero covariance between the velocity and stress signals, i.e. $\langle \hat {u}^* \widehat {u^2} \rangle = \langle \hat {u}^* \rangle \langle \widehat {u^2} \rangle + \text {cov}(\hat {u}^*,\widehat {u^2})$, where $\langle {\cdot } \rangle$ represents ensemble averaging. This covariance problem applies more generally to any mode eduction by ensemble averaging, including SPOD. The phase difference observed between individual, ensemble-averaged modes will not correspond to the phase difference implicit in the amplitude modulation coefficient (2.1) that we are seeking to predict. For this same reason, the shape of the individual modes predicted by the resolvent cannot be compared with ensemble-averaged modes educed from measurements or computations, since those educed modes do not represent the ensemble phase difference, whereas the transfer function between the resolvent modes does.
As expected from the phase interpretation of the amplitude modulation coefficient, the phase profile extracted from the cross-spectrum starts at  $\Delta \phi = 0$ at the wall, where the velocity and stress are in phase, and decreases monotonically to $-{\rm \pi}$ far from the wall, where the velocity and stress are out of phase. We then compared this phase-difference profile with the difference predicted by the resolvent mode.
The phase difference,  $\Delta \phi = \phi _{\xi _{1,1}}- \phi _{\psi _{1,1}}$ between the large-scale velocity and stress modes, calculated via the resolvent framework, was obtained by unwrapping the phases of the $\psi _{1,1}$ and $\xi _{1,1}$ modes from the wall outwards before subtraction and is illustrated in figure 2(c) in the solid line.
The phase calculation from the DNS cross-spectrum and the analysis of Jacobi et al. (Reference Jacobi, Chung, Duvvuri and McKeon2021) both indicated that the phase difference,  $\Delta \phi$, is negative across the wall layer, consistent with many other empirical studies. By contrast, the resolvent phase difference calculated here is positive very near the wall and then changes sign farther out in the wall layer. At the location of the outer spectral peak, $y_{op}$, previous studies and the DNS results indicated a phase difference of around $-{\rm \pi} /2$, consistent with the zero crossing of the amplitude modulation coefficient, $R$ (since the amplitude modulation coefficient is related to the phase difference, heuristically speaking, via $R \lesssim \cos {(\Delta \phi )}$ as noted above; see in § 2.1 for details), but the resolvent modes predicted a positive phase of approximately $+{\rm \pi} /4$.
The discrepancy between the resolvent and DNS phase calculations originates immediately at the wall, where previous studies reported a negligible phase difference and the single phase-speed resolvent predicted a positive difference. This phase disagreement at the wall is likely a result of the differences between the Fourier and resolvent mode shapes in this region, the two most prominent of which are the downstream inclination angles and near-wall modal amplitudes, as visible in figure 2. However, the discrepancy in inclination angle itself is not necessarily the primary cause for concern, since both the velocity and stress modes are similarly inclined and we are interested only in the relative phase difference between the two. The key concern is actually the discrepancy in amplitude. The resolvent mode exhibits a maximum amplitude at the location of the VLSM peak, where its phase speed matches the local mean velocity (the critical layer), and thus its amplitude closer to the wall is much lower than that of the corresponding spatial Fourier mode at the same wavenumber. This means that, from the perspective of a modal decomposition of the flow, the particular resolvent mode centred at the VLSM peak,  $\tilde {U}(y,k_x,k_z,c_{op})$, is a poor analogue for the spatial Fourier mode educed from the DNS data, $\hat {u}(y,k_x)$.
3.2. The problem with a single resolvent mode model
The fundamental problem with comparing a phase model based on a single resolvent mode with the Fourier DNS modes is that the spatial Fourier mode is really an ensemble average of the full, spatio-temporal Fourier mode,  $\hat {u}(y,k_x,k_z,\omega )$, over frequency (or, equivalently, phase speed) and spanwise wavenumber. Therefore, the spatial Fourier mode incorporates energy from a variety of phase speeds at a given wall-normal location. The range of different convection velocities, $c$, associated with a single wavenumber $k_x$ of spatial Fourier modes can be observed from the non-negligible width of two-dimensional, temporal/spatial energy spectra (Lehew, Guala & McKeon Reference Lehew, Guala and McKeon2011). Thus, we can think of the relationship between the spatial Fourier mode, $\hat {u}(y,k_x)$, and the resolvent modes, $\tilde {U}_1(y,k_x,k_z,c)$, in terms of an ensemble average
 \begin{equation} \hat{u}(y,k_x) \approx k_x \iint _{c k_z} \varGamma(k_z,c) \tilde{U}_1(y,k_x,k_z,c) \, {\rm d} k_z \, {\rm d}c, \end{equation}
where  $\varGamma (k_z,c)$ is a weighting function, representing the (unknown) joint probability density function (p.d.f.) of phase speeds and spanwise wavenumbers of the resolvent modes at a fixed wall-normal location. By utilizing a single phase speed for our resolvent mode, above, we assumed that (i) a single resolvent mode with phase speed, $c_{op}$, dominated the modes of all other phase speeds; and (ii) that this dominance applied uniformly across all $y$-locations. However, these assumptions depend on the shape and amplitude of the resolvent modes and are not satisfied.
McKeon, Sharma & Jacobi (Reference McKeon, Sharma and Jacobi2013) identified two distinct regimes of resolvent-generated modes: attached modes, which can appear as either wall modes or critical modes, and detached critical modes. Critical modes are distinguished from wall modes by expressing a localized amplitude maximum at the wall location,  $y_c$, close to where the local mean velocity matches the phase speed, $\bar {u}(y_c) =c$, known as the critical point. Attached modes are distinguished from detached by expressing a high amplitude even very near the wall, thus exemplifying Townsend's concept of exerting a ‘footprint’ on the wall. Because the detached modes are localized away from the wall, they obtain a self-similar universal form for a range of phase speeds $16 < c < U_0 - 6.15$ (Moarref et al. Reference Moarref, Sharma, Tropp and McKeon2013) that allows for the asymptotic modelling of the mode shape noted above. But this also means that detached, self-similar modes have very low amplitude near the wall, as in the case of our single critical mode considered above with a critical layer around $y_{op}$.
Figure 3(a) shows the amplitude map of the principal streamwise velocity mode,  $\psi _{1,1}(y)$, with varying convective velocity, $c$, for the streamwise VLSM structures calculated by the resolvent approach. For high convective velocities, we observe the detached, self-similar critical modes that were utilized in the analytical modelling, each centred on the wall-normal location matching its local mean velocity (marked by the black solid line). At lower convective velocities, the critical modes begin to attach to the wall, and lower still eventually lose their ‘critical’ characteristic shape and appear as attached wall modes.

Figure 3. (a) Amplitude map of the VLSM mode,  $\psi _{1,1}$, across the half-channel as a function of phase speed, $c$. The blue dashed line marks the mean velocity (and thus critical phase speed) at the outer spectral peak, $y_{op}$, and thus traces along the amplitude profile of the mode with $c_{op} = 0.71 U_0$. Due to the very low amplitude near the wall, it is clear that this mode is detached. The other coloured lines indicate large-scale modes with different phase speeds, ranging from detached to attached. These 4 modes are illustrated in the cartoon in (b). The lowest phase speed (grey), representing the mean velocity at around $y^+ \approx 10$, generates an attached wall mode. As the phase speed increases, the resolvent modes become critical and eventually detach.
Four sample modes taken from a near-wall location in figure 3(a) are sketched in figure 3(b) to illustrate how they disconnect from the wall region with increasing convective velocity. The detached (blue) mode is the mode used in the single velocity analysis above; it convects at the local mean velocity at the location of  $y_{op}$. Because it is a critical mode, its amplitude will dominate the amplitude of any other resolvent mode at the same wall-normal location. But it will not dominate over other resolvent modes closer to the wall. In fact, nearer to the wall, the amplitude of the resolvent mode defined by phase speed $c_{op}$ is negligible compared with other phase speeds. Thus the single mode centred on $y_{op}$ will not describe the statistically representative (or ‘average’) mode shape in the region close to the wall.
The fact that the critical resolvent mode centred at the outer peak is not, in fact, the dominant mode nearer to the wall creates a significant problem for computing a meaningful phase difference profile. When the phase difference from this outer-peak-centred resolvent mode was unwrapped, it incorporated phase information from locations where it was not dominant, and thus where its associated phase was also not representative. But phase unwrapping depends on the phase values everywhere along the unwrapping path in order to be reliable. If the phase near the wall is based on a mode that does not actually represent the flow, then the unwrapped phase farther from the wall where that mode is indeed representative will be contaminated. For the unwrapped phase to be physically meaningful, it must reflect the contributions of only significant, representative modes along the entire unwrapping path, from the wall to any point of interest. (This is a problem specific to the need to unwrap phase profiles and is not relevant for standard superposition analysis. The analytical study of Jacobi et al. (Reference Jacobi, Chung, Duvvuri and McKeon2021) avoided this problem by assuming a zero phase difference at the wall and a monotonic unwrapping out to the neighbourhood of the critical layer at  $y_{op}$, without verification.)
In order to predict a meaningful profile of the phase difference, we must incorporate the phase information from different resolvent modes, each one dominant and representative of the flow at a different wall-normal height, instead of just a single mode, in order to properly unwrap the phase. The challenge is therefore to determine how to construct a statistically representative composite mode.
4. Composite resolvent modes
We now turn to the question of how to construct a composite mode shape that will better represent the inter-scale phase difference. Instead of choosing a single mode with one convective velocity, a statistically representative large-scale mode can be constructed by piecewise combining modes with different convective velocities,  $c^*$, each associated with the most significant mode at its respective $y$ location, to create a dispersive ‘average’ mode shape that represents the most significant resolvent modes at all heights, reminiscent of the ‘bottom up’ perspective on the composition of VLSMs. This can be interpreted as the result of a weighted superposition of resolvent modes across all convective velocities, with the assumption that only one critical mode dominates the others at each wall-normal location, and thus we include only that dominant mode in the composition process. A more detailed, albeit heuristic, justification for employing only one dominant phase speed at each wall-normal location is outlined in Appendix C.
However, as noted, the need to preserve a meaningful phase profile presents a unique challenge to constructing this composite mode shape, in contrast with standard cases of modal superposition. Therefore we first describe a piecewise composition technique for combining energetically significant modes together that preserves the phase profile. Afterwards, we examine how to choose the most significant mode phase speeds,  $c^*$, to use in the composition.
4.1. Cumulative phase composition
In order to calculate the phase difference between different modes at a particular wall-normal location,  $y$, the phase of each mode must first be unwrapped at all $y$-positions, from the wall out to that location. Without unwrapping, the phase difference is meaningless, e.g. a wrapped phase difference of $+{\rm \pi} /2$ might actually be associated with a true phase difference of $-3 {\rm \pi}/2$ that wrapped around to the positive branch of the argument function. In the wrapped state, it is impossible to establish the lead or lag of different modes. Therefore, the correct value of the phase difference is entirely dependent on the validity of its unwrapping from the wall.
This presents a problem if we consider a piecewise composition of spatially localized mode shapes (like resolvent modes or SPOD modes), because the individual (constituent) modes used for the pieces of the composition cannot be unwrapped separately and then combined. Rather, the phase of the overall composite mode must be unwrapped as part of the composition process, itself.
In order to accomplish this simultaneous mode composition and unwrapping, we consider piecing together a set of dominant resolvent modes, each with phase speed  $c^*$ resulting in a maximum (weighted) amplitude at location $y^*$, such that the overall composite mode includes phase and amplitude information only from the neighbourhoods of these amplitude maxima, as sketched in simplified form in figure 4(a–c). In other words, one resolvent mode at each $y^*$ location (defined by its phase speed $c^*$) is assumed to contribute predominantly to the composite mode at that same location. Therefore, holding wavenumbers constant, we assume that $(y^*,c^*(y^*))$ identifies the phase speed that maximizes the weighted mode amplitude at any given $y^*$ location, shown in figure 4(a). And, for each constituent velocity or stress mode with phase speed $c^*$, the phase profile is given by $\phi (y,k_x,k_z,c^*)$, shown in figure 4(b).

Figure 4. A heuristic illustration of the phase composition method described in (4.1) for the  $\psi _{1,1}$ mode shape. At each height $y_i^*$, we identify the energetically dominant resolvent mode with phase speed $c_i^*$ from among all the different phase speeds. The amplitude profiles for three such dominant modes are shown in (a). The phase profiles for each of these modes are unwrapped from the wall, individually, in (b). The derivative of each phase profile, in the neighbourhood of its maximum amplitude, is then composited piecewise and integrated from the wall, in order to obtain an unwrapped phase profile that preserves the phase information from the dominant modal contributions at each height, as shown in (c).
Now, we can define the composite phase profile,  $\langle \phi (y,k_x,k_z) \rangle$, for a piecewise composition of modes with different phase speeds, $c^*$ at each wall-normal location, $y^*$, according to
 \begin{equation} \langle \phi(y,k_x,k_z) \rangle = \phi(0,k_x,k_z,c^*_0)+\int_{0}^{y} \frac{\partial}{\partial y} \phi(y,k_x,k_z,c^*) \big|_{y=y^*} \, {{\rm d} y}^*, \end{equation}
where  $c^*_0 \equiv c^*(0)$ is the phase speed corresponding to $y^*=0$, at the wall. This anti-derivative accumulates the phase of the different constituent modes as they are integrated together to form the composite mode, such that the phase of the resulting composite mode varies continuously and captures the slope of each constituent piece, illustrated in figure 4(c). The derivative in the integrand can be approximated numerically in the neighbourhood of the peak amplitude location, $y^*$, to any order of accuracy by writing a series expansion of $\phi (y,k_x,k_z,c^*)$ near $y^*$. Thus, we can use (4.1) to calculate a meaningful phase profile of a composite mode that is constructed from the dominant resolvent modes at all (or a subset of all) wall-normal positions.
Now, the problem is how to determine which are the dominant resolvent modes, or, in other words, what is the phase speed,  $c^*$, of the dominant mode at each wall-normal location.
4.2. Determining the dominant resolvent modes
To compare the relative importance of modes of different convective velocities,  $c$, at a given $y$ location, we consider two weighting approaches based on kinetic energy. Following the definitions of the velocity modes in (2.16), the streamwise spectral energy density of the rank-1 approximated VLSM modes, $\varPhi _1$, can be written in two different forms, depending on assumptions about the forcing
 \begin{equation} \varPhi_1 = \tilde{U}_1^* \tilde{U}_1 = \begin{cases} \sigma_{1}^2 \, |\psi_{1, 1}|^2, & \text{if}\ |\bar{\chi}_{1}|^2=1, \quad \text{broadband forcing}, \\ |\chi_{1}|^2 \, |\psi_{1, 1}|^2, & \text{unknown forcing}. \end{cases} \end{equation}
Assuming broadband forcing, the forcing projection term,  $\bar {\chi}_1$ can be set to unity, and the upper expression depends on the singular value, $\sigma _1^2$, which expresses the linear amplification of the mode, and on $\psi _{1,1}$ which expresses how that amplification is distributed over the mode's amplitude profile. This version of the kinetic energy distribution over the mode shape has the advantage of being entirely predictable from within the resolvent itself, via the singular value.
Relaxing the broadband forcing assumption, the lower expression utilizes a general velocity weighting,  $\chi_1^2$, to express the total (linear and nonlinear) weighting necessary to render the output mode shapes consistent with the unknown, nonlinear forcing. The nonlinear forcing effect was also pointed out in McKeon (Reference McKeon2017) and the idea of the colour of forcing is explored in detail in Morra et al. (Reference Morra, Nogueira, Cavalieri and Henningson2021). This weighting is not, a priori, known and must be modelled, but would, in principle, have the advantage of greater fidelity to true turbulent flows. We consider both approaches, in order to identify the phase speed, $c^*$, of the dominant resolvent mode.
4.3. Resolvent weighting: linear amplification
We adopt the broadband forcing assumption first, for simplicity. Figure 5(a) shows the map of the spectral energy density,  $\varPhi _1$, of the VLSM modes under this assumption, as a function of $y$ and $c$. The particular convection velocity, $c^*$, of the VLSM that contributes most strongly to the energy of the system at height $y$, is then given by tracing along the peak of this map, and can be written formally as
 \begin{equation} c^*(y^*,k_x,k_z) = \underset{c}{\arg\max} [\sigma_1^2(y^*,k_x,k_z,c) |\psi_{1,1}(y^*,k_x,k_z,c)|^2], \end{equation}
which is illustrated by the solid red line over the map. This function  $c^*(y)$ indicates the equivalent convective velocity profile for a representative VLSM mode that can be constructed piecewise from the dominant mode contributions at each height, $y$, with each piece convecting at a different velocity. The resulting composite modes for the VLSM are shown in figure 5(b); the corresponding small-scale (Reynolds stress) mode shapes, $\xi _{1,1}$, calculated from the same piecewise procedure as the large scales, are shown in figure 5(c).

Figure 5. (a) Spectral energy density profiles,  $\sigma _1^2 |\psi _{1, 1}|^2$, under the assumption of broadband forcing given in (4.2). The red line represents the convection velocity, $c^*$, defined in (4.3) used to construct the composite modes; (b) the composite velocity mode, $\psi _{1, 1}$; and (c) the composite Reynolds stress mode $\xi _{1, 1}$ defined by the convective velocity profile in (a); the normalization and phase line markings are the same as figure 2. (d) The phase difference, $\Delta \phi$, calculated from the composite modes is shown by the black line, contrasted with the phase from the DNS.
The piecewise modes can be compared with the single speed mode shown above in figure 2(a,b). The Reynolds modes in both cases show an initial upstream inclination and then, farther from the wall, a downstream inclination, leading to the same, problematic, positive phase difference between the large and small scales at the wall.
The profile of the phase difference between the large and small scales from the piecewise modes is shown in figure 5(d). Although the sense of the phase difference is still incorrect very near the wall, the trend appears slightly more realistic than the single mode calculation, at least farther from the wall. Nevertheless, weighting based on the linear amplification predicted by  $\sigma _1^2$ still does not seem sufficient to capture a representative signature of the VLSMs, and thus we turn to the second weighting option, involving the general velocity weighting factor, $\chi_1$.
4.4. Resolvent weighting: modelling nonlinear weights
Because the general velocity weighting cannot be determined endogenously from the resolvent calculation itself, it requires a model. A number of previous studies have considered how to model this weighting in order to align the spectral energy density predicted by the rank-1, critical mode resolvent approximation,  $\varPhi _1(y,k_x,k_z,c)$, with the true spectral energy density, $\varPhi (y,k_x,k_z,\omega )$. Moarref et al. (Reference Moarref, Sharma, Tropp and McKeon2013) introduced a phase-speed-dependent weighting function, $W({c})$, and constructed an optimization problem to correct the integrated form of $\varPhi _1$, whereas Moarref et al. (Reference Moarref, Jovanović, Tropp, Sharma and McKeon2014) applied a similar optimization approach to a matrix constructed from the velocity weighting factors, $\chi_j$, directly.
Instead of utilizing an optimization approach, in this analysis, we will adopt an empirical/heuristic argument to model the velocity weighting factors,  $\chi_j$, in order to properly weight the contributions of VLSM resolvent modes at different phase speeds for a given wall-normal location.
We begin with the empirical observation (Moarref et al. Reference Moarref, Sharma, Tropp and McKeon2013) that the pre-multiplied, streamwise spectral energy density of wall-bounded turbulence, integrated over  $\omega$, and evaluated at the $y$ location of the critical layer, $y_{c'}$, is similar in form to the low rankness measure of the rank-1 singular modes, $S(k_x,k_z,c') \equiv \sigma _1^2/\sum _{j=1}^{\infty } \sigma _j^2$, evaluated at the corresponding convection velocity, $c'$ for that same critical layer
 \begin{equation} k_x k_z \int_\omega \varPhi(y_{c'},k_x,k_z,\omega) \, {\rm d}\omega \sim S(k_x,k_z,c'), \end{equation}
where the left-hand side is a function of  $y_{c'}$ which is the specific location compatible with the specific phase speed $c'$ on the right-hand side, $\bar {u}(y_{c'}) = c'$. We assume that $(k_x,k_z,c')$ are fixed on both sides of this similarity expression.
The spectral energy density is then expressed by its rank-1 approximation including the velocity weighting
 \begin{equation} \varPhi_1(y,k_x,k_z,c) = \tilde{U}_1 \tilde{U}_1^* = |\chi_{1}(k_x,k_z,c)|^2 |\psi_{1,1}(y,k_x,k_z,c)|^2, \end{equation}
and this is substituted into the similarity statement, changing the integration from frequency to phase speed,  $d\omega = k_x \, {\rm d}c$, to obtain
 \begin{equation} k_x^2 k_z \int_c |\chi_{1}(k_x,k_z,c)|^2 |\psi_{1,1}(y_{c'},k_x,k_z,c)|^2 \, {\rm d}c \sim S(k_x,k_z,c'), \end{equation}
where we note that the velocity weighting factor  $|\chi_{1}(k_x,k_z,c)|^2$ appears similar to the $W({c})$ weighting function constructed in Moarref et al. (Reference Moarref, Sharma, Tropp and McKeon2013), with the important difference that the current factor is wavenumber dependent.
Because the mode shape dependence of the kinetic energy is already accounted for via  $\psi _{1,1}$, we focus on just the convection velocity effect in the weighting term. Therefore, we integrate the similarity statement over wall-normal position, $y_{c'}$
 \begin{equation} k_x^2 k_z \int_c |\chi_{1, 1}(k_x,k_z,c)|^2 \left[ \int_{y_{c'}}|\psi_{1}(y_{c'},k_x,k_z,c)|^2 \, {\rm d}y_{c'} \right] \, {\rm d}c \sim \int_{y_{c'}} S(k_x,k_z,c') \, {\rm d}y_{c'}, \end{equation}
and exploit the unit normalization of the integrated singular modes to eliminate the bracketed term on the left-hand side
 \begin{equation} k_x^2 k_z \int_c |\chi_{1}(k_x,k_z,c)|^2 \, {\rm d}c \sim \int_{y_{c'}} S(k_x,k_z,c') \, {\rm d}y_{c'}. \end{equation}
To simplify the right-hand side, we change the wall-normal integral into an integral over convection velocity, according to  ${\rm d}y_{c'} = ({{\rm d}\bar {u}}/{{\rm d} y})^{-1}|_{y_{c'}} \,{\rm d}c'$ and obtain
 \begin{equation} k_x^2 k_z \int_c |\chi_{1}(k_x,k_z,c)|^2 \, {\rm d}c \sim \int_{c'} S(k_x,k_z,c') \, \left(\frac{{\rm d}\bar{u}}{{\rm d} y} \right)^{{-}1}_{y_{c'}} \,{\rm d}c'. \end{equation}
Note here that  $({{\rm d}\bar {u}}/{{\rm d} y} )^{-1}_{y_{c'}} = \left ({{\rm d} y}/{{\rm d}\bar {u}} \right )_{c'}$ and thus is a function of $c'$. The integrals on both sides of the similarity can be written over $c$ and thus the integrands themselves must be similar, such that
 \begin{equation} |\chi_{1}(k_x,k_z,c)|^2 \sim \frac{1}{k_x^2 k_z} \left(\frac{{\rm d} y}{{\rm d}\bar{u}} \right)_{c} S(k_x,k_z,c), \end{equation}
and we obtain an expression for the otherwise unknown velocity weighting. (The proportionality factor is unimportant due to the  ${\arg \max }$ operation.)
Based on this empirical/heuristic argument, when seeking the particular convection velocity  $c^*$ that corresponds to the VLSM with the largest energetic contribution at a particular $y$ location, we solve
 \begin{align} c^*(y,k_x,k_z) &= \underset{c}{\arg\max} [ |\chi_1(k_x,k_z,c)|^2 |\psi_{1,1}(y^*,k_x,k_z,c)|^2 ] \end{align}
 \begin{align} & \approx \underset{c}{\arg\max} \left[ \frac{1}{k_x^2 k_z} \left(\frac{{\rm d} y}{{\rm d}\bar{u}} \right)_{\bar{u}=c} \frac{\sigma_1^2}{\sum_{j=1}^{\infty} \sigma_j^2} |\psi_{1,1}(y,k_x,k_z,c)|^2 \right]. \end{align}
 Figure 6(a) shows the map of the energy distribution of VLSM modes with this weighting model, as a function of  $y$ and $c$, where the magenta solid line indicates the dominant convective velocities, $c^*(y)$. Note that the convective velocity of the VLSM approaching the wall is predicted to be $0.59 U_0$, precisely the value that would eliminate the problematic phase difference at the wall observed in § 3.

Figure 6. Caption entries follow from figure 5 with (a) the spectral energy density profile map and optimal convection velocity defined by (4.11); (b,c) the constructed piecewise mode shapes for  $\psi _{1, 1}$ and $\xi _{1,1}$, respectively; and (d) the resulting phase difference profile between scales, compared with DNS results.
The large- and small-scale mode shapes generated by the piecewise profile of convective velocities are shown in figure 6(b,c), respectively. The differences between these modes and previous mode shapes are quite significant. In particular, the Reynolds mode no longer exhibits a change in inclination angle near the wall, and as a consequence, the weighting model results in a negligible phase difference between large and small scales at the wall itself, consistent with experimental observations and with the assumptions of the previous analytical approach.
The profile of the phase difference,  $\Delta \phi$, is shown in figure 6(d) and compares reasonably well with that calculated from the DNS channel data at matched Reynolds number. Unlike the single mode or linear-weighted, piecewise mode approaches, the sign of the phase difference appears accurate across the entire near-wall region. Using the new $\chi_j$ weighting therefore results in a reasonably close estimate of the inter-scale phase profile.
However, the agreement between the Fourier and composite modes is still not perfect. The inclination of the composite velocity mode is still much steeper than the corresponding Fourier spatial mode. And near the wall, the composite mode seems to under-predict the magnitude of the phase lag, while over-predicting it farther from the wall. This discrepancy is likely a result of the single-wavenumber simplification at the foundation of the modelling approach, in which we inferred from the cross-spectral power in figure 1(c) that a narrow range of wavenumbers dominates the inter-scale coupling, and thus we excluded terms with wavenumbers beyond the specific scale of interest from (2.6a). But this simplification does not apply near the wall, where the range of scales participating in scale interactions broadens significantly. Moreover, we assumed that only a single spanwise wavenumber,  $k_z$, dominated the flow. It is also important to note that, because the weighting formula was derived from the streamwise energy spectrum, its application to other velocity components is less certain, and other weighting models may be required, as discussed in Appendix D.
Nevertheless, the weighted profile reproduces the wall-normal location where the phase difference is  $-{\rm \pi} /2$ to within 20 %, which is less than the $40\,\%$ relative variation in zero-crossing location due to varying the filter cutoff reported by Mathis et al. (Reference Mathis, Hutchins and Marusic2009). The $-{\rm \pi} /2$ location of the predicted phase profile is important because the resolvent model prediction of the phase difference profile, $\Delta \phi (k_x)$ represents a wavenumber-specific contribution to the amplitude modulation coefficient, $R$, which averages phase-difference contributions over all wavenumbers, $R = \langle \cos {(\Delta \phi (k_x))} \rangle$. Thus, the $-{\rm \pi} /2$ phase location corresponds to the zero-crossing point of the amplitude modulation coefficient and the VLSM energetic peak at around $y^+= 3.9Re^{1/2}$. And the profile of the amplitude modulation coefficient, in turn, plays an important role in efforts at inner-outer wall modelling. In particular, Mathis, Hutchins & Marusic (Reference Mathis, Hutchins and Marusic2011a) showed that their modelling coefficient, $\beta$, which regulates the magnitude of influence of the outer large-scale fluctuations, is basically identical to $R$. Therefore, the resolvent model could be used to generate the $\beta$ coefficient for inner–outer models, independent of experimental data, after which it can be incorporated into large-eddy simulation (LES) wall models that use the inner–outer modelling formulation, like in the work of Inoue et al. (Reference Inoue, Mathis, Marusic and Pullin2012). Or, the inner–outer model could be rewritten in the spectral domain as presented in Baars, Hutchins & Marusic (Reference Baars, Hutchins and Marusic2016b), on a wavenumber-by-wavenumber basis, in which case the wavenumber-specific phase difference could be employed directly.
Because of the importance of identifying the  $-{\rm \pi} /2$ phase crossing location, we explored the effect of different choices for the dominant wavenumbers, $k_x$ and $k_z$, on this point of the phase profile.
4.5. Wavenumber and Reynolds number dependence
The above analysis showed that a composite VLSM mode based on appropriately weighted convective velocity contributions can reasonably predict the phase-difference profile between large- and small-scale motions. But that analysis studied only a single VLSM scale, with fixed spatial wavenumbers  $(k_x, k_z) = (0.75, 6)$ corresponding to the energetic outer peak in the premultiplied energy spectral density map at a single Reynolds number, ${Re} = 5200$. Other large-scale motions also contribute to the modulation between large and small scales, and thus we examine how the phase difference varies with wavenumber, for a fixed Reynolds number, and also how changing the Reynolds number affects the phase profile.
Figure 7(a) shows the phase difference evaluated at the outer spectral peak location,  $\Delta \phi (y_{op})$, over a wide range of streamwise and spanwise wavenumbers corresponding to different isolated scales, overlaid with the contour lines of the premultiplied streamwise spectral energy density. The phase difference is negative for all scales, indicating that the small-scale envelope of fluctuations always (spatially) leads the large scale, irrespective of the wavenumbers. However, the magnitude of the phase lead varies with wavenumber; for a band of large scales with $k_x \sim {O}(1)$, the phase lag at the outer spectral peak is approximately $-{\rm \pi} /2$, consistent with experimental findings. But the magnitude of the lead tends to increase with increasing $k_x$, which means that the $-{\rm \pi} /2$ point between the large and small scales moves closer to the wall, in outer units. We visualize this shift in the $-{\rm \pi} /2$ point directly in figure 7(b), which shows the relative error in the predicted location of the $-{\rm \pi} /2$ phase shift vs the outer spectral peak location, $y_{op}$. As noted above, this location corresponds to the $R=0$ point in the amplitude modulation analysis and can vary by as much as $40\,\%$ due to changing filter cutoffs (Mathis et al. Reference Mathis, Hutchins and Marusic2009). Nevertheless, there is a significant band of large-scale motions across all spanwise wavenumbers which predict the crossing point to within $5\,\%$.

Figure 7. (a) The phase difference  $\Delta \phi$ of the composite mode at the location of the outer energy peak $y_{op}$ for varying streamwise and spanwise wavenumbers. The black lines indicate the contour levels [0.1, 0.3, 0.6] of the two-dimensional pre-multiplied energy spectrum $k_xk_z\phi _{uu}(k_x, k_z)$ of ${Re}=5200$ DNS channel flow. The red circle marks the wavenumber, $(k_x, k_z) = (0.75, 6)$, used for the composite modes above in § 3 and § 4. (b) The relative error in the predicted location of the $-{\rm \pi} /2$ phase shift compared with the outer energy peak location, $y_{op}$, across all the wavenumbers. The relative error for the composite mode case (red circle) is $19\,\%$, while a slightly smaller LSM, $(k_x, k_z) = (1, 3)$, (blue square) exhibits an error of only $4\,\%$. The predicted mode shapes between these two cases were not significantly different.
Mathis et al. (Reference Mathis, Hutchins and Marusic2009) showed that as the filter-cutoff wavenumber increased, the zero crossing in  $R$ moved away from the wall (and the amplitude of the correlation increased generally). Physically, by increasing the filter-cutoff wavenumber, fewer large scales are included in the small-scale signal. This means that the large- and small-scale signals diverge in phase more slowly (moving away from the wall), because the large scales can exert more influence over a signal containing few energetic large-scale signals, resulting in the outward shift of the zero-crossing location. Decreasing the filter-cutoff wavenumber puts more large scales in the small-scale signal, resulting in less influence of the large scales over other large scales, a faster divergence of phase (away from the wall), and an inward shift of the zero crossing. In other words, the trend in the zero crossing can be explained in terms of the greater ease with which large scales can modulate smaller scales compared with modulating other large scales.
In the current model, the predicted trend in zero crossing is different, because the current model only examines a single scale, without any cutoff filter. Thus the current model is more like the filtered case with relatively large scales appearing in both signals, in which case the divergence happens more quickly due to the weaker ability of one signal to modulate the other. Therefore, for a single-wavenumber resolvent mode, increasing the wavenumber means that equivalent-sized smaller scales are interacting with each other, and are less able to influence one another than larger, energetic scales would be, thus resulting in a faster phase divergence (away from the wall) and a  $-{\rm \pi} /2$ shift closer to the wall. The rate of phase divergence of the resolvent model therefore offers a measure of the degree of influence between velocity and stress modes that is scale specific, and supports the idea that targeting lower wavenumber pairings of velocity and stress can result in faster and more effective modulation between the two.
The streamwise wavenumber of the large scales,  $k_x$, exerts a much stronger influence on the phase profile behaviour than the spanwise wavenumber, $k_z$, although the best predictions for the $-{\rm \pi} /2$ phase crossing occur for the region aligned with $k_x \approx 0.65 k_z^{1/2}$ or $\lambda _x \approx 3.8 \lambda _z^{1/2}$. Jimenez & Hoyas (Reference Jimenez and Hoyas2008) reported that the two-dimensional spectral contours of the streamwise velocity are aligned along $\lambda _x \approx y^{-1} \lambda _z^2$ curves, representing streamwise-oriented, conical velocity structures. Therefore, the vortex structures associated with the best prediction of the phase profile are also conical velocity structures, but wider and squatter than those associated with the energetic peak. The additional width may represent the statistical effect of streamwise meandering of the large scales, which is not captured by the spanwise homogeneous construction of the resolvent operator. The fact that the spanwise and streamwise dimensions scale disproportionately also indicates that the predominant scales involved in the phase profile construction are not geometrically self-similar, which is possibly a low Reynolds number effect as noted by Deshpande et al. (Reference Deshpande, Chandran, Monty and Marusic2020), although this may also indicate limitations to the chosen weighting, which is based on streamwise energy alone.
The effect of the Reynolds number on the phase-difference prediction was also examined, specifically in the context of the  $y$-location where the phase difference between scales equal $-{\rm \pi} /2$ which roughly corresponds to the zero-crossing location of the amplitude modulation coefficient, as noted above, and to the location of the outer spectral energy peak, given empirically as $y_{op}^+ \approx 3.9{Re}^{1/2}$.
To see if this empirical trend is obeyed by the predicted phase differences, we calculated the  $y$-location of the $-{\rm \pi} /2$ phase difference against Reynolds number, shown by the red circles in figure 8 for the wavenumber pair used in the earlier sections. Although the predicted trend is consistent with an increasing zero-crossing location with Reynolds number, the prediction appears to saturate much more quickly than experiments. This is likely due to the fact that the resolvent includes only a single wavenumber, $k_x$, for the large scales, whereas the true $R(y)$ signal (on which the zero-crossing empirical observation is based) depends on an integral across all such wavenumbers, as shown in § 2.1. Including different (or multiple) streamwise and spanwise wavenumber contributions, perhaps in self-similar triadic hierarchies as demonstrated in Sharma, Moarref & McKeon (Reference Sharma, Moarref and McKeon2017), would introduce additional phase differences into that integral. In particular, higher values of $k_x$ and lower values of $k_z$ tend to be associated with larger phase differences at a fixed $y$-location, as shown in figure 7(a), which means that the $-{\rm \pi} /2$ location would tend to shift closer to the wall, as noted above. Therefore, the exclusion of these smaller scales would tend to result in exaggerating the wall-normal location of the $-{\rm \pi} /2$ phase, thus possibly explaining why the single-wavenumber model trend differs from empirical trends that are based on a correlation coefficient.

Figure 8. Wall-normal height where the phase difference,  $\Delta \phi = -{\rm \pi} /2$ vs Reynolds number. The discrete markers denote resolvent predictions from the current model using mean flow quantities from DNS channel flows at: ${Re} =180, 550, 1000, 2000$ from Hoyas & Jiménez (Reference Hoyas and Jiménez2008) and $5200$ from Lee & Moser (Reference Lee and Moser2015); the red circles are calculated for wavenumbers $(k_x, k_z) = (0.75, 6)$ (corresponding to the red circle in figure 7); the blue squares are calculated for $(k_x, k_z) = (1, 3)$ (the blue square in figure 7). The black dashed line represents the relation of $3.9{Re}^{1/2}$ from Mathis et al. (Reference Mathis, Hutchins and Marusic2009), and red dashed line is $0.42{Re}^{3/4}$ inferred from Klewicki et al. (Reference Klewicki, Fife, Wei and McMurtry2007).
To test this explanation, we plotted the Reynolds number trend of the  $-{\rm \pi} /2$ phase location for an alternative wavenumber pair, $(k_x,k_z) = (1, 3)$, which was shown to more accurately identify the $y_{op}$ location for the ${Re} = 5200$ case in figure 7(b), with less than $5\,\%$ relative error. The trend for this wavenumber pair is shown by the blue squares in figure 8 and indicates that the over-saturation can be rectified by utilizing large-scale motion (LSM) modes with larger spanwise extent relative to streamwise extent. Again, this indicates that non-self-similar LSMs play an important role in accurate prediction of the phase profile and the zero-crossing location of the amplitude modulation.
Physically, we can interpret the trend of the increasing  $-{\rm \pi} /2$ phase location as a reduction in the divergence rate between large and small scales (moving away from the wall, described above), or equivalently an increase in the ease of modulation between the velocity and stress modes. The fact that this phase location saturates faster for lower $k_x$ and slower for higher $k_x$ suggests that large, energetic velocity and stress modes are more easily aligned with each other as the Reynolds number increases and diffusive delays in the scale interactions become negligible. But under this interpretation, the $-{\rm \pi} /2$ phase location reflects the ease of modulation and thus we would not expect an asymptotic limit to the growth in that location with increasing Reynolds number.
5. Conclusions
The recent emphasis on the use of large-scale actuation to modify the small scales of turbulence revived interest in the question of how the large and small scales are related. Jacobi et al. (Reference Jacobi, Chung, Duvvuri and McKeon2021) established a framework for representing the large scales as a single, isolated VLSM mode, and the small scales as the corresponding Reynolds stress mode filtered at the same scale, and then approximated the mode shapes using self-similar resolvent modes to obtain an analytical expression describing the phase difference between the two scales.
In this study, we formally justified the single-wavenumber resolvent framework via cross-spectral analysis, and then implemented it numerically in order to explore how the predicted phase difference depended on the nature of the underlying resolvent mode. We found that using a VLSM with a single convective velocity to represent the large-scale signal resulted in an incorrect prediction of the inter-scale phase difference, because an isolated resolvent is spatially localized near its critical layer and thus not sufficiently representative of the statistically averaged modes in turbulent, wall-bounded flows, across the height of the channel. This localization meant that the unwrapped phase difference between the velocity and stress modes was also not representative of the true flow. Therefore, we constructed a statistically representative resolvent mode via a piecewise composition of dominant modes with distinct convection velocities at different wall-normal locations in order to capture a meaningful sense of the phase difference.
The key to constructing this piecewise dispersive VLSM mode was developing a realistic weighting scheme for the kinetic energy associated with individual modes, so that the most significant mode at each wall-normal height could be selected. We derived a model for this weighting, based on the empirical similarity between the spectral energy density of wall-bounded turbulence and the low-rankness measure for the resolvent operator. This model was shown to reproduce a negligible phase difference between scales at the wall, along with a realistic phase-difference profile when compared with the phase obtained via the cross-spectrum of filtered, velocity and stress measurements from a channel flow DNS. The effectiveness of the piecewise VLSM mode is consistent with the bottom-up view of VLSMs in which a dispersive packet of relatively small scales appears instantaneously as a large-scale motion, as suggested by e.g. Adrian, Meinhart & Tomkins (Reference Adrian, Meinhart and Tomkins2000), Dennis & Nickels (Reference Dennis and Nickels2011) and Deshpande, de Silva & Marusic (Reference Deshpande, de Silva and Marusic2022b) among others.
The piecewise VLSM model also indicated that the wall-normal location (in inner scaling) where the velocity and stress signals were separated in phase by  $-{\rm \pi} /2$ tended to increase with Reynolds number, consistent with empirical observations of the zero-crossing location of the amplitude modulation coefficient of Mathis et al. (Reference Mathis, Hutchins and Marusic2009) and the outer peak of the turbulence intensity reported in Marusic et al. (Reference Marusic, Mathis and Hutchins2010), although the exact form of the predicted trend is different, likely due to the use of only a single wavenumber in the model.
However, despite the predictions provided by the current analysis, the use of white-noise forcing in the resolvent modes and the composite nature of the phase-difference reconstruction process both represent serious limitations. As we noted, if not for the need to calculate phase differences between correlated velocity and stress modes, it would have been desirable to work with more accurate resolvent modes based on coloured-noise forcing, which better captures the empirical modes educed by SPOD. Extending current SPOD tools to allow for such phase-difference calculations would thus be a valuable step towards more accurately describing the scale-interaction problem in terms of the phase differences between interacting modes. Similarly, classical superposition of predicted mode shapes would have been preferable to the more ad hoc phase composition utilized in the current study, but such superposition relies on an empirical knowledge of the distribution of phase speeds of different modes, which remains a question for observational studies.
The ability to predict the phase difference between velocity and stress fluctuations via a resolvent framework has implications for modelling the amplitude modulation process that are crucial for understanding near-wall turbulent behaviour, particularly as it relates to modifying drag via the near-wall cycle. Moreover, the intimate connection identified here between the dispersion of convective velocities among VLSMs and the resulting average phase difference between velocity and stress fluctuations indicates that many of the recent studies on Taylor's hypothesis and the identification of accurate convective velocities (e.g. Yang & Howland Reference Yang and Howland2018; Liu & Gayme Reference Liu and Gayme2020) are also highly relevant for understanding the scale-interaction problem in turbulence and for extending the reach of the resolvent modelling framework to smaller scales.
Acknowledgements
The authors thank the anonymous referees for their criticisms and suggestions which helped to refine the ideas presented here.
Funding
The authors gratefully acknowledge the support of Israel Science Foundation grant 219/21.
Declaration of interests
The authors report no conflict of interest.
Appendix A. Cutoff impact
The relationship between the cross-spectrum of the filtered signals,  $\hat {u}_L \widehat {u_S^2}^*$, presented in Mathis et al. (Reference Mathis, Hutchins and Marusic2009) and the cross-spectrum of the unfiltered signals, $\hat {u} \widehat {u^2}^*$, used in the current study, is expressed in (2.4) in § 2.1, repeated here for convenience
 \begin{equation}
\underbrace{\vphantom{\left(\widehat{u^2_S}^* + 2
\widehat{u_L u_S}^*+ \widehat{u^2_L}^* \right)} \hat{u}^*
\widehat{u^2}}_\text{unfiltered} =
\underbrace{\vphantom{\left(\widehat{u^2_S}^* + 2
\widehat{u_L u_S}^*+ \widehat{u^2_L}^* \right)}\hat{u}^*_L
\widehat{u^2_S}}_\text{filtered} +
\underbrace{\vphantom{\left(\widehat{u^2_S}^* + 2
\widehat{u_L u_S}^*+ \widehat{u^2_L}^* \right)}2
\hat{u}^*_L \widehat{u_L u_S}}_\text{negligible} +
\underbrace{\vphantom{\left(\widehat{u^2_S}^* + 2
\widehat{u_L u_S}^*+ \widehat{u^2_L}^* \right)}\hat{u}^*_L
\widehat{u^2_L}}_\text{self-modulation} +
\underbrace{\vphantom{\left(\widehat{u^2_S}^* + 2
\widehat{u_L u_S}^*+ \widehat{u^2_L}^* \right)}\hat{u}^*_S(\widehat{u^2_S} + 2 \widehat{u_L
u_S}+ \widehat{u^2_L})}_\text{small-scale contribution}.
\end{equation}
\begin{equation}
\underbrace{\vphantom{\left(\widehat{u^2_S}^* + 2
\widehat{u_L u_S}^*+ \widehat{u^2_L}^* \right)} \hat{u}^*
\widehat{u^2}}_\text{unfiltered} =
\underbrace{\vphantom{\left(\widehat{u^2_S}^* + 2
\widehat{u_L u_S}^*+ \widehat{u^2_L}^* \right)}\hat{u}^*_L
\widehat{u^2_S}}_\text{filtered} +
\underbrace{\vphantom{\left(\widehat{u^2_S}^* + 2
\widehat{u_L u_S}^*+ \widehat{u^2_L}^* \right)}2
\hat{u}^*_L \widehat{u_L u_S}}_\text{negligible} +
\underbrace{\vphantom{\left(\widehat{u^2_S}^* + 2
\widehat{u_L u_S}^*+ \widehat{u^2_L}^* \right)}\hat{u}^*_L
\widehat{u^2_L}}_\text{self-modulation} +
\underbrace{\vphantom{\left(\widehat{u^2_S}^* + 2
\widehat{u_L u_S}^*+ \widehat{u^2_L}^* \right)}\hat{u}^*_S(\widehat{u^2_S} + 2 \widehat{u_L
u_S}+ \widehat{u^2_L})}_\text{small-scale contribution}.
\end{equation}
The discrepancy between the two right-most terms is determined by the choice of cutoff wavenumber, and thus any discrepancy is essentially arbitrary, within the limits of the acceptable filter cutoffs,  $k^*_x$, discussed in Mathis et al. (Reference Mathis, Hutchins and Marusic2009), which ranged from $1.6 \lesssim k^*_x \lesssim 30$.
Figure 9 illustrates the relative distribution of cross-spectral energy density between the modulation term,  $\hat {u}_L^* \widehat {u_S^2}$, and self-modulation term, $\hat {u}_L^* \widehat {u_L^2}$, as a function of filter cutoff wavelength, $\lambda _c$, ranging from $1$ to $4$ (from left to right, and the corresponding $k_c$ ranging from 6.3 to 1.6). All of these cutoffs produce qualitatively similar amplitude modulation coefficients, and yet the relative contribution of self-modulation is quite different. As the filter wavelength cutoff increases (filter wavenumber decreases) and more large scales are included in the small-scale signal, the self-modulation effect decreases, inter-scale modulation effect dominates. This indicates that the self-modulation effect among large-scale motions tends to enhance the standard modulation between larger- and smaller-scale motions, but that the two effects are not qualitatively different, because the modulation is always occurring between relatively large-scale motions.

Figure 9. Effect of filter-cutoff wavelength,  $\lambda _{c}$ on the cross-spectral energy density for: (a–c) modulation, $\hat {u}_L^* \widehat {u_S^2}$, and (d–f) self-modulation, $\hat {u}_L^* \widehat {u_L^2}$, effects. From left to right, $\lambda _{c} = 1,2,4$. The corresponding cutoff wavenumbers, $k_x$, are marked in the dashed line.
The idea that the amplitude modulation coefficient represents an interaction with objectively small scales, say  $\lambda < 0.1$ ( $k> 62.8$), is simply not true. It is precisely because the self-modulation among large scales is not qualitatively different from the modulation with relatively smaller scales that the analysis performed here without any scale-based filtering is expected to capture all of the same scale-interaction trends as the traditional filtered analysis.
Appendix B. An alternative development for  $\tilde {R}_{ij}$

As noted at the end of § 2, there is an alternative approach for predicting the Reynolds stress modes. Returning to (2.13a), in the primary analysis we assumed that  $\boldsymbol{\mathsf{G}}$ was uncorrelated with the scale interactions and thus could be neglected. Here, instead, we retain $\boldsymbol{\mathsf{G}}$ and treat it as an unknown, nonlinear forcing and perform the resolvent analysis to obtain the Reynolds stresses, $\boldsymbol{\mathsf{R}}$. To do this, we substitute the expression for $\boldsymbol{\mathsf{U}}$ in terms of $\boldsymbol{\mathsf{R}}$ from (2.12)
 $$\begin{gather} \boldsymbol{\mathsf{A}}\boldsymbol{\mathsf{R}}+\boldsymbol{\mathsf{J}}\boldsymbol{\mathsf{U}} = \boldsymbol{\mathsf{G}}, \end{gather}$$
 $$\begin{gather}\boldsymbol{\mathsf{A}}\boldsymbol{\mathsf{R}}+\boldsymbol{\mathsf{J}}\mathcal{H} \boldsymbol{\mathsf{B}}_2 \boldsymbol{\mathsf{R}} = \boldsymbol{\mathsf{G}}, \end{gather}$$
and then formulate a new resolvent operator,  $\mathcal {H}_G$, whose output is $\boldsymbol{\mathsf{R}}$ according to
 \begin{equation} \boldsymbol{\mathsf{R}} = \underbrace{(\boldsymbol{\mathsf{A}}+\boldsymbol{\mathsf{J}}\mathcal{H} \boldsymbol{\mathsf{B}}_2)^{{-}1}}_{\mathcal{H}_G} \boldsymbol{\mathsf{G}}. \end{equation}
We can then calculate the most amplified Reynolds modes via the SVD, and then use the Reynolds modes to obtain the corresponding large-scale modes, in the reverse direction described above.
A key challenge in formulating the resolvent for  $\boldsymbol{\mathsf{R}}$ is how to define an appropriate weighting matrix to enforce a physically meaningful energy norm for the SVD. We chose to define the weighting matrix $\boldsymbol{\mathsf{W}}$ obtained from the Cholesky decomposition of the positive definite matrix $\boldsymbol{\mathsf{P}}$, so that $\boldsymbol{\mathsf{R}}^H \boldsymbol{\mathsf{P}} \boldsymbol{\mathsf{R}}$ produces a pseudo-energy norm, which is close but not exactly proportional to the squared kinetic energy defined via the Reynolds normal stresses. $\boldsymbol{\mathsf{P}}$ is defined in terms of the small parameter $\epsilon$ as
 \begin{equation} \boldsymbol{\mathsf{P}} = \left[\begin{array}{@{}cccccc@{}} 1+\epsilon & 1-\epsilon & 1-\epsilon & 0 & 0 & 0\\ 1-\epsilon & 1+\epsilon & 1-\epsilon & 0 & 0 & 0 \\ 1-\epsilon & 1-\epsilon & 1+\epsilon & 0 & 0 & 0 \\ 0 & 0 & 0 & \epsilon & 0 & 0 \\ 0 & 0 & 0 & 0 & \epsilon & 0 \\ 0 & 0 & 0 & 0 & 0 & \epsilon \end{array}\right], \end{equation}
such that the error with respect to the true squared kinetic energy is  ${O}(\epsilon )$, according to
 \begin{align} \boldsymbol{\mathsf{R}}^H \boldsymbol{\mathsf{P}} \boldsymbol{\mathsf{R}} &= \frac{1}{2} \left| \tilde{R}_{xx} + \tilde{R}_{yy} + \tilde{R}_{zz} \right|^2\nonumber\\ &\quad + \epsilon \frac{1}{2} \left[|\tilde{R}_{xx}|^2 + |\tilde{R}_{xy}|^2 + |\tilde{R}_{xz}|^2 + |\tilde{R}_{yy}|^2 + |\tilde{R}_{yz}|^2 + |\tilde{R}_{zz}|^2 \right.\nonumber\\ &\quad \left. - (\tilde{R}_{yy}+\tilde{R}_{zz})\tilde{R}_{xx}^H - (\tilde{R}_{xx}+\tilde{R}_{zz})\tilde{R}_{yy}^H - (\tilde{R}_{xx}+\tilde{R}_{yy})\tilde{R}_{zz}^H \right]. \end{align}
For computational purposes, we chose  $\epsilon = 0.001$.
In order to examine the rank-1 streamwise mode shapes that are produced via the new Reynolds stress resolvent, it is useful to first remind ourselves of the large- and small-scale mode shapes produced by the earlier approach.
Figure 10 shows the map of both mode shapes using the earlier method, where figure 10(a) is the same map of the large-scale mode shapes shown in figure 3(a), and figure 10(b) shows the shape of the Reynolds stress modes. Both large and small scales exhibit regions of attached and detached modes, varying with convection velocity,  $c$. This is consistent with the assumption of Jacobi et al. (Reference Jacobi, Chung, Duvvuri and McKeon2021) that the Reynolds modes obtain a similar shape to the large-scale, isolated velocity modes.

Figure 10. Amplitude of (a)  $\psi _{1,1}$ and (b) $\xi _{1,1}$ mode for taking SVD of (2.12) shown in § 2. The magnitude was normalized by the maximum across all heights for each wave speed. The red dashed line represents the wall-normal location of the outer energy peak, $y_{op}$. The cyan lines represent the local mean velocity profile.
Turning to the new approach, figure 11 shows the map of both mode shapes in which the Reynolds stresses were calculated via the resolvent first, utilizing the pseudo-energy norm. The Reynolds stresses shown in figure 11(b) continue to exhibit attached and detached mode shapes, depending on  $c$. However, the associated large-scale motions, calculated from the Reynolds stress modes, are all detached, for all convection velocities. In particular, the large-scale modes with low convection velocities appear to have the bulk of their energy in the outer flow.

Figure 11. Amplitude of (a)  $\psi _{1,1}$ and (b) $\xi _{1,1}$ mode for the alternative approach discussed in Appendix B. The magnitude was normalized by the maximum across all heights for each wave speed.
Besides not bearing any resemblance to physical large-scale modes, the fact that these large-scale modes are all detached makes it impossible to unwrap a meaningful phase from the wall, using the piecewise mode superposition discussed in § 4. Thus, this approach of applying the resolvent to the Reynolds stress directly was not pursued further.
Appendix C. Rationale for local critical mode dominance
The basic rationale for considering just a single critical mode at each height, instead of the full superposition of all modes at all frequencies (or, equivalently, phase-speeds), is that the critical mode is assumed to dominate the other modes at its critical wall location. To make this more precise, we can write the superposition process by starting from the basic resolvent formalism (superposition), which is given in (3.1)
 \begin{equation} \hat{u}(y,k_x) \approx k_x \iint _{c k_z} \varGamma(k_z,c) \tilde{U}_1(y,k_x,k_z,c) \, {\rm d} k_z \, {\rm d}c, \end{equation}
and then substitute the (unweighted), rank-1 approximate resolvent mode into the superposition, where  $\tilde {U}_1(y,k_x,k_z,c) \approx \sigma _1(y,k_x,k_z,c) \tilde {\psi }_{1,1}(y,k_x,k_z,c)$ by
 \begin{equation} \hat{u}(y,k_x) \approx k_x \iint _{c k_z} \varGamma(k_z,c) \sigma_1(y,k_x,k_z,c) \tilde{\psi}_{1,1}(y,k_x,k_z,c) \, {\rm d} k_z \, {\rm d}c, \end{equation}
where  $\sigma _1$ and $\tilde {\psi }_{1,1}$ are defined as in § 2.4.
If we assume that the resolvent mode is critical and that this critical mode has its maximum amplitude in a region of width  $\epsilon = (k_x ({{\rm d} \bar {u}}/{{\rm d} y})|_c {Re})^{-1/3}$ (Jacobi et al. Reference Jacobi, Chung, Duvvuri and McKeon2021), then in the limit of very high Reynolds number, we can approximate the resolvent mode as $\tilde {\psi }_1(y,k_x,k_z,c) \approx \psi _1(y,k_x,k_z,c) \delta (c-\bar {u}(y))$, where the Dirac delta distribution takes the place of the distribution function representing the true width of the critical layer. Substituting into the superposition integral above, we obtain
 \begin{equation} \hat{u}(y,k_x) \approx k_x \int _{k_z} \varGamma(k_z,\bar{u}(y)) \sigma_1(y,k_x,k_z,\bar{u}(y)) {\psi}_1(y,k_x,k_z,\bar{u}(y)) \, {\rm d} k_z. \end{equation}
And thus we see that choosing the critical mode, with phase speed  $c = \bar {u}(y)$ at each $y$-location is equivalent to the full superposition, under the assumption that the resolvent mode is critical (and not a wall mode), and that the critical layer is very thin (in the limit of large Reynolds number). Of course, neither of these assumptions is exactly correct, but this is the basis for the modelling simplifications in order to consider just a single critical mode at each wall-normal location.
In reality, the maximum amplitude of the modes does not occur at precisely the location where the local mean velocity and phase velocity match, particularly for wall attached modes, and thus we employ the semi-empirical weighting scheme (in terms of  $\chi$) to select the optimal phase speed, $c^*(y) \neq \bar {u}(y)$, as derived in (4.4)–(4.12).
Appendix D. Other velocity components
Talluru et al. (Reference Talluru, Baidya, Hutchins and Marusic2014) measured the amplitude modulation coefficient results for all three small-scale velocity components correlated with the streamwise large scales and reported that all three correlation coefficient profiles appeared very similar. Prior to that, Jacobi & McKeon (Reference Jacobi and McKeon2013) measured the cross-correlation phase maps for the streamwise large scales with wall-normal small scales, and reported that the sense of phase was also the same as that of the purely streamwise case. Therefore, we also examined whether the phase difference predicted between  $\tilde {U}$ and the small scales $\tilde {R}_{yy}$ and $\tilde {R}_{zz}$ followed these empirical reports, given the success of the prediction for $\tilde {R}_{xx}$ above.
However, the composite mode weighting utilized above was developed based on the empirical similarity between the low-rankness measure and the streamwise spectral energy density; it seems reasonable to assume that this weighting is therefore best suited for streamwise fluctuations and may not be appropriate for small-scale fluctuations in other directions. Therefore, for these other Reynolds stress components, we considered both the composite profile approach as well as a few select examples from the single mode approach, utilizing a range of convection velocities. We also considered the possibility that the appropriate filter wavenumbers,  $\boldsymbol {k_f}$, may vary across velocity components; in particular that the spanwise component might be better filtered at a significantly smaller scale (higher wavenumber) than the streamwise and wall-normal components.
Figure 12(a) shows the phase-difference profiles predicted for  $\tilde {U}$ vs $\tilde {R}_{yy}$, utilizing both the single mode and composite mode approximations, where the single mode employs the range of convection velocities illustrated in figure 3(a). As expected, the composite mode weighting does not capture the correct phase profile shape or sign, but the single velocity modes indicate that a better choice of $c$ could result in a better prediction, if a new weighting were developed for the $\tilde {R}_{yy}$ component.

Figure 12. (a) Phase difference between  $\tilde {U}$ mode and $\tilde {R}_{yy}$ mode. The four colours of the thinner solid lines represent the four phase speeds in figure 3; the composite mode is denoted by the thick black solid line. (b) Phase difference between $\tilde {U}$ mode and $\tilde {R}_{zz}$ mode with fixed phase speed $c/U_0= 0.69$ for $(k_x, k_z) = (0.75, 6)$ and $(4, 32)$ for solid and dashed red lines, respectively. The circles are the DNS points for the $\tilde {U}$ vs $\tilde {R}_{xx}$ comparisons above, which should be similar to the other Reynolds stress components, according to Talluru et al. (Reference Talluru, Baidya, Hutchins and Marusic2014).
Similarly, figure 12(b) shows the phase-difference profiles predicted for  $\tilde {U}$ vs $\tilde {R}_{zz}$, utilizing both the single mode and composite mode approximations, where the single mode employs two different wavenumbers, $k_x = 0.75$ as above, and a much smaller scale with $k_x = 4$. Here again, the composite mode weighting fails to capture the correct phase profile shape or sign; in particular it predicts that the large and small scales are out of phase at the wall. But a new weighting formula that incorporates different wavenumbers, $k_x$, maybe be able to rectify this discrepancy, as alluded to in the figure.
Because the emphasis of the current study was on the streamwise components,  $\tilde {U}$ and $\tilde {R}_{xx}$, that are commonly reported experimentally, the development of weighting models for the other velocity and stress components has not yet been pursued.


 Open access