


1. Introduction
The theory of unsteady flow through porous media can be applied to a variety of different systems. For example, it can be used to describe wave-induced flow through the seabed (Gu & Wang Reference Gu and Wang1991) or coral reefs (Lowe et al. Reference Lowe, Shavit, Falter, Koseff and Monismith2008) or the propagation of acoustic and seismic waves through the Earth (Biot Reference Biot1956a,Reference Biotb). Furthermore, Cha et al. (Reference Cha, Balaras, Lieber, Sadasivan and Wakhloo2007) modelled endovascular coil embolisation, a treatment for aneurysms, as a porous medium interacting with the blood flow. In engineering applications, unsteady flow through porous media can be used to describe regenerator-type heat exchangers (Trevizoli, Peixer & Barbosa Reference Trevizoli, Peixer and Barbosa2016) or pulsed flow in chemical reactors (Ni et al. Reference Ni, Mackley, Harvey, Stonestreet, Baird and Rama Rao2003).
Using the volume-averaging framework (Whitaker Reference Whitaker1966, Reference Whitaker1986) or homogenisation theory (Ene & Sanchez-Palencia Reference Ene and Sanchez-Palencia1975), a macroscopic description of flow through porous media can be derived from the Navier–Stokes equations. The macroscopic variables are the superficial velocity, which is defined as
 \begin{equation} \left\langle\boldsymbol{u}\right\rangle_{{s}} = \frac{1}{V} \int_{V_{{f}}} \boldsymbol{u}\,\mathrm{d}V , \end{equation}
and the intrinsic pressure, which is defined as
 \begin{equation} \left\langle \,p\right\rangle_{{i}} = \frac{1}{V_{{f}}} \int_{V_{{f}}} p\,\mathrm{d}V, \end{equation}
where  $V_{{f}}$ is the volume of fluid contained in the representative volume element or unit cell, which has a combined solid and fluid volume $V$. The volume averaging gives rise to effective properties of the porous medium, such as the porosity $\epsilon$, which is defined as the ratio $V_{{f}}/V$, and the permeability $K$, which relates $\left \langle \boldsymbol {u}\right \rangle _{{s}}$ and $\boldsymbol {\nabla }\!\left \langle \,p \right \rangle _{{i}}$ by Darcy's law $\left \langle \boldsymbol {u}\right \rangle _{{s}}=K/\mu \,\boldsymbol {\nabla }\!\left \langle \,p \right \rangle _{{i}}$ (Darcy Reference Darcy1856).
Accurate models exist for the superficial velocity in linear flow (Johnson, Koplik & Dashen Reference Johnson, Koplik and Dashen1987; Chapman & Higdon Reference Chapman and Higdon1992; Pride, Morgan & Gangi Reference Pride, Morgan and Gangi1993), which allow the superficial velocity to be calculated in response to an arbitrary forcing. On the other hand, there is no comparably general model for the volume-averaged dissipation rate. Knowledge of the volume-averaged dissipation rate as a functional of the superficial velocity allows computation of the volume-averaged kinetic energy  $\left \langle k \right \rangle _{{s}}=\left \langle \frac {1}{2}\rho \boldsymbol {u}^2\right \rangle _{{s}}$ using the equation (Zhu et al. Reference Zhu, Waluga, Wohlmuth and Manhart2014)
 \begin{equation} \frac{\mathrm{d}\!\left\langle k\right\rangle_{{s}}}{\mathrm{d}t}=-\left\langle\boldsymbol{u}\right\rangle_{{s}}\boldsymbol{\cdot}\boldsymbol{\nabla}\!\left\langle \,p\right\rangle_{{i}} -2\mu\left\langle\boldsymbol{\mathsf{S}}:\boldsymbol{\mathsf{S}}\right\rangle_{{s}} , \end{equation}
where  $\rho$ is the density, $\mu$ is the dynamic viscosity and $\boldsymbol{\mathsf{S}}$ is the strain rate tensor. The volume-averaged kinetic energy and dissipation rate could be used to model scalar transport in unsteady flow. For instance, the small-time asymptotic descriptions of the dispersion coefficient and the temporal velocity autocorrelation function require knowledge of the volume-averaged kinetic energy and dissipation rate (Brosten Reference Brosten2013, (6.10) and (6.14)). Also, the continuous time random walk description of dispersion involves the volume-averaged kinetic energy of the Stokes flow (Cortis et al. Reference Cortis, Youjian, Scher and Berkowitz2004, (7) and (8)).
The volume-averaged dissipation rate in a steady linear flow has been given, for example, by Murthy & Singh (Reference Murthy and Singh1997) or Zhu et al. (Reference Zhu, Waluga, Wohlmuth and Manhart2014) as
 \begin{equation} 2\mu\left\langle\boldsymbol{\mathsf{S}}:\boldsymbol{\mathsf{S}}\right\rangle_{{s}} = \frac{\mu}{K}\left\langle\boldsymbol{u}\right\rangle_{{s}}^2 , \end{equation}
which was derived by equating the dissipation rate to the power input into the flow and then using Darcy's law. This expression was confirmed by Paéz-García, Valdés-Parada & Lasseux (Reference Paéz-García, Valdés-Parada and Lasseux2017), who applied an upscaling procedure to the mechanical energy equation. On the other hand, no comparable equation has been given for the volume-averaged dissipation rate in unsteady linear flow. A difficulty in modelling the dissipation rate arises from its nonlinear dependence on the velocity field. Thus, unlike the superficial velocity, the dissipation rate therefore cannot be obtained from a superposition of single-frequency modes (for which the dissipation rate has been computed, for example, by Johnson et al. (Reference Johnson, Koplik and Dashen1987)).
In this paper, we present a time domain model for the volume-averaged dissipation rate in linear unsteady flow. The model is derived by blending the steady-state dissipation rate (1.4) with the small-time limit of the dissipation rate obtained from boundary layer theory. The model is validated with an analytical solution of transient flow through a bundle of circular tubes and with direct numerical simulations (DNS) of flow through a periodic cylinder array and a periodic sphere pack.
2. Derivation of the model
2.1. Boundary layer theory
In this section, we derive a new asymptotic expression for the volume-averaged dissipation rate in linear flow that is valid in the small-time or high-frequency limits. Under these circumstances, the local acceleration term of the unsteady Stokes equation is dominant compared with the viscous term and the flow is laminar and has a boundary layer structure (Schlichting & Gersten Reference Schlichting and Gersten2017, pp. 349–350).
For the sake of this derivation, we assume that the flow is at rest at  $t=0$ and that the macroscopic pressure gradient is applied for $t\geq 0$. Then, for small times, the flow can be approximated as a potential core flow and a viscous boundary layer flow (Schlichting & Gersten Reference Schlichting and Gersten2017, pp. 352–353) and the velocity profile in the boundary layer is locally given by the solution to Stokes’ first problem (Schlichting & Gersten Reference Schlichting and Gersten2017, pp. 126–128)
 \begin{equation} \boldsymbol{u}(y,t) = \int_{0}^{t} \left.\frac{\partial \boldsymbol{U}}{\partial \tau}\right\vert_{y=0}\,\mathrm{erf}\!\left(\frac{y}{2\sqrt{\nu(t-\tau)}}\right)\mathrm{d}\tau . \end{equation}
Here,  $\nu =\mu /\rho$ is the kinematic viscosity and $y$ is the local wall-normal coordinate. The velocity of the potential core flow $\boldsymbol {U}(\boldsymbol {x},t)$ can be obtained from the theory of unsteady potential flow (Batchelor Reference Batchelor2000, pp. 394–409) for a given pore geometry. As will be discussed below, $\boldsymbol {U}(\boldsymbol {x},t)$ enters the volume-averaged dissipation rate only through the two integral quantities $\alpha _{\infty }$ and $\varLambda$ (2.6), which have been tabulated for simple geometries (Chapman & Higdon Reference Chapman and Higdon1992; Lee, Leamy & Nadler Reference Lee, Leamy and Nadler2009). The volume-averaged dissipation rate is equal to the sum of the dissipation in the boundary layer and the dissipation in the potential core flow (Johnson et al. Reference Johnson, Koplik and Dashen1987),
 \begin{equation} 2\mu\left\langle\boldsymbol{\mathsf{S}}:\boldsymbol{\mathsf{S}}\right\rangle_{{s}} = \underbrace{\frac{\mu}{V} \int_{A_{fs}} \int_{0}^{\infty} \left(\frac{\partial \boldsymbol{u}}{\partial y}\right)^2\mathrm{d}y\, \mathrm{d}A}_{\text{boundary layer}} + \underbrace{\frac{\mu}{V} \int_{A_{{fs}}} \boldsymbol{\nabla}\left\vert\boldsymbol{U}\right\vert^2\boldsymbol{\cdot} \boldsymbol{n}\,\mathrm{d}A}_{\text{potential flow}\, ({\approx} 0)}, \end{equation}
where  $A_{{fs}}$ denotes the fluid–solid interface. As observed by Johnson et al. (Reference Johnson, Koplik and Dashen1987), the boundary layer term increases with frequency whereas the potential flow term is independent of frequency and can be neglected. In the boundary layer contribution, we can identify the dissipation integral
 \begin{align} D = \int_{0}^{\infty} \left(\frac{\partial \boldsymbol{u}}{\partial y}\right)^2\mathrm{d}y = \int_{0}^{\infty} \left[\int_{0}^{t} \left.\frac{\partial \boldsymbol{U}}{\partial \tau}\right\vert_{y=0}\exp\!\left(-\frac{y^2}{4 \nu (t - \tau)}\right)\frac{1}{\sqrt{{\rm \pi} \nu (t - \tau)}}\,\mathrm{d}\tau\right]^2\mathrm{d}y . \end{align}
Here, we have departed from Johnson et al. (Reference Johnson, Koplik and Dashen1987) in pursuing a time-domain approach. Now, we change the order of spatial and temporal integration. With the integral
 \begin{equation} \int_{0}^{\infty} \exp\!\left(-\frac{y^2}{4 \nu (t - \tau_1)}\right) \exp\!\left(-\frac{y^2}{4 \nu (t - \tau_2)}\right) \mathrm{d}y = \sqrt{\frac{{\rm \pi} \nu (t-\tau_1) (t-\tau_2)}{(t-\tau_1)+(t-\tau_2)}}, \end{equation}
we can rewrite the dissipation integral as a double convolution,
 \begin{equation} D = \int_{0}^{t}\int_{0}^{t} \left.\frac{\partial \boldsymbol{U}}{\partial \tau_1}\right\vert_{y=0} \left.\frac{\partial \boldsymbol{U}}{\partial \tau_2}\right\vert_{y=0}\,\frac{1}{\sqrt{{\rm \pi} \nu \left[(t-\tau_1)+(t-\tau_2)\right]}}\,\mathrm{d}\tau_1\,\mathrm{d}\tau_2 . \end{equation}
The spatial integration has thus changed the square of a one-dimensional convolution integral into a two-dimensional convolution integral. For the potential flow, there is a time-independent proportionality between the potential flow velocity at the wall  $\boldsymbol {U}\vert _{y=0}$ and the superficial velocity $\left \langle \boldsymbol {U}\right \rangle _{{s}}$ of the potential flow. This relationship is expressed by the high-frequency limit of the dynamic tortuosity $\alpha _{\infty }$ and the characteristic viscous length $\varLambda$ derived by Johnson et al. (Reference Johnson, Koplik and Dashen1987):
 $$\begin{gather} \frac{\alpha_{\infty}}{\epsilon} = \frac{\left\langle\boldsymbol{U}^2\right\rangle_{{s}}}{\left\langle\boldsymbol{U}\right\rangle_{{s}}^2}, \end{gather}$$
 $$\begin{gather}\frac{2}{\varLambda} = \frac{\dfrac{1}{V}\displaystyle\int_{A_{{fs}}} \left\vert\boldsymbol{U}\right\vert^2\, \mathrm{d}A}{\left\langle\boldsymbol{U}^2\right\rangle_{{s}}}. \end{gather}$$
Using these expressions, the surface integral over the dissipation integral in (2.2) can be rewritten in terms of the superficial velocity of the potential flow. Furthermore, the superficial velocity of the potential flow can be approximated with the actual superficial velocity provided that the boundary layer is very thin. This gives the final expression for the volume-averaged dissipation rate in the small-time limit
 \begin{equation} 2\mu\left\langle\boldsymbol{\mathsf{S}}:\boldsymbol{\mathsf{S}}\right\rangle_{{s}} = \frac{2\mu \alpha_{\infty}}{\epsilon\varLambda}\int_{0}^{t}\int_{0}^{t}\frac{\mathrm{d} \!\left\langle\boldsymbol{u}\right\rangle_{{s}}}{\mathrm{d}\tau_1}\,{\cdot}\,\frac{\mathrm{d} \!\left\langle\boldsymbol{u}\right\rangle_{{s}}}{\mathrm{d}\tau_2}\, \frac{1}{\sqrt{{\rm \pi}\nu \left[\left(t-\tau_1 \right)+\left(t-\tau_2 \right)\right] }}\,\mathrm{d}\tau_1\,\mathrm{d}\tau_2 \,, \end{equation}
which is a key result of this study.
2.2. Blending of steady and boundary layer asymptotics
In this section, we use the expressions for the volume-averaged dissipation rate for small times (2.7) and for the steady state (1.4) to construct a model for the volume-averaged dissipation rate that is valid for linear flow.
We begin by rewriting the steady-state dissipation rate (1.4) as a second-order Volterra integral similar to (2.7):
 \begin{equation} 2\mu\left\langle\boldsymbol{\mathsf{S}}:\boldsymbol{\mathsf{S}}\right\rangle_{{s}} = \frac{\mu}{K}\left\langle\boldsymbol{u}\right\rangle_{{s}}^2 = \frac{\mu}{K}\int_{0}^{t}\int_{0}^{t}\frac{\mathrm{d} \!\left\langle\boldsymbol{u}\right\rangle_{{s}}}{\mathrm{d}\tau_1}\,{\cdot}\,\frac{\mathrm{d} \!\left\langle\boldsymbol{u}\right\rangle_{{s}}}{\mathrm{d}\tau_2}\,\mathrm{d}\tau_1\,\mathrm{d}\tau_2. \end{equation}
This leads us to consider a general model for the dissipation rate in the linear regime of the following form:
 \begin{equation} 2\mu\left\langle\boldsymbol{\mathsf{S}}:\boldsymbol{\mathsf{S}}\right\rangle_{{s}} = \int_{0}^{t}\int_{0}^{t}\frac{\mathrm{d} \!\left\langle\boldsymbol{u}\right\rangle_{{s}}}{\mathrm{d}\tau_1}\,{\cdot}\,\frac{\mathrm{d} \!\left\langle\boldsymbol{u}\right\rangle_{{s}}}{\mathrm{d}\tau_2}\, g(t-\tau_1, t-\tau_2)\,\mathrm{d}\tau_1\,\mathrm{d}\tau_2, \end{equation}
where the kernel function  $g(t_1,t_2)$ is assumed to be symmetric, $g(t_1,t_2)=g(t_2,t_1)$, and satisfies the limits
 $$\begin{gather} \lim_{t_1\to 0}\lim_{t_2\to 0} g(t_1, t_2) = \frac{2\mu\alpha_{\infty}}{\epsilon\varLambda} \frac{1}{\sqrt{{\rm \pi}\nu \left[t_1+t_2\right] }}, \end{gather}$$
 $$\begin{gather}\lim_{t_1\to \infty}\lim_{t_2\to \infty} g(t_1, t_2) = \frac{\mu}{K}. \end{gather}$$
The latter condition can be explained as follows: for a function that varies very slowly, only a small part of the history will be affected by the small-time limit of  $g(t_1,t_2)$, while most of the history will be weighted with ${\mu }/{K}$, thus approaching the steady-state limit.
Following Churchill & Usagi (Reference Churchill and Usagi1972), we consider the following family of models:
 \begin{equation} g_{n}(t_1,t_2) = \left[\left(\frac{\mu}{K}\right)^n+\left(\frac{2\mu \alpha_{\infty}}{\epsilon\varLambda}\frac{1}{\sqrt{{\rm \pi}\nu \left[t_1+t_2\right] }}\right)^{n}\right]^{1/n} , \end{equation}
where  $n$ is a real number. In this blending, the transition between the small- and large-time behaviour occurs when the limiting expressions (2.10) take the same value. The family parameter $n$ could be determined using additional information about the dissipation rate. Here, the parameter will be estimated empirically based on analytical solutions and numerical simulations. Figure 1 shows the kernel function (2.11) for different values of the parameter $n$. It can be seen that the width of the transition region between the asymptotes decreases with increasing values of $n$.
$n$.

Figure 1. Kernel function  $g_n(t_1,t_2)$ for different values of the blending parameter $n$ in logarithmic axes. The kernel function is universal in the chosen normalisation.
In the remainder of this paper, the proposed model is validated using analytical and numerical solutions to the (Navier–)Stokes equations for unsteady flow through porous media.
3. Analytical validation
In this section, we validate the model for the case of transient flow through a porous medium consisting of cylindrical tubes of radius  $R$ that are inclined by an angle $\theta$ with respect to the pressure gradient. Johnson et al. (Reference Johnson, Koplik and Dashen1987) reported the exact values for the permeability, the high-frequency limit of the dynamic tortuosity and the characteristic viscous length for this case,
 $$\begin{gather} K = \tfrac{1}{8} \,\epsilon\, R^2 \cos^2\theta , \end{gather}$$
 $$\begin{gather}\alpha_{\infty} = \frac{1}{\cos^2\theta}, \end{gather}$$
 $$\begin{gather}\varLambda = R . \end{gather}$$
In the following, we show that the volume-averaged dissipation rate obtained from the analytical solution agrees with the asymptotic limits (2.7) and (1.4) and we compare our proposed model (2.11) for the volume-averaged dissipation rate with the exact solution.
3.1. Exact solution for the dissipation rate
The analytical solution for the streamwise velocity in transient flow through a circular pipe is given as (Pozrikidis Reference Pozrikidis2017, pp. 509–514)
 \begin{equation} u_s(r,t) = \frac{1}{4\mu}\left\vert\boldsymbol{\nabla}\!\left\langle \,p\right\rangle_{{i}}\right\vert \cos\theta \left[R^2-r^2-8 R^2 \sum_{k=1}^{\infty} \frac{1}{\alpha_{k}^3} \frac{\mathrm{J}_0(\alpha_{k} r/R)}{\mathrm{J}_1(\alpha_{k})} \exp\left({-\alpha_{k}^2 \frac{\nu t}{R^2}}\right)\right], \end{equation}
where  $\mathrm {J}_{n}(z)$ are the Bessel functions of the first kind and $\alpha _{k}$ denotes the $k$th zero of the Bessel function $\mathrm {J}_{0}$. The velocity gradient can be calculated as
 \begin{equation} \frac{\partial u_s}{\partial r} = \frac{1}{4\mu}\left\vert\boldsymbol{\nabla}\! \left\langle \,p\right\rangle_{{i}}\right\vert \cos\theta \left[-2 r+8 R \sum_{k=1}^{\infty} \frac{1}{\alpha_{k}^2} \frac{\mathrm{J}_1(\alpha_{k} r/R)}{\mathrm{J}_1(\alpha_{k})} \exp\left({-\alpha_{k}^2 \frac{\nu t}{R^2}}\right)\right] . \end{equation}
We can then obtain the superficial volume-averaged dissipation rate by integration as
 \begin{align} &2\mu \left\langle\boldsymbol{\mathsf{S}}:\boldsymbol{\mathsf{S}}\right\rangle_{{s}}\nonumber\\ &\quad =\frac{\epsilon\mu}{{\rm \pi} R^2}\int_{0}^{R} \left(\frac{\partial u_s}{\partial r}\right)^2 2{\rm \pi} r\,\mathrm{d}r \nonumber\\ &\quad=\frac{1}{8\mu} \epsilon R^2\cos^2\theta \left\vert\boldsymbol{\nabla}\!\left\langle \,p\right\rangle_{{i}}\right\vert^2 \int_{0}^{1} \left[-2 x+8 \sum_{k=1}^{\infty} \frac{1}{\alpha_{k}^2} \frac{\mathrm{J}_1(\alpha_{k} x)}{\mathrm{J}_1(\alpha_{k})} \exp\left({-\alpha_{k}^2 \frac{\nu t}{R^2}}\right)\right]^2 x\,\mathrm{d}\kern0.7pt x \nonumber\\ &\quad=\frac{1}{8\mu} \epsilon R^2\cos^2\theta \left\vert\boldsymbol{\nabla}\!\left\langle \,p\right\rangle_{{i}}\right\vert^2 \left[\int_{0}^{1} 4 x^3 \,\mathrm{d}\kern0.7pt x \right. \nonumber\\ &\qquad \left.-\,32 \sum_{k=1}^{\infty} \frac{1}{\alpha_{k}^2\,\mathrm{J}_1(\alpha_{k})} \exp\left({-\alpha_{k}^2 \frac{\nu t}{R^2}}\right)\int_{0}^{1} x^2 \, \mathrm{J}_1(\alpha_{k} x)\,\mathrm{d}\kern0.7pt x \right. \nonumber\\ &\qquad \left. +\,64 \sum_{k=1}^{\infty} \sum_{l=1}^{\infty} \frac{1}{\alpha_{k}^2 \,\mathrm{J}_1(\alpha_{k})\,\alpha_{l}^2\,\mathrm{J}_1(\alpha_{l})} \exp\left({-(\alpha_{k}^2+\alpha_{l}^2) \frac{\nu t}{R^2}}\right) \int_{0}^{1} x \,\mathrm{J}_1(\alpha_{k} x) \,\mathrm{J}_1(\alpha_{l} x)\,\mathrm{d}\kern0.7pt x\right] \nonumber\\ &\quad=\frac{1}{8\mu} \epsilon R^2\cos^2\theta \left\vert\boldsymbol{\nabla}\!\left\langle \,p\right\rangle_{{i}}\right\vert^2 \left[1 -64 \sum_{k=1}^{\infty} \frac{1}{\alpha_{k}^4} \exp\left({-\alpha_{k}^2 \frac{\nu t}{R^2}}\right) +32 \sum_{k=1}^{\infty} \frac{1}{\alpha_{k}^4} \exp\left({-2\alpha_{k}^2 \frac{\nu t}{R^2}}\right)\right] \nonumber\\ &\quad=\frac{K}{\mu} \left\vert\boldsymbol{\nabla}\!\left\langle \,p\right\rangle_{{i}} \right\vert^2 \left[1 -64 \sum_{k=1}^{\infty} \frac{1}{\alpha_{k}^4} \exp\left({-\alpha_{k}^2 \frac{\nu t}{R^2}}\right) +32 \sum_{k=1}^{\infty} \frac{1}{\alpha_{k}^4} \exp\left({-2\alpha_{k}^2 \frac{\nu t}{R^2}}\right)\right] . \end{align}
At the starting time  $t=0$, the dissipation vanishes since the zeros of the Bessel function $\mathrm {J}_{0}$ satisfy
 \begin{equation} \sum_{k=1}^{\infty} \frac{1}{\alpha_{k}^4} = \frac{1}{32} . \end{equation}
At large times, the exponential terms tend to zero and we arrive at (1.4) using Darcy's law.
3.2. Small- and large-time asymptotics
In this section, we compare the small- and large-time asymptotics of the volume-averaged dissipation rate given by (2.7) and (1.4) with the exact dissipation rate. To evaluate these expressions, we need to determine the superficial velocity and the superficial acceleration. The superficial velocity can be obtained by averaging the velocity (3.2) over the cross-section and then projecting it onto the direction of the pressure gradient (which amounts to a multiplication with  $\cos \theta$). Using the permeability (3.1a) we get
 \begin{equation} \left\langle u\right\rangle_{{s}} = \frac{K}{\mu} \left\vert\boldsymbol{\nabla}\!\left\langle \,p\right\rangle_{{i}}\right\vert \left[1-32 \sum_{k=1}^{\infty} \frac{1}{\alpha_{k}^4} \exp\left({-\alpha_{k}^2 \frac{\nu t}{R^2}}\right) \right] . \end{equation}
By differentiation, the superficial acceleration follows as
 \begin{equation} \frac{\mathrm{d}\!\left\langle u\right\rangle_{{s}}}{\mathrm{d}t}=\frac{\epsilon}{\rho\alpha_{\infty}} \left\vert\boldsymbol{\nabla}\!\left\langle \,p\right\rangle_{{i}}\right\vert \left[4 \,\sum_{k=1}^{\infty} \frac{1}{\alpha_{k}^2} \exp\left({-\alpha_{k}^2 \frac{\nu t}{R^2}}\right) \right] . \end{equation}
We then evaluate the small-time asymptotics (2.7) using adaptive quadrature. Figure 2 shows the exact dissipation rate (3.4) and the small- and large-time asymptotics according to the equations (2.7) and (1.4). It can be seen that the dissipation rate is indeed well approximated by the boundary layer theory for small times and by the steady-state behaviour at large times. Note that if the superficial velocity (3.6) is substituted into the steady-state dissipation (1.4), the first two terms of the exact dissipation rate (3.4) are exactly recovered.

Figure 2. Comparison of the dissipation rate of the analytical solution (3.4) with the small- and large-time asymptotics (2.7) and (1.4) for a porous medium consisting of circular tubes. The dissipation is normalised with the steady-state value  $K/\mu \vert \boldsymbol {\nabla }\!\left \langle \,p \right \rangle _{{i}}\vert ^2$.
3.3. Evaluation of model predictions
Having demonstrated the correctness of the asymptotic limits, we can now evaluate the proposed model for the volume-averaged dissipation rate given by (2.9) and (2.11). Figure 3 shows the exact solution for the dissipation rate (3.4), the large-time asymptotics (1.4) and the modelled dissipation rate. For the blending parameter  $n$, we have chosen the values $n=2$ and $n=3$ for which the predictions lie closest to the exact solution. It can be seen that the model accurately predicts the dissipation rate and has the correct limiting behaviour. The maximum relative error with respect to the instantaneous dissipation rate is $7\,\%$ for $n=2$ and $14\,\%$ for $n=3$.

Figure 3. Comparison of the dissipation rate of the analytical solution (3.4), the large-time asymptotics (1.4) and the model given by (2.9), (2.11) for a porous medium consisting of circular tubes. The dissipation is normalised with the steady-state value  $K/\mu \vert \boldsymbol {\nabla }\!\left \langle \,p \right \rangle _{{i}}\vert ^2$.
4. Numerical validation
In this section, we further compare the volume-averaged dissipation rate modelled according to the equations (2.9) and (2.11) with the volume-averaged dissipation rate obtained from the DNS of flow through a cylinder array and a hexagonal sphere pack.
4.1. Description of the flow solver
The simulations were performed using our in-house code MGLET (Manhart, Tremblay & Friedrich Reference Manhart, Tremblay and Friedrich2001). The incompressible Navier–Stokes equations are discretised on a Cartesian grid with a second-order symmetry-preserving finite volume method (Verstappen & Veldman Reference Verstappen and Veldman2003). A third-order explicit Runge–Kutta method (Williamson Reference Williamson1980) is employed for time integration of the momentum equation and the continuity equation is enforced using the projection method (Chorin Reference Chorin1968), resulting in a Poisson equation at each stage.
The no-slip and no-penetration boundary conditions at the fluid–solid interface of the porous medium are imposed using a second-order accurate ghost-cell immersed boundary method (Peller et al. Reference Peller, Le Duc, Tremblay and Manhart2006; Peller Reference Peller2010). The conservation of mass in the interface cells is ensured by a flux correction procedure that is iteratively coupled to the global pressure correction. The immersed boundary method has been validated for the simulation of porous media flow in Peller (Reference Peller2010), Sakai & Manhart (Reference Sakai and Manhart2020) and Unglehrt & Manhart (Reference Unglehrt and Manhart2022).
4.2. Porous medium geometries
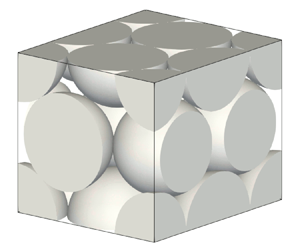
Following Zhu et al. (Reference Zhu, Waluga, Wohlmuth and Manhart2014), we consider flow through a periodic array of cylinders and through a hexagonal close-packed arrangement of spheres. The corresponding simulation domains are shown in figure 4. These porous media have a considerably different porosity ( $\epsilon =0.56$ and $0.26$, respectively) and pore space geometry.

Figure 4. Simulation domains for the cylinder array and for the hexagonal sphere pack. Periodic boundary conditions are applied on all sides of the domain.
The geometric parameters of these porous media are reported in table 1. The high-frequency limit of the dynamic tortuosity  $\alpha _{\infty }$ and the characteristic viscous length $\varLambda$ were determined from the potential flow using a finite element calculation (see Unglehrt & Manhart (Reference Unglehrt and Manhart2023) for the hexagonal sphere pack). The permeability values were obtained from the steady state of the simulations cyl-step and hcp-step (see table 2).
Table 1. Geometric parameters for the cylinder array and the hexagonal close-packed arrangement of equal spheres.

Table 2. Simulation parameters for flow through a cylinder array and a hexagonal sphere pack.
 $^{a}$From Sakai & Manhart (Reference Sakai and Manhart2020), recomputed at a higher resolution in Unglehrt & Manhart (Reference Unglehrt and Manhart2023). $^{b}$From Unglehrt & Manhart (Reference Unglehrt and Manhart2022).
4.3. Simulation set-up
The pore scale flow is described by the incompressible Navier–Stokes equations. However, a small Reynolds number is chosen such that the nonlinear terms are insignificant. No-slip and no-penetration boundary conditions are imposed at the cylinder or spheres and triple periodic boundary conditions are applied at the domain boundaries.
We consider flow started from rest in response to a constant pressure gradient
 \begin{equation} \boldsymbol{\nabla}\!\left\langle \,p\right\rangle_{{i}}\!(t)=-g_x\,\boldsymbol{e}_x\quad \text{for } t>0 \end{equation}
and in response to a sinusoidal pressure gradient
 \begin{equation} \boldsymbol{\nabla}\!\left\langle \,p\right\rangle_{{i}}\!(t)=-g_x\,\sin(\varOmega t)\,\boldsymbol{e}_x\quad \text{for } t>0 \end{equation}
that are applied as a body force on the fluid. In the latter case, we have chosen three values of the frequency:  $\varOmega /\varOmega _0=0.1$ (low frequency), $\varOmega /\varOmega _0=1$ (medium frequency) and $\varOmega /\varOmega _0=10$ (high frequency) where $\varOmega _0=\epsilon \,\nu /(\alpha _{\infty }\,K)$ is the transition frequency between the low and the high frequency regime (Pride et al. Reference Pride, Morgan and Gangi1993). Note that the high-frequency cases represent behaviour that could be found, for example, in wave-induced flow in a coral reef ( $d\sim {2}\ {\rm cm}$, period ${\sim }{4}\ {\rm s}$, wind velocity ${\sim }{5}\ {\rm m}\ {\rm s}^{-1}$, wave height ${\sim }{0.6}\ {\rm m}$, water depth ${\sim }{30}\ {\rm m}$), while the low- and medium-frequency cases would correspond to flow within a sandy seabed.
The flow cases for the cylinder array were simulated at a grid resolution of  $480$ cells per diameter following Zhu & Manhart (Reference Zhu and Manhart2016). The flow cases for the hexagonal sphere pack were simulated at a resolution of $384$ cells per diameter for the oscillatory flow and at a resolution of $320$ cells per diameter for the transient flow. They were validated by a grid study in Unglehrt & Manhart (Reference Unglehrt and Manhart2022) and Sakai & Manhart (Reference Sakai and Manhart2020). The important parameters of the simulations are summarised in table 2.
The time series of the volume-averaged dissipation rate was obtained indirectly from the time series of the superficial velocity and the volume-averaged kinetic energy using the kinetic energy equation (1.3),
 \begin{equation} 2\mu\left\langle\boldsymbol{\mathsf{S}}:\boldsymbol{\mathsf{S}}\right\rangle_{{s}}=-\left\langle\boldsymbol{u}\right\rangle_{{s}}\boldsymbol{\cdot} \boldsymbol{\nabla}\!\left\langle \,p\right\rangle_{{i}} -\frac{\mathrm{d}\!\left\langle k\right\rangle_{{s}}}{\mathrm{d}t} . \end{equation}
The superficial velocity and the volume-averaged kinetic energy were extracted from the simulation with a high temporal resolution.
4.4. Results
We first consider the case of transient flow started from rest and driven by a constant pressure gradient. Figure 5 shows the volume-averaged dissipation rate from the DNS cyl-step and hcp-step, the large-time asymptotics (1.4) and the model evaluated for the values  $n=2$ and $n=3$ of the blending parameter. It can be seen that the model correctly captures the small-time behaviour of the simulations whereas the dissipation rate clearly cannot be approximated by (1.4) at small times. After the first few time steps, in which the simulations are not fully accurate due to the extremely thin boundary layers, the model errors relative to the simulation lie between $-18\,\%$ and $4\,\%$ for the cylinder array and between $-12\,\%$ and $8\,\%$ for the hexagonal sphere pack. For the cylinder array, the blending parameter $n=2$ gives better results, while for the hexagonal sphere pack the blending parameter $n=3$ gives better results.

Figure 5. Comparison of the dissipation rate from the DNS, the large-time asymptotics (1.4) and the model given by (2.9), (2.11) for transient flow in response to a constant pressure gradient through the cylinder array (a) and the hexagonal sphere pack (b). The dissipation is normalised with the steady-state value  $K/\mu \vert \boldsymbol {\nabla }\!\left \langle \,p \right \rangle _{{i}}\vert ^2$.
We then consider the case of transient flow started from rest that is driven by a sinusoidal pressure gradient. The low frequency cases (simulations cyl-LF and hcp-LF) are shown in figure 6. There are almost no differences between the dissipation rate of the DNS, the large-time asymptotics and the model. For the cylinder, all curves agree with the dissipation rate of the simulations. For the hexagonal sphere pack, the dissipation is slightly overestimated by the model for  $n=2$, while it is slightly underestimated by the model for $n=3$ as well as by the large-time asymptotics.

Figure 6. Comparison of the dissipation rate from the DNS, the large-time asymptotics (1.4) and the model given by (2.9), (2.11) for transient flow in response to a sinusoidal pressure gradient with  $\varOmega /\varOmega _0 \approx 0.1$ through the cylinder array (a) and the hexagonal sphere pack (b). The dissipation is normalised with the steady-state value $K/\mu \vert \boldsymbol {\nabla }\!\left \langle \,p \right \rangle _{{i}}\vert ^2$.
The medium frequency cases (simulations cyl-MF and hcp-MF) are shown in figure 7. For the cylinder, again the large-time asymptotics agree very well with the dissipation rate of the DNS, while the model slightly overestimates the dissipation rate for both  $n=2$ and $n=3$. For the hexagonal sphere pack, the model overestimates the dissipation rate for $n=2$, while it is in close agreement with the simulation for $n=3$. The large-time asymptotics slightly underestimate the dissipation rate.

Figure 7. Comparison of the dissipation rate from the DNS, the large-time asymptotics (1.4) and the model given by (2.9), (2.11) for transient flow in response to a sinusoidal pressure gradient with  $\varOmega /\varOmega _0 \approx 1$ through the cylinder array (a) and the hexagonal sphere pack (b). The dissipation is normalised with the steady-state value $K/\mu \vert \boldsymbol {\nabla }\!\left \langle \,p \right \rangle _{{i}}\vert ^2$.
The high frequency cases (simulations cyl-HF and hcp-HF) are shown in figure 8. It can be seen that the large-time asymptotics (1.4) clearly underestimate the dissipation from the simulations by approximately  $30\,\%$ and $55\,\%$ for the cylinder array and the hexagonal sphere pack, respectively, while the model (2.9), (2.11) provides significantly better predictions. In particular, the model reproduces the evolution of the dissipation rate during the transient oscillation. For the cylinder array, a very good agreement can be observed for the value $n=2$ of the blending parameter with a relative difference of approximately $3\,\%$; for the sphere pack, an excellent agreement between the dissipation rate from the simulation and the modelled dissipation rate is found for $n=3$ with a relative difference of approximately $1.5\,\%$. Note that the agreement could be improved by choosing non-integer values of $n$. However, based on the results above, we expect that the optimal value for $n$ will still depend on the geometry.

Figure 8. Comparison of the dissipation rate from the DNS, the large-time asymptotics (1.4) and the model given by (2.9), (2.11) for transient flow in response to a sinusoidal pressure gradient with  $\varOmega /\varOmega _0 \approx 10$ through the cylinder array (a) and the hexagonal sphere pack (b). The dissipation is normalised with the steady-state value $K/\mu \vert \boldsymbol {\nabla }\!\left \langle \,p \right \rangle _{{i}}\vert ^2$.
5. Conclusion
We have proposed a model for the volume-averaged dissipation rate in linear unsteady flow through a porous medium. The model is derived by blending the steady-state expression for the volume-averaged dissipation rate (Murthy & Singh Reference Murthy and Singh1997; Zhu et al. Reference Zhu, Waluga, Wohlmuth and Manhart2014) with a small-time asymptotic expression obtained from boundary layer theory for a flow started at rest. The model was first validated against an analytical solution of the Navier–Stokes equations for transient flow through a porous medium consisting of circular tubes. The model was then compared with a DNS dataset comprising transient and oscillatory flow through a cylinder array and through a hexagonal close-packed arrangement of spheres. The model showed significantly better predictions at small times or high frequencies than the large-time asymptotics given by the steady-state expression, while maintaining the accuracy of the large-time asymptotics at large times or low frequencies. In all cases, values of the blending parameter  $n$ between $2$ and $3$ gave good results.
Future work could attempt to generalise the model to nonlinear unsteady flow. For this, it might be promising to represent the volume-averaged dissipation rate as a Volterra series in the superficial acceleration. Furthermore, the proposed model could provide a basis for modelling dispersion and mixing in linear unsteady flow through porous media. For instance, Brosten et al. (Reference Brosten, Vogt, Seymour, Codd and Maier2012) considered the short-time dispersion coefficient defined as  $D(t) = E[|\boldsymbol {R}(t)-E[\boldsymbol {R}(t)]|^2]/(6 t)$, wherein $E[.]$ is the ensemble average and $\boldsymbol {R}(t)$ is the fluid particle displacement, and derived the following asymptotic expression for small times:
 \begin{equation} D(t) = D_o(t) + \left\langle(\boldsymbol{u}-\left\langle\boldsymbol{u}\right\rangle_{{i}})^2\right\rangle_{{i}} t + \frac{\kappa}{18}\left[\frac{\epsilon}{K}\left\langle\boldsymbol{u}\right\rangle_{{i}}^2\right] t^{3/2} + {O}(t^{5/2}). \end{equation}
Here,  $D_o(t)$ is the short-time dispersion coefficient without convection and $\kappa$ is the molecular diffusion constant. The spatial velocity variance in the second term on the right-hand side is closely related to the kinetic energy and the term in brackets can be identified as the steady-state expression (1.4) in intrinsic volume-averaged form. Therefore, within a frozen field assumption, our model allows the evaluation of these terms for unsteady linear flow.
Funding
The authors gratefully acknowledge the financial support of the Deutsche Forschungsgemeinschaft (DFG, German Research Foundation) under grant no. MA2062/13-1. Computing time was granted by the Leibniz Supercomputing Centre on its Linux-Cluster.
Declaration of interests
The authors report no conflict of interest.
Author contributions
L.U. derived the model, performed the simulations and wrote the manuscript. M.M. provided scientific supervision and contributed to writing the manuscript.


 Open access