


Introduction
As the dominant factor responsible for sea-level rise, global glacier shrinkage in recent decades has attracted the attention of glaciologists worldwide (Reference Ren, Ye, Ding and LiuRen and others, 2011; Reference GardnerGardner and others, 2013). The Tibetan Plateau (TP), described as the ‘Third Pole’ and Asia’s ‘water tower’, develops the largest cryosphere outside the polar region and has experienced accelerating warming during recent decades (Reference XiaoXiao and others, 2007; Reference Kang, Xu, You, Flügel, Pepin and YaoKang and others, 2010). Many investigations of glaciers reveal that retreat was common but differed in the various regions/basins (Reference XiaoXiao and others, 2007; Reference Ren, Ye, Ding and LiuRen and others, 2011). Moreover, monitored glaciers in the TP have experienced accelerating reduction during the past two decades (Reference CogleyCogley, 2011; Reference BolchBolch and others, 2012; Reference YaoYao and others, 2012), which might trigger level increases for closed lakes and dramatically impact on the livelihoods and activities of people in downstream regions by having an active influence on water resources and geohazards (Reference Shi, Liu, Ye, Liu and WangShi and others, 2008; Reference Immerzeel, Van Beeke and BierkensImmerzeel and others, 2010; Reference Zhang, Xie, Kang, Yi and AckleyZhang and others, 2011; Reference LeiLei and others, 2012; Reference YaoYao and others, 2012). However, glaciers in the western TP have demonstrated a mass gain in the past decade (Reference Gardelle, Berthier and ArnaudGardelle and others, 2012; Reference Jacob, Wahr, Pfeffer and SwensonJacob and others, 2012; Reference Kääb, Berthier, Nuth, Gardelle and ArnaudKääb and others, 2012; Reference Wang, Zhou, Siegert, Zhang and ChenWang and others, 2012; Reference YaoYao and others, 2012; Reference GardnerGardner and others, 2013) that poses a need for continuous glacier monitoring on a large spatial scale.
The Tibetan Plateau interior area (TPIA), in the north-central TP, is encircled by the Kunlun mountains to the north, the Karakoram mountains to the west and the Nyainqentanglha range to the southeast. The inaccessibility of the region due to its remoteness and high altitude have led to its being less investigated and short of in situ measurements on glaciers. The remote-sensing technique provides an alternative and valid means of access to generate information on glacier dynamics in the region. In this study, Landsat Thematic Mapper (TM)/Enhanced TM Plus (ETM+) scenes and Chinese topographic maps (CTMs) were utilized to show the recent changes of glaciers in the TPIA, and their impact is analyzed at the end of the paper.
Study Area
The TPIA, often termed the Qangtang Plateau, is located between the west-central part of the Kunlun mountains to the north and the Gangdise range to the south, and covers parts of the Karakoram mountains, the Tanghla and Nyainqentanglha ranges (Fig. 1). In this region, various closed drainage basins are developed with the distribution of many dome-like mountains higher than 6000 ma.s.l. These mountains provide favourable conditions for the development of ice caps (e.g. Caixiong Kangri and Zangser Kangri). China’s largest ice field, Purog Kangri glacier, and largest ice cap, Chongce glacier, both occur in this region. Glaciers in the TPIA are all of the extreme continental/ subpolar type, with ice frozen to the bedrock (Reference Shi, Liu, Ye, Liu and WangShi and others, 2008), and meltwater from these glaciers feeds hundreds of lakes of various sizes (Reference Zhang, Xie, Kang, Yi and AckleyZhang and others, 2011). The climate in the TPIA, though dominated by the Indian monsoon in summer and the westerly in other seasons, is cold and dry (Reference YaoYao and others, 2012; Reference Joswiak, Yao, Wu, Tian and XuJoswiak and others, 2013). The annual mean air temperature in most parts of the region is <0°C, with the mean warmest month (July) near-surface temperature <14°C, and varies with the altitude of the terrain. The northern part containing the west Kunlun mountains and Karakoram mountains has the lowest annual mean air temperature (–2.13°C), and the eastern part containing the Tanghla range has the highest (0.17°C). The annual precipitation is 50–400 mm, and has increased most in winter, with a stronger increase in the north than in the south of the TPIA, and the strongest increase in the west Kunlun mountains (Reference Zhao, Ping, Yang, Cheng, Ying and LiuZhao and others, 2004; Reference Wang, Zhang, Zhao, Shen, Shi and YuWang and others, 2008). Following the coding system of river basins applied in the World Glacier Inventory (http://nsidc.org/data/docs/noaa/g01130_glacier_inventory/), the study area is subdivided into six second-level sub-basins: Ayakkum lake and Hoh Xil lake basin (5Z1), Siling Co basin (5Z2), Zhari Namco basin (5Z3), Bangong Co basin (5Z4), Dogai Coying basin (5Z5) and Yibug Cako basin (5Z6), and further into 18 third-level sub-basins (Fig. 1). In addition, we divide the TPIA into seven sub-regions according to their local climate settings: the Gangdise range (GR), Karakoram mountains (KaM), Kunlun mountains (KM), Nyainqentanglha range (NR), Qangtang Plateau (QP), Tanghla range (TR) and Himalaya (HI) (Fig. 1).
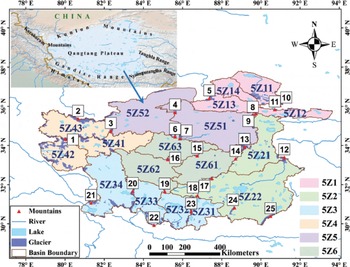
Fig. 1. Sketch of the study area. The mountains are (1) Caixiong Kangri; (2) Kunlun peak; (3) Tuze Kangri; (4) Songzhiling; (5) Muz Tag peak; (6) Burog Kangri; (7) Zangser Kangri; (8) Kangzhag Ri; (9) Jinyang Kangri; (10) Buka Daban peak; (11) Malan ice cap; (12) Geladaindong peak; (13) Puruog Kangri; (14) Xiyaergang; (15) Mayi Kangri; (16) Duguer; (17) Mugagebo; (18) Qingpagonglong; (19) Xiakangjian; (20) Longger; (21) Kangrinboqe peak; (22) Loinbo Kangri; (23) Bobogawu; (24) Shenzhajiegang; (25) Nyainqentanglha peak.
Glacier Mapping Using Satellite Data
The present glacier outlines were generated from Landsat scenes acquired by TM/ETM+ (Table 1). These multispectral and multitemporal scenes, with spatial resolution of 30 m, are available from the US Geological Survey (USGS, https://lpdaac.usgs.gov/get_data/). All Landsat scenes were orthorectified with the Shuttle Radar Topography Mission (SRTM) and ground control points from the Global Land Survey 2005 (GLS2005) dataset (USGS, 2011). The accuracy of these Landsat scenes is controlled by their horizontal shift of less than one pixel to each other or non-differential GPS data (Reference Bolch, Menounos and WheateBolch and others, 2010a; Reference Guo, Liu, Wei and BaoGuo and others, 2013). Glaciers were then segmented by a ratio threshold method which is a division of the visible or near-infrared band and shortwave infrared band (Reference PaulPaul, 2002). Ice patches larger than 0.01 km2 were mapped. This method is not good at discriminating seasonal snowpatches, clouds and ice surface with debris cover from bare ice of glaciers, so manual improvement was applied where necessary, by referencing image scenes without snow or cloud-free image scenes that were acquired at nearly the same time (Fig. 2). Only four glaciers with debris cover on the terminus area are found in the study area, and their boundaries were delineated manually.
Table 1. Major datasets used in this study
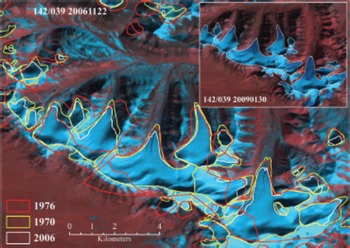
Fig. 2. Glacier outline mapping. The yellow and white outlines are the results of this study, extracted from CTMs and Landsat separately; the red outline is from the Randolph Glacier Inventory v3.2 (Reference ArendtArendt and others, 2012). The backgrounds are Landsat images.
The final contiguous ice coverage was divided into individual glacier polygons using topographical ridgelines (TRLs), which were automatically generated based on SRTM version 4 (available from http://srtm.csi.cgiar.org/ (Reference Guo, Liu, Yu and XuGuo and others, 2011). We assume that these SRTM-based TRLs did not change with time within the period considered in the study. TRLs were not well generated, and were later manually revised, over large flat-topped glaciers due to the coarse resolution of SRTM on the glaciers. SRTM was also utilized to extract geometrical parameters of a glacier-like maximum, minimum, median elevations, aspects and slopes, etc., as well as hypsometry, using a method suggested by Reference PaulPaul and others (2009) and Reference Frey and PaulFrey and Paul (2012). Parameters derived in this way for glaciers in 2009 may be slightly biased from the actual values due to surface movements and changes in ice thickness and extent.
Creating Outlines of Glaciers in the 1970s
Glaciers in the TPIA in the 1970s were inventoried (the first Chinese Glacier Inventory, termed first CGI) based on CTMs with scales of 1 : 50 000 and 1 :100 000. Various glacier parameters were manually measured on paper maps; for example, glacier area was measured using a planimeter (Reference Jiao and ZhangJiao and Zhang, 1988a, Reference Jiao and Zhangb, Reference Jiao and Zhangc; Reference Yang and AnYang and others, 1988; Reference Zhang and JiaoZhang and Jiao, 1988; Reference Shi, Liu and KangShi and others, 2009). The above-mentioned dataset cannot be directly applied to derive glacier changes compared with glacier outlines derived from satellite images as described earlier (Reference Frauenfelder and KääbFrauenfelder and Kääb, 2009; Reference Bolch, Menounos and WheateBolch and others, 2010a). The outlines of the first CGI were then digitized manually based on scanned and well-georeferenced CTMs at scales of 1:50000 and 1:100000, and validated with reference to the original aerial photographs on which the CTMs were based (Fig. 2). The spatial resolution of scanned CTMs is 4 m for maps at a scale of 1:50000 and 9 m for those at 1 : 100 000. They were first georeferenced following the original map coordinate of the 1954 Beijing Geodetic Coordinate System (BJ54) geoid (datum level is Yellow Sea mean sea level at Qingdao Tidal Observatory in 1956) and then reprojected into World Geodetic System 1984 (WGS84)/Earth Gravity Model 1996 (EGM96) utilizing 77 national trigonometric reference points of China over the TPIA. The same method for dividing individual glaciers and the geometric parameters of the satellite-image-based inventory is applied for the digitized first CGI from SRTM. For a retreating glacier, terminus elevation in the 1970s read from SRTM may be slightly lower than values derived based on the digital elevation models (DEMs) from the equivalent period, due to the melting of ice mass in the DEM grids at the terminus area before 2000, while that for glaciers in 2009 from SRTM may be slightly higher than the real terminus elevation because of thinning at the terminus area since 2000. Therefore terminus elevations, in both the 1970s and 2009, of a glacier read from SRTM may have implications for the thickness change, at least before 2000.
Error Analysis
The uncertainty of glacier outlines arises from positional and processing errors associated with glacier delineation (Reference Racoviteanu, Arnaud, Williams and OrdoñezRacoviteanu and others, 2008; Reference Bolch, Menounos and WheateBolch and others, 2010a). No distinct horizontal shift was observed in Landsat TM/ETM+ scenes (Reference Bolch, Menounos and WheateBolch and others, 2010a; Reference Guo, Liu, Wei and BaoGuo and others, 2013). After eliminating the impact of seasonal snow, cloud and debris cover manually, an accuracy of less than half a pixel was achieved. Consequently, the error of glacier area generated from Landsat scenes, E L, can be defined as (Reference BolchBolch and others, 2010b; Reference Guo, Liu, Wei and BaoGuo and others, 2013)
where n is the total count of pixels along the outline of ice coverage except for pixels along TRLs, and λL is the resolution of Landsat scenes. The nominal accuracies of CTMs at scales of 1 :50 000 and 1 :100 000 are 0.5 and 0.75 mm on slopes of <6° and >6° (GB/T 12343.1-2008; SAC, 2008). When the digital CTMs (DCTMs) are co-registered to the Landsat scenes, the errors are 12.8 m for DCTMs at scales of 1 :50 000 and 19.4 m for 1 :100 000. Uncertainty related to the digitization of glacier outlines from the DCTMs may be within three pixels, meaning that the errors (λT) for glacier outlines may be 12 and 27m for DCTMs at scales of 1 :50 000 and 1 :100 000 respectively. Accordingly the error of glacier area, E T, measured from DCTMs is the integration of uncertainty along the perimeter of a glacier polygon from DCTMs at various scales (Reference Ye, Ding, Liu and LiuYe and others, 2003; Reference Shangguan, Liu, Ding, Ding, Xu and LiShangguan and others, 2009) and can be calculated by
where λT is the interpretation resolution of the DCTM, and λM is the co-registration error. The error for changes in a glacier area EC can be obtained by
Our results indicate that the uncertainty for glacier area from DCTMs in the 1970s is of the order of 4.5%, while it is 3.2% for Landsat images in 2009. The low uncertainty (<5%) of both inventories indicates that they are of sufficient quality to be applied to the detection of glacier area changes in this region (Reference PaulPaul, 2002; Reference Bolch, Menounos and WheateBolch and others, 2010a). The errors of glacier area and their areal change in a basin were therefore evaluated (Table 2). The results shows that higher error occurs in basins with smaller glacier area since the method for uncertainty assessment is pixel-based along the glacier outlines.
Table 2. Glacier state and changes in drainage basins during 1970s–2009
Glacier Distribution
According to the present study (Table 2; Fig. 3), there are 6416 glaciers in the whole TPIA in 2009, with a total area of 7269.7 km2, whereas there were 5947 glaciers, with a total area of 8036.4 km2, in the 1970s. The digitized first CGI differs slightly from the published first CGI dataset, in that 606 glaciers and 200.3 km2 glacier area are added, which by mistake were not inventoried or measured at that time. There are also differences in other geometrical parameters because of the difference in measurement techniques and DEMs used. Here we demonstrate the general distribution characteristics of glaciers based on the 2009 inventory of glaciers in the TPIA. As the results show, large glaciers dominate the total glacier area in the region: for example, 22 glaciers each >32km2 in area contribute about one-fifth of the total glacier area in the TPIA, while the smallest glaciers (<0.5km2) comprise 70% of the total number but only 9.4% of the total area (Fig. 6a, further below). Almost 15.7% of the glacier area is centralized in the altitude range 5900-6000 m (Fig. 4). The surface slopes of most glaciers are 22–30° on average, while glaciers with slopes of 12-17° cover 58.6% of the total area (Fig. 5a, left panel). In general, large glaciers have gentle surface slopes (Fig. 5a, right panel) and tend to be south- and southeast-facing, but most glaciers have a north or northeast aspect (Fig. 5b).
Fig. 3. Glacier state and changes in sub-regions during 1970s–2009.
Fig. 4. Hypsography of glaciers in drainage basins and sub-regions. The three black lines in each panel depict values of H max (up), H med (middle) and H min (down), respectively.
Fig. 5. Characteristics of glacier slope and aspect. (a) Mean slope of glacier number/area (left panel); each bar represents a slope interval of 1° and area <10km2 (right panel). (b) Mean aspect of glacier number (left panel) and area (right panel); each sector represents an aspect interval of 45°.
Glaciers are unevenly distributed in different parts of the study area (Table 2; Fig. 3). 5Z4 in the northwest of the TPIA is one of the most glacierized basins, with ice coverage of 2899.76 km2 (39.9% of the total TPIA). In this sub-basin the ice coverage rate reaches 2.9%. 5Z6 in the interior is the least glacierized basin, with a glacier area contribution of 7.0% and an ice coverage rate of 0.4%. More than one-third of glacier area occurs in the Kunlun mountains, while only 0.8% is situated in the Himalaya. The largest mean glacier sizes occur in 5Z5 in the north-central part of the study area and the Tanghla range in the east, while the smallest sizes occur in 5Z3 and the Gangdise range in the southwest. 5Z1 and 5Z2, located in the northeast and southeast respectively, have similar glacier distributions in terms of mean glacier sizes and contributions to total area.
Glaciers exhibit spatial characteristics regarding the distribution of average maximum (H max), median (H med) and minimum (H min) elevations in individual basins and different mountain regions (Fig. 4). Glaciers in the TPIA range from 5722 to 6021 m a.s.l., with an H med of 5881 m a.s.l. Glaciers in 5Z1 (Kunlun mountains) have the lowest H max, H med and H min, while the highest values are in 5Z3 (Gangdise range). This pattern may be related to the longitudinal gradients of climate considering the average elevations of the Kunlun and Gangdise mountains. It is important to note that the values of H med and H min exceed 5800 and 5600 m respectively, in all basins except 5Z1. The altitude range of glacier occurrence varies from 274 m in 5Z4 up to 422 m in 5Z5, whereas the greatest is situated in the Tanghla range and varies from 289m down to 230m in the Gangdise range. The elevation difference between the highest altitude and the snowline altitude (SLA) (here we refer to H med as SLA) of a glacier (i.e. H max–H med) is defined as the positive difference of glaciation (PDG, a similar indicator to accumulation–area ratio (AAR)), which may demonstrate the capacity of accumulation on a glacier and the potential for glacier development in a mountainous region (Reference WangWang, 1992). As indicated by Reference WangWang (1992), an exponential relationship exists between the glacier coverage in a basin or on a mountain and their average PDG: a larger PDG always corresponds to high glaciation (greater coverage). The PDG is only 140 m on average for the whole TPIA, so the region does not show favourable conditions for glacier development compared with other mountain regions.
Glacier Changes
Comparing earlier and recent glacier extents, we found that glaciers in the TPIA were generally in retreat, while <1.5% of glaciers advanced. In the period 1970s–2009, the total glacier area decreased by 766.65 km2, or 9.5% of the total glacier area in the 1970s (0.27% a–1). Figure 6 shows the changes in number and area of glaciers of various size classes. Glaciers in different regions retreated at different speeds (Table 2; Fig. 3). The most drastic shrinkage occurred in 5Z3, which has lost over one-fifth of its ice coverage, at a rate of 0.72% a–1. Glaciers in 5Z2 have experienced a moderate recession in area by 15.5% (0.46% a–1), and those in 5Z1 and 5Z4–6 had an area reduction of <10% at rates of 0.12–0.17% a–1. As for glacier shrinkage in the different mountain ranges, a large area reduction by >20% is found in Gangdise, Nyainqentanglha and the western Himalaya, with a rate of loss of >0.66% a–1. Glaciers in Qangtang Plateau and the Tanghla range experienced only about half of that rate (0.28% a–1), while the Karakoram and west Kunlun mountains have seen the least area shrinkage, by 0.14% a–1 and 0.10% a–1 respectively.
Fig. 6. Glacier characteristics according to area-size classes. (a) Glacier numbers and areas in 1970s and 2009; (b) relative area changes for glaciers with area <10km2.
Glacier numbers have also changed, as a result of either the disappearance of very small glaciers or the disintegration of large glaciers. The total number of glaciers <0.5 km2 in area has increased by 13.8% since the 1970s. This is linked to a decrease in the number of glaciers 0.5–2.0 km2 in area, by 4.9% of their total in the 1970s. The number of disappeared glaciers accounts for only 0.7% of the total number in the 1970s. A total of 607 glaciers, covering an area of 82.28 km2, have disappeared, nearly 97% of which were in the smallest size class. The highest incidence of disappearance occurred in 5Z3 (18.4% of the glacier number, covering 3.6% of the total glacier area in the basin) and the Gangdise range (20.4% and 5.0% respectively). Only 3.8% of glaciers in the Kunlun mountains disappeared, covering 0 . 1% of the glacierized area in this region. There are 13 glaciers with nearly unchanged area, all <0.7 km2, three of which are located in the Kunlun mountains and the others in the Karakoram mountains. We also found 92 glaciers that increased in size in the period 1970s–2009, of which 57 were situated in the Karakoram mountains and none in the Himalaya. The extreme advancing glacier is located in the Kunlun mountains, with a total area increase of 2.40 km2 (Fig. 7).
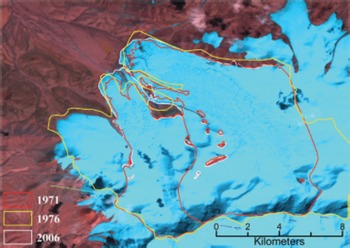
Fig. 7. Advancing glaciers occurring in Kunlun mountains. The yellow and white outlines are the results of this study, extracted from CTMs and Landsat separately; the red outline is from the Randolph Glacier Inventory v3.2 (Reference ArendtArendt and others, 2012).
Glacier retreat is also demonstrated by an uplift in glacier terminus elevations. The average H min for the whole TPIA has risen by 33 m. The rise is more pronounced in 5Z1–3 and 5Z6 (50–60m on average) than in 5Z5 (<10 m) (Table 3). The sharpest rise was found for glaciers in the Nyainqentanglha range, while the rise in the Kunlun mountains was relatively small. Uncertainties exist for terminus elevations determined by the same SRTM DEM; for example, the estimated rise in terminus elevation may be less than the actual rise, but the change in PDG may also be an indicative signature of glacier retreat in the region. An increase in H med or decrease in PDG has been identified for glaciers in all basins and various mountains in the region; the average decrease in PDG is 2 4m for the whole study area, with the largest decrease, of 42 m, in 5Z1.
Table 3. Changes in H min of drainage basins and sub-regions
Discussion
The climate on the TPIA is characterized by the Indian monsoon in summer and the westerly in winter (Reference YaoYao and others, 2012; Reference Joswiak, Yao, Wu, Tian and XuJoswiak and others, 2013). The accumulation on glaciers in the southern TPIA is supplied by continental summer precipitation, while glaciers in the north experience a winter accumulation period (Reference Bolch, Menounos and WheateBolch and others, 2010a). Previous studies indicate that annual mean air temperature and annual precipitation have increased over the TPIA, though with regional and seasonal differences (Reference Yao, Jiao, Tian, Yang and ShiYao and others, 1995; Reference Wu, Yin, Zheng and YangWu and others, 2007). The warming is more obvious in the northern TPIA than in the south, and significant warming occurred in the cold season, with obvious winter warming in the southern TPIA. In the period 1955–2004 the annual mean air temperature varies from east (–2.13°C) to center (–0.6°C) to west (0.17°C), but the annual mean air temperatures have increased by a similar amplitude (1.4°C). The strongest increase in annual precipitation has taken place in the northwestern TPIA, and annual precipitation has increased more in the north than in the south, while the precipitation increase was lowest in winter (Reference Zhao, Ping, Yang, Cheng, Ying and LiuZhao and others, 2004; Reference ShangguanShangguan and others, 2007; Reference Wang, Zhang, Zhao, Shen, Shi and YuWang and others, 2008).
Glacier distribution and changes during the last - 4 0 years are characterized by clear regional differences CTa (Table 2; Fig. 3). This may be related to the different topography and climatic settings of the various areas, as well as climate change. The northwestern and southwestern TPIA (e.g. Karakoram, western Kunlun and Gangdise) are relatively humid and thus highly glacierized. Large glaciers and glaciers with large PDG are found in the western and interior TPIA. As the approximation of SLA, Hmed increases from east to west and is in agreement with the distribution of equilibrium-line altitude mainly influenced by the Indian monsoon and westerly (Reference YaoYao and others, 2012). As mentioned in the previous section, the trend of regional glacier changes in the TPIA is not similar to changes in annual mean air temperature but seasonal mean air temperature. The general slight retreat of glaciers or expansion of some glaciers in the Kunlun and Karakoram mountains was a combined effect of extreme air temperature increase coinciding with the most pronounced precipitation increase. Such a complex pattern of changes in both temperature and precipitation might give rise to a weakly negative or even slightly positive mass balance during 1999/2003-08 (Reference Gardelle, Berthier and ArnaudGardelle and others, 2012; Reference Kääb, Berthier, Nuth, Gardelle and ArnaudKääb and others, 2012), hence a slowdown in glacier retreat in the region during the recent decade as well as a general weak glacier retreat during the 1970s-2009 (Tables 2 and 4). The glacierized area in the TPIA is dominated by glaciers <1.0km2 in area, which comprise 82.2% of the total number, and 91.8% in the Gangdise range, a much higher contribution than in the surrounding regions (Reference ShangguanShangguan and others, 2006; Reference BolchBolch and others, 2010b). These small glaciers have shown a sensitive response to climate change (Reference Haeberli and HoelzleHaeberli and Hoelzle, 1995; Reference Ye, Ding, Liu and LiuYe and others, 2003), with a much higher percentage area reduction and some small glaciers even disappearing (Fig. 6) (e.g. in the Gangdise range and 5Z3 basin). Glaciers with large PDGs in the interior of the TPIA and Tanghla range retreated only slightly, perhaps because of their wide firn basin, high AAR, etc. (Reference WangWang, 1992). In summary, under extremely cold climatic conditions in the TPIA, changes in moisture may be a key factor controlling the development of glaciers and their response to climate change, although changes in the seasonality of air temperature are always fundamental (Reference Oerlemans and FortuinOerlemans and Fortuin, 1992; Reference Liu, Wang, Ding and XieLiu and others, 1999). In addition, regional differences in glacier change may be related to topographical configurations (e.g. PDGs) that determine the accumulation rate in the firn basin.
Reference Ding, Liu, Li and ShangguanDing and others (2006) divided glacier recession into three groups with annual decrease rates of <0.1%a–1, 0.10.2% a–1 and >0.2%a–1. The glacier recession was then promoted from the second level (moderate reduction) to the third level (most intense shrinkage) for the whole TPIA, and was also detected in some detailed regions. L. Reference Wang, Xie, Wang, Liu, Ding and ShangguanWang and others (2011) showed that glaciers in the TPIA decreased by 0.12%a–1 and 0.20% a–1 in the periods 1970-90 and 1990-2000 respectively, and in total have retreated at a rate of 0.15%a–1 during 1970-2000. Combined with a glacier recession rate of 0.27% a–1 during the 1970s-2009, this indicates that glaciers have experienced a continuous and accelerating recession for the whole TPIA. Based on our study, glaciers in the Nyainqentanglha range in the Nam Co drainage basin have decreased by 24.2% (0.70%a–1) in the period 1970s-2009, which is a slightly lower rate than during 1977-2010 (0.81%a–1; Reference Wang, Xie, Wang, Liu, Ding and ShangguanWang and others, 2012) but much higher than during 1976-2001 (0.27% a–1; Reference Bolch, Menounos and WheateBolch and others, 2010a). On the south slope of the western Kunlun mountains, glacier area decreased by 0.06% a–1 in the period 1970-91 and increased by 0.06%a–1 during 1991-2000, while the annual recession rate increased from 0.02%a–1 during 1970-2001 to 0.03%a–1 in the 1970s-2009 (Reference ShangguanShangguan and others, 2007). Although the recession has accelerated markedly, glacier constriction in the whole TPIA is still slight compared to the surrounding regions (Table 4), showing that glaciers in the central TP are less responsive to climate change (Reference Wang, Xie, Wang, Liu, Ding and ShangguanL. Wang and others, 2011; Reference YaoYao and others, 2012).
Table 4. Glacier reduction in the TP and surrounding regions
Glaciers in the TPIA are an important water resource for animals, grasslands and wetlands in the region (Reference Shi, Liu, Ye, Liu and WangShi and others, 2008). Meltwater from glaciers is also the key source controlling the changes of lakes in the TPIA (Reference Zhang, Xie, Kang, Yi and AckleyZhang and others, 2011; Reference LeiLei and others, 2012). A recent study shows that >80% of lakes in the TPIA have experienced a lake level rise of 0.14m a–1 on average during 2003–09, and only a few lakes showed a slight lake level decrease by 0.02–0.04 m a–1 (Fig. 8). The most prominent lake level rise has been seen in Cedo Caka lake, by a rate as high as 0.80m a–1 (Reference Zhang, Xie, Kang, Yi and AckleyZhang and others, 2011). Lake level rise has been evident for lakes in the southern TPIA, where glaciers have experienced intensive shrinkage. The observation data from meteorological stations in this region imply that precipitation increased less than evaporation (Reference Zhang, Xie, Kang, Yi and AckleyZhang and others, 2011), and of the closed lakes glacier-fed lakes have a different response to climate change than non-glacier-fed lakes in the same climate region (Reference LeiLei and others, 2012). Therefore the meltwater generated from accelerating glacier/ snow recession could be the primary reason for lake level increase. The lake level increases provide further indirect evidence for accelerating glacier recession (Reference LeiLei and others, 2012). Furthermore, the continuous and accelerating reduction of glaciers has an active influence on regional water storage and geohazards in downstream regions, by causing flooding and devastating wetlands and grasslands (Reference Yao, Pu, Lu, Wang and YuYao and others, 2007; Reference Zhang, Xie, Kang, Yi and AckleyZhang and others, 2011).
Fig. 8. Lake level change rates in the period 2003–09 (based on Reference Zhang, Xie, Kang, Yi and AckleyZhang and others, 2011), with glaciers in blue.
Conclusion
Based on multi-source datasets, determination of glacier changes was achieved but with varied results. We detected the recent state of glaciers and their changes over the past few decades. The results imply that the first CGI in the 1970s, after being rechecked using CTMs and other sources, is still an alternative dataset for monitoring glacier changes. Our study demonstrates that glaciers in the TPIA are in a period of continuous and accelerating recession, at an annual rate of 0.27% a–1 during the 1970s–2009. As a result of integrating the influence of climate pattern and glacier characteristics, the intensity of glacier recession differed significantly from region to region, as more pronounced glacier shrinkage has occurred in the southern TPIA while glaciers in the northwest have experienced the smallest recession. Moreover, the accelerating recession of glaciers is considered an important factor for lake level increases in the TPIA.
Acknowledgements
This work was supported by the National Natural Science Foundation of China (grant No. 41190084), the Ministry of Science and Technology of China (MOST) (grant No. 2013FY111400), the Chinese Academy of Sciences (CAS) under grant XDA05090302, and the State Key Laboratory of Cryospheric Sciences, CAREERI, CAS (grant No. SKLCS2012-09). The data applied in the study were a result of an immediate past project from MOST (grant No. 2006FY110200). Satellite images are from USGS and NASA.


