Introduction
In a previous article [Reference Clark1], I presented detailed images of stomata on the leaves of various plants. That article discussed the importance of understanding the properties and functions of stomata in a number of fields as they relate to understanding living conditions on Earth. Two parameters discussed in that article were the size and density of stomata on the undersides of leaves. The measure of stomatal size was expanded to include the heights and depths of various features above and below a leaf's surface. In that previous work, obtaining stomata to study at various degrees of openness was a challenge.
Photographic study of stomata is helped by understanding the environmental conditions necessary to control their opening and closing. Put simply, when water enters a stoma's guard cells they become turgid and the stoma opens. When water leaves the guard cells, the stoma closes. The mechanisms behind these actions are complex. A network of 70 components is involved in stomatal opening in response to levels of CO2, red light, blue light, and ABA (abscisic acid), a plant hormone [Reference Sun2].
At a macroscopic scale, transpiration and respiration during photosynthesis are studied using commercially available equipment [3] that measures the conductance of CO2 and water vapor through a large number of stomata. To observe the opening and closing of one or a few stomata at a microscopic scale, it would be useful to observe a living leaf within a sealed test chamber on a microscope and expose the leaf to a combination of environmental variables such as gases, temperature, humidity, and light. With a large enough specimen, differences in gas concentrations that enter and leave the chamber could be measured and related to photosynthesis within the leaf. With a large leaf area contained inside the chamber, many stomata would be involved in such a measurement, yet a user could observe individual stomata using the microscope.
In this article, I describe such an environmental chamber and related equipment for use with a light microscope. The chamber exposes a section of a living leaf (that is, a leaf attached to a plant) to various levels of stimuli including light, gas flow, and temperature. Adjusting these variables can stimulate the opening and closing of stomata of leaves in vivo.
Materials and Methods
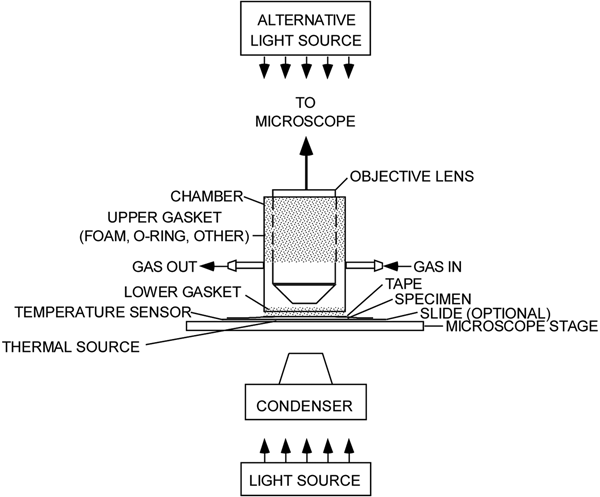
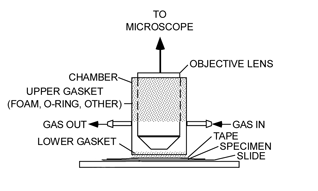
The experimental setup (Figure 1) comprises a microscope with a light source, a sealed environmental chamber, a microscope stage, a source of gas, a thermal source, and sensors for measuring light intensity, humidity, temperature, and CO2 levels. Excepting the microscope, most of the components were obtained online.

Figure 1: An experimental microscope setup showing a chamber for isolating a living leaf and exposing it to various environmental conditions. The stippled regions indicate where the objective lens and the leaf are sealed off from the atmosphere.
Microscope
A Nikon Eclipse LV100 microscope and a Point Grey Model GS3-U3-51S5C-C digital camera were used in this work. The camera was mounted on a 0.65× relay lens in the microscope's trinocular port. Instead of a standard microscope, an inverted microscope can be used by inverting the setup shown in Figure 1. Snapshot images were obtained using software provided by the camera manufacturer. Focus-stacking software was used to increase the depth of field of most images [4]. Both software applications run on a Windows 10 personal computer.
Light sources
For small-area illumination, an LED light source [5] replaced the incandescent bulb in the microscope's lamp house below the condenser (Figure 1). The source supplies red (R), green (G), blue (B), and white (W) light. An associated power supply energizes each color independently. The LED source is mounted on a water-cooled heat sink to permit high-power operation. The R, G, and B wavelengths emitted by the source are nominally 623, 525, and 456 nm, respectively. The W color temperature is 6500 deg. K. The W light source is used when stomata are being photographed. Koehler illumination was used for photography in most cases.
For large-area illumination, the microscope's condenser above the incandescent light source was defocused, that is, lowered by a predetermined amount. This results in a larger, unfocused source of light that illuminates a larger area of a leaf. In a variant of this arrangement, the microscope's condenser is removed and collimated light from the microscope's light source impinges on a leaf, resulting in a larger illuminated area. In yet another arrangement, an LED light source replaces the microscope's condenser and illuminates a leaf specimen directly. These arrangements can be used when it is desired to irradiate a large portion of a leaf in order to measure gas exchange while observing stomata.
Instead of using LEDs, a Diabloc Multifilter [Reference Clark and Brown6] can be placed between the microscope's incandescent light source and the condenser. White light illuminates the multifilter, which then is adjusted to simultaneously pass red and blue light of predetermined intensities.
Light source calibration
Calibration of the light intensity applied to a leaf was accomplished at the position of the leaf surface. In the example experiments described below, R and B light were used to stimulate a leaf. A photodetector was used to calibrate the intensity of each color. A widely used unit for expressing photosynthetically active radiation (PAR) intensity is moles of photons/area·time. For convenience in representing a large number of anything, Avogadro's number may be used. In the present case, a mole = 6.02 × 10²³ photons. Values of 100 μmol/m2·sec for each color are sufficient to cause most stomata to open when CO2 levels are low. For calibration, the microscope's objective lens was moved aside and a photodetector (1 in Figure 2) was placed in the beam of light passing through the microscope's stage at a point where a leaf's surface will reside. An electronic circuit was used to measure the photodetector current. The light system's controls were then calibrated in μmol/m2·sec. This concept is well-known and is discussed elsewhere [7].
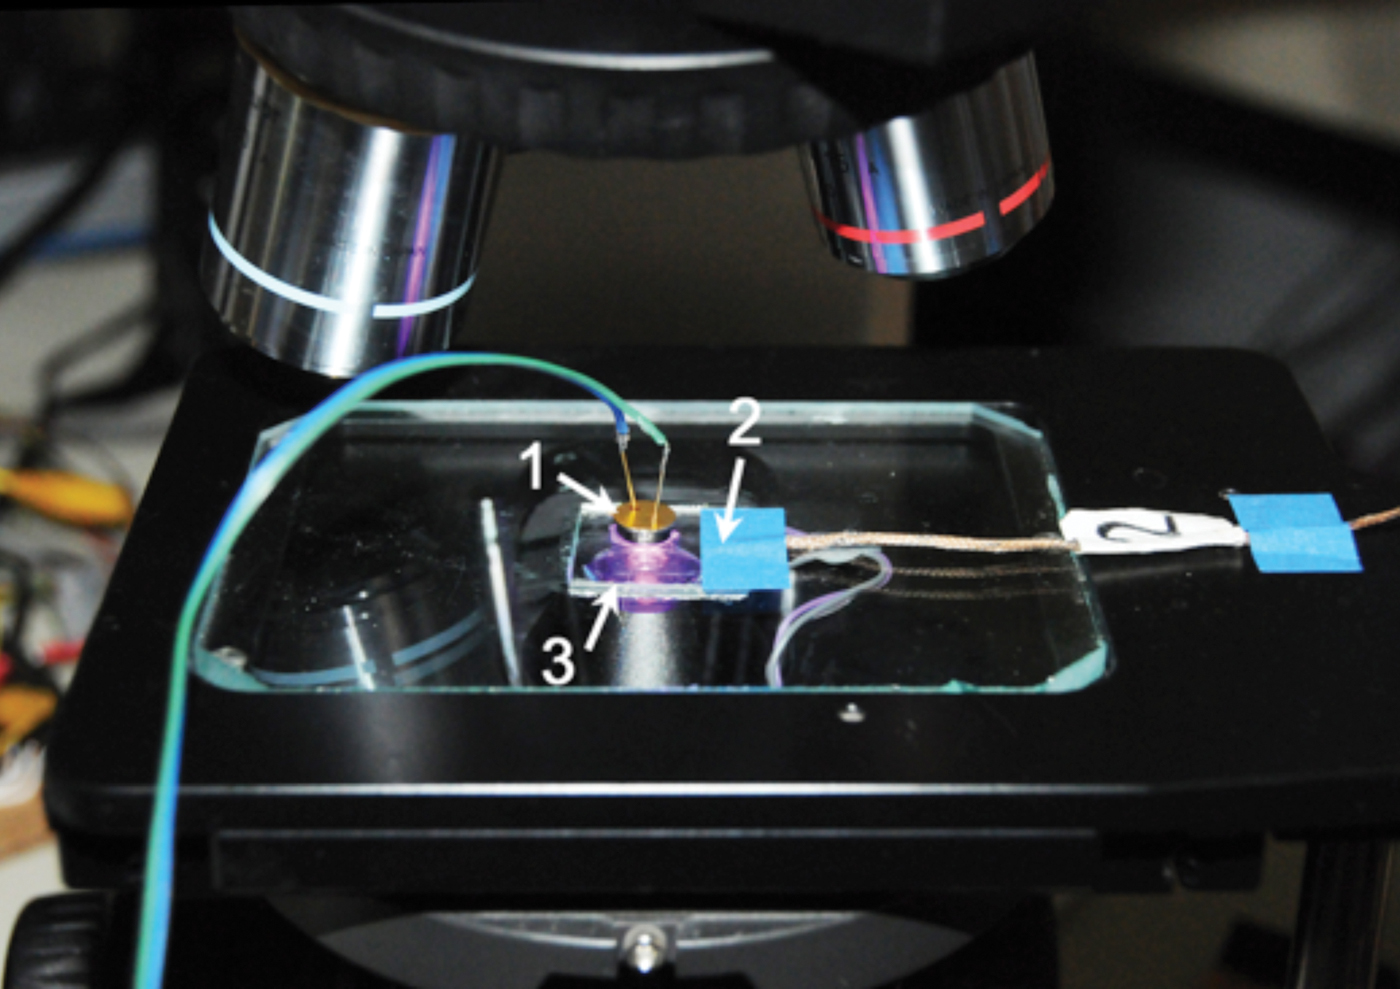
Figure 2: Experimental setup: photodetector (1), thermocouple (2), and heating element (3).
Gas source
In the experiments described below, two concentrations of CO2 were applied to a leaf being studied. In a first case, ambient room air was supplied to the chamber by direct connection to an aquarium air pump with a pumping capacity of 2 liters/min. The nominal concentration of CO2 in the author's laboratory air was 800 ppm, and the relative humidity was 65%. The CO2 concentration in outdoor air was measured to be about 400 ppm; however, it is not uncommon for the CO2 level in a closed space to reach 700–800 ppm when people are present. In a second case, air with a below-ambient concentration of CO2 was supplied by passing air from the aquarium pump through a cartridge containing high moisture content (12–19%) granulated soda lime [8]. In this case, the CO2 concentration was 0 ppm, and the relative humidity was 82%. Gas entering the chamber was analyzed using commercially available sensors [9,10]. In the simple experiments described below, gas leaving the chamber was not evaluated. Effects related to other gases and even pressures could be investigated with this system.
Chamber
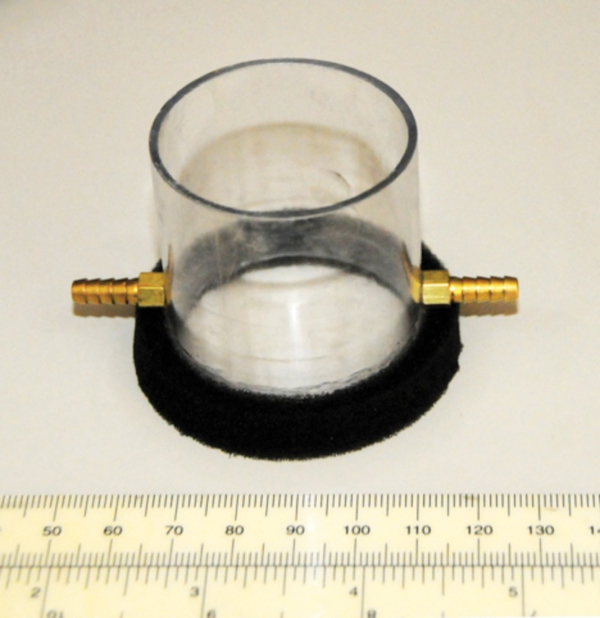
A chamber (Figure 3) was made from a piece of rigid plastic tubing, sized to fit freely over a microscope objective. Gaskets seal the gaps between the tubing and the objective, as well as the tubing and the leaf, on the microscope stage. The gaskets allow sliding movement of the chamber at each sealing location. Gas enters and leaves the chamber via two hose barbs. A resistive heating element (3 in Figure 2) was affixed to the underside of the microscope's stage in order to set the temperature of a leaf specimen. A thermocouple (2 in Figure 2) was secured to the microscope stage as close as possible to the leaf. It could also be placed in contact with the leaf itself.

Figure 3: Chamber that seals the leaf from the atmosphere, shown here with the lower foam gasket that seals the leaf (sealing material for the objective lens is not shown).
Gas analysis
For a small-area illumination, as described above, only a small area of a leaf was illuminated, affecting only a small number of stomata, and differences between gas entering and leaving the chamber were small. In the large-area illumination experiments, there would be sufficient concentration differences between the gas entering and leaving the chamber that the gas could be analyzed using commercially available sensors. Differences between entering and exiting gas levels would be a measure of the level of the photosynthesis taking place. In the present experiments, no gas analysis was undertaken.
Plant leaf intact
After an experiment was completed, the leaf was easily removed from the microscope stage and left intact on the plant being studied.
Results
Two experiments are described below. Both demonstrate transient openings and closings of a single stoma in response to a step change in variables. A Tradescantia spathacea leaf was secured to a microscope stage by masking tape (Figure 4a). The leaf was oriented with its stomata facing upward, that is, toward the objective lens. As a starting point for these experiments, the temperature, light levels, and wavelengths used in the study of stomatal opening were near those reported in the literature [Reference Assmann11,Reference Sharkey and Raschke12]. The effects of abscisic acid levels were not studied in these experiments.

Figure 4: Setup for observation of Tradescantia spathacea. (a) Securing a live leaf to the microscope stage with tape. (b) Chamber installed over leaf on microscope stage: chamber (1), chamber-objective gasket (2), chamber-stage gasket (3), and hose from gas source (4).
Experiment No. 1
In this experiment, temperature and illumination were held constant while the CO2 concentration and humidity in the chamber were varied between two extremes. The following steps were undertaken:
1. Koehler illumination was used.
2. R and B light LED light sources were activated, and both were set to deliver 100 μmol/m2·sec at the surface of the microscope stage.
3. An attached leaf on a recently irrigated T. spathacea plant was taped across the microscope stage with the underside of the leaf facing upward, toward the objective lens.
4. The heater attached to the stage was set to a temperature of 25 °C.
5. The chamber was placed over the a 50× objective lens and slid downward so that its lower gasket formed a seal against the leaf (Figure 4b).
6. A hose was connected from an air source to the inlet hose connector on the chamber. Room air with RH = 65% and a CO2 level of 800 ppm was pumped through the chamber for 40 minutes. Room air could also be pumped through a CO2 scrubber consisting of a tubular column filled with soda lime [8], then through the chamber. Thus, the concentration of CO2 in air passing through the chamber was varied between zero ppm (directly from the scrubber) and 800 ppm with the scrubber removed. Relative humidity of the air entering the chamber was 82% with the scrubber present and 64% with the scrubber absent.
7. A stoma of interest was selected for observation. The R and B lights were temporarily switched off, and the W light was energized long enough to record image stacks of the stoma. After picture-taking was done, the W light was switched off and the R and B lights were turned back on. This procedure was done at 10-minute intervals.
Results from Experiment No. 1
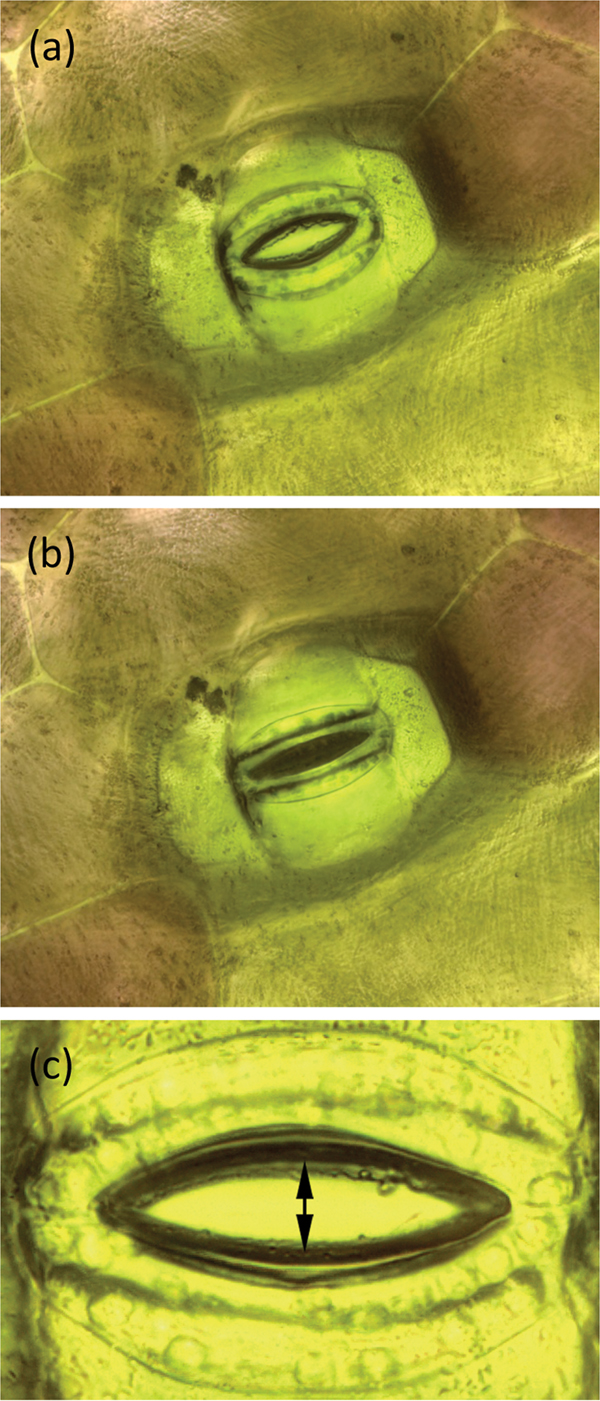
During the example experiment the stoma was stimulated to open and close by changing the humidity and concentration of CO2 in the chamber. Figures 5a and 5b show a T. spathacea stoma in open and closed conditions, respectively. Imaging software [13] was used to measure the area of the stomatal opening. A set of images used for areal measurement was 2048 pixels wide. Each square pixel had an area of 10−2 μm2. In each image, the area within the open stoma was determined manually using the “lasso” feature of the imaging software. A histogram function within the software then gave the number of pixels within the area. That number multiplied by the area of a pixel gave the area of the open stoma.

Figure 5: A stoma of T. spathacea (a) open and (b) closed (see Experiment No. 1). Image width = 250 µm. (c) Opening of stoma showing where measurements were made (see Experiment No. 2). Stomal opening extent was determined by measuring the number of pixels between the stomal edges. Vertical height of image = 209 µm.
The area of the stomatal opening was recorded over time as the leaf was stimulated by two events. The results are shown in Figure 6. The abscissa is elapsed time in minutes, and the ordinate is the area of the stomatal opening in μm2. Prior to the first event, #1 in Figure 6, the leaf was exposed to room air for 40 minutes. The stomatal opening was closed for the conditions of light, temperature, humidity, and CO2 concentration imposed on the leaf. At Event #1, the CO2 scrubber was connected and the chamber was supplied with air that had a CO2 level of 0 ppm and RH = 85%. At Event #2, the CO2 scrubber was disconnected and the chamber was again supplied with air having a CO2 level of 800 ppm and RH = 64%. The stoma opened between Events #1 and #2 and closed again after Event #2.
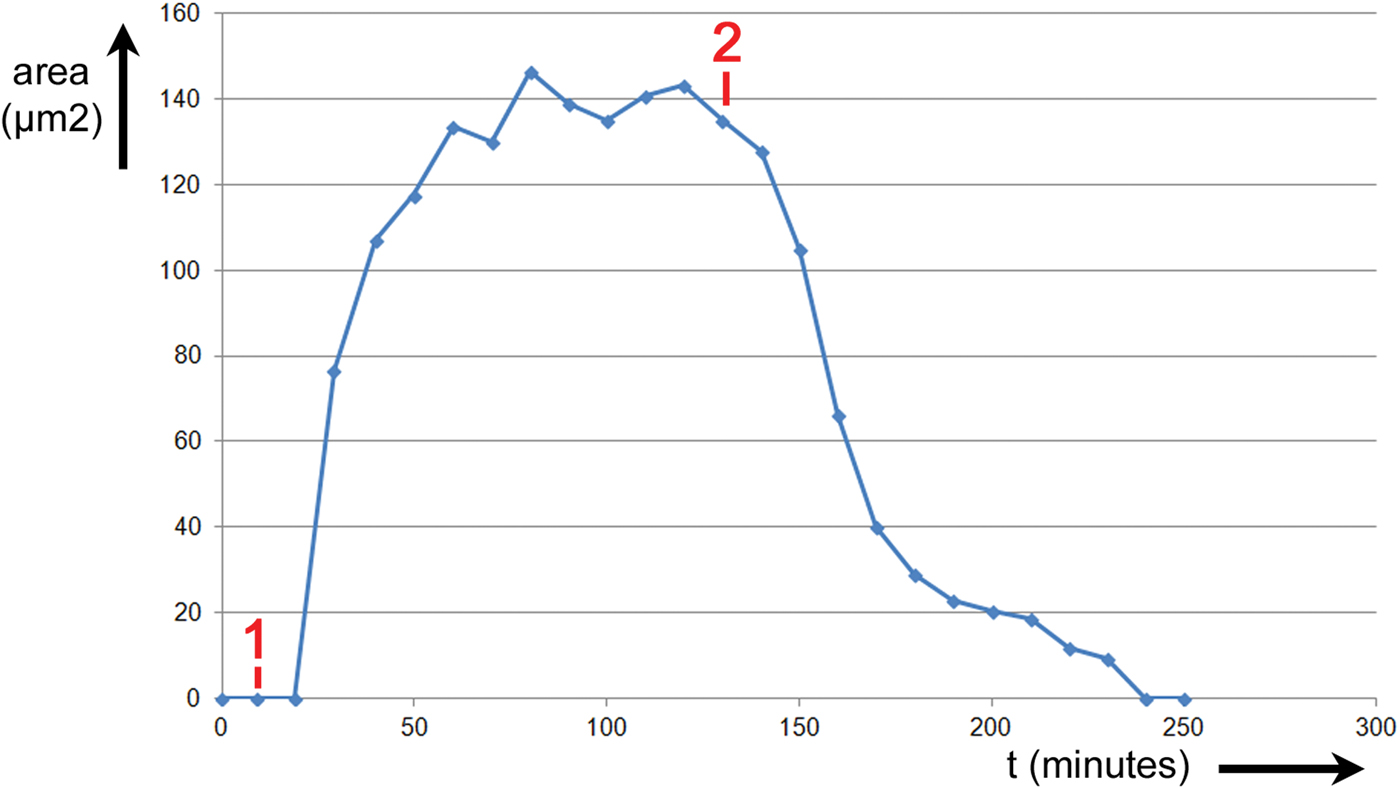
Figure 6: Experiment No. 1. Changes in T. spathacea stomatal open area prompted by two events. Prior to Event #1 leaf was exposed to room air containing nominally 800 ppm of CO2 and RH = 65%. At Event #1 scrubber was connected reducing CO2 level to zero and RH = 85%. At Event #2 the scrubber was disconnected, again exposing the leaf to 800 ppm of CO2 and RH = 65%.
The time for the stoma to fully open after Event #1 was approximately 80 minutes. The time for the stoma to fully close after Event #2 was approximately 110 minutes. Thus, with all other parameters being equal, the stomatal response to the change in CO2 and humidity took nearly 40% longer to close when CO2 was restored as it did to open when CO2 was removed.
Videos showing the progress through these experiments can be found at https://paedia.com/Stomata.html.
Experiment No. 2
In this experiment, temperature, humidity, and CO2 concentration were held constant while the illumination of the leaf was varied between two extremes. The following steps were undertaken:
1. Koehler illumination was used.
2. The R LED light source was activated and set to deliver 300 μmol/m2·sec at the surface of the microscope stage. The B light was OFF.
3. A recently irrigated T. spathacea plant was placed next to the microscope's stage, and an attached leaf was taped across the microscope stage with the underside of the leaf facing upward, toward the objective lens.
4. A heater attached to the stage was activated and set to a temperature of 25 °C.
5. The chamber was placed over the 50× objective and slid downward so that its lower gasket formed a seal against the leaf (Figure 4b) and the upper gasket sealed against the objective lens.
6. A hose was connected from a room air source to the inlet hose connector on the chamber, and room air with RH = 65% and CO2 level of 800 ppm was pumped continuously through the chamber.
7. A stoma of interest was selected for observation. The R light was temporarily switched off, and the W light was energized long enough to record an image of the stoma. After picture-taking was done, the W light was switched off and the R light was turned back on. Image stacks of the stoma were acquired and processed at periodic intervals. Stomal opening was determined by measuring the number of pixels between the stomal edges as shown in Figure 5c. The vertical extent of each image was 2048 pixels over a span of 209 µm so each pixel represented 0.1 µm.
Results from Experiment No. 2
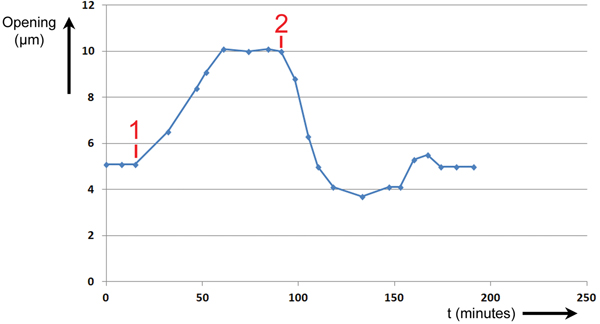
During Experiment #2, a stoma was stimulated to open and close by changing the intensity and wavelength of illumination applied to the leaf. The height of the stomatal opening was recorded over time as the leaf was stimulated by two events. The results are shown in Figure 7. The abscissa is time in minutes, and the ordinate is the height of the stomatal opening in μm.
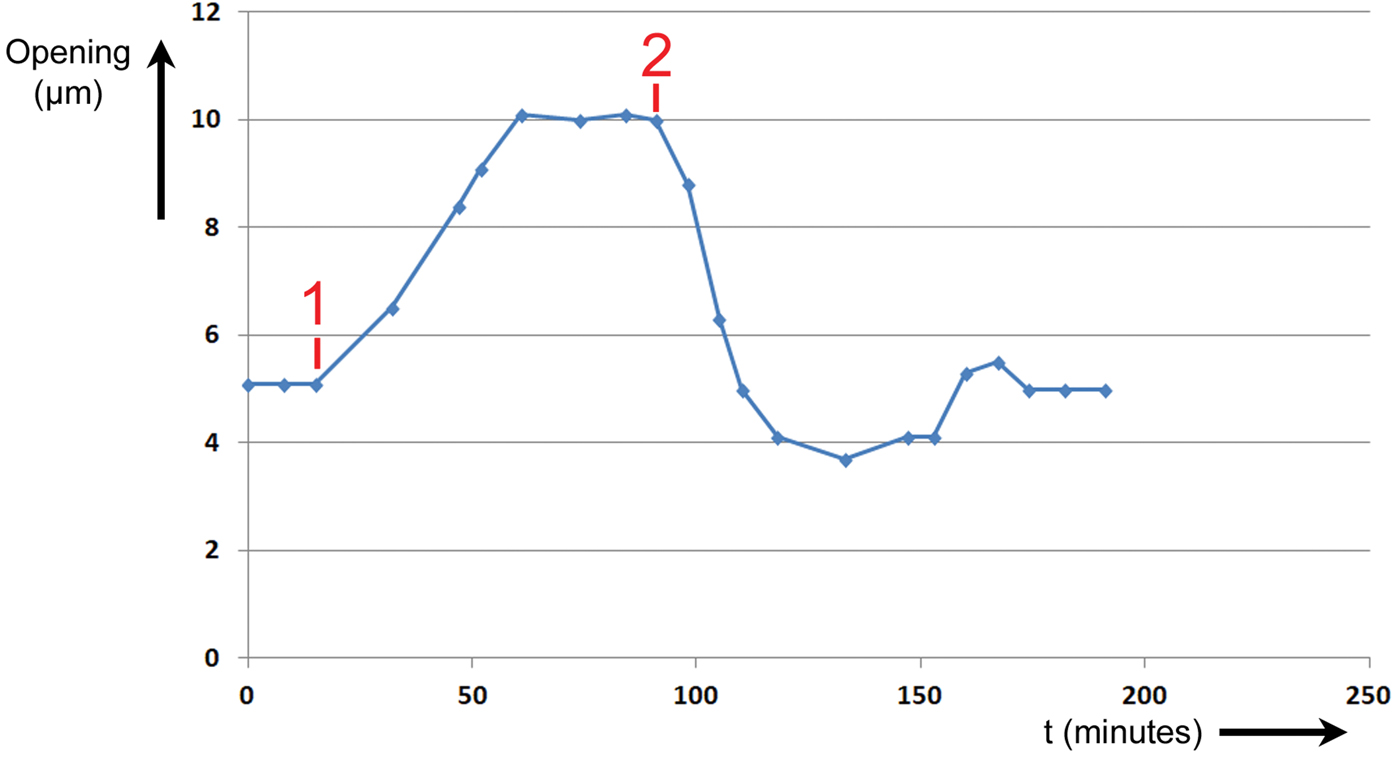
Figure 7: Experiment No. 2. Changes in T. spathacea stomal opening extent in response to two events. Prior to Event #1 stomal opening equilibrated at 5 µm in red light of intensity 300 μmol/m2·sec. At Event #1 blue light of intensity 100 μmol/m2·sec was added, and a new equilibrium was established. At Event #2 the blue light was switched OFF, and the opening returned to 5 µm.
Prior to Event #1, the stoma was allowed to equilibrate at an opening of 5 µm at this level of R light. At Event #1, 15 minutes into the experiment, B light of intensity 100 μmol/m2·sec was added to the R light. The stoma began opening immediately and continued opening until it equilibrated at a maximum of 10 µm at 61 minutes. It was assumed that this was the maximum opening because the increase in size stopped abruptly. At Event #2, 91 minutes from the start of the experiment, the B light was switched OFF. The stoma began closing immediately and exhibited a slight undershoot followed by an overshoot before returning to a final equilibrium value of 5 µm after 174 minutes.
Discussion
The apparatus shown here enables the macroscopic and microscopic study and observation of plant stomata in a controlled environment. In further experiments, gases entering and leaving the chamber could be compared for the study of transpiration and respiration while simultaneously observing individual stomata as they open and close. Other living organisms such as algae, molds, bacteria, insects, and the like could also be studied under the variety of conditions achievable within the chamber. Non-biological specimens could be observed as they change phase and composition with changes in temperature, ambient gas levels, pressure, and illumination.
Conclusions
An environmental chamber used in conjunction with a light microscope permitted observation of the opening and closing of leaf stomata in two controlled experiments. Stomatal openings and closings were observed and measured as first humidity and CO2 concentration, and then light were varied within the chamber. Transient and equilibrium responses to predetermined environmental conditions were observed. Detailed still and moving picture representations of stomata were obtained using focus-stacking photography. Although leaf stomata are featured here, the apparatus and methods described could be used to study many other subjects.
Acknowledgment
Special thanks are due to Brian Brown who helped make the apparatus. Patent protection is pending for several aspects of the apparatus described herein.