Introduction
Much interest has been focused on (Al, In)GaN alloys and their heterostructures, because their band gap energy varies between 6.2 and 1.9 eV at room temperature, and because of their potential applications such as red-ultraviolet (UV) light emitting devices [Reference Nakamura, Senoh, Iwasa, Nagahama, Yamada and Mukai1,Reference Nakamura, Senoh, Nagahama, Iwasa, Yamada, Matsushita, Sugimoto and Kiyoku2], solar-blind ultraviolet detectors [Reference Wu, Keller, Keller, Kapolnek, Kozodoy, DenBaars and Mishra3], and high power and high temperature devices [Reference Wu, Keller, Keller, Kapolnek, Kozodoy, DenBaars and Mishra4,Reference Yang, Schmidt, Shan, Song and Goldenberg5]. It has been demonstrated that InGaN-based light emitting devices are highly efficient and have very low thresholds, and it is believed that their recent success is deeply related to the role of carriers localized in the InGaN active region. For the InGaN-based light emitting device structures, In alloy inhomogeneity and/or quantum-dot-like In phase separation have been proposed as the origin of the localized states [Reference Chichibu, Azuhata, Sota and Nakamura6-Reference Narukawa, Kawakami, Fujita, Fujita and Nakamura10], and an anomalous temperature dependence of the InGaN emission peak energy due to band-tail states was observed [Reference Cho, Gainer, Fischer, Song, Keller, Mishra and DenBaars11-Reference Zolina, Kudryashov, Turkin and Yunovich13].
However, according to recent thermodynamical calculations, ternary AlGaN alloys are predicted to not have an unstable mixing region, and hence, no phase separation is expected, in contrast to InGaN and InAlN alloys [Reference Matsuoka14]. Although understanding the emission mechanism and the role of the energy tail states in (Al, In)GaN alloys is very important for shorter wavelength light-emitting devices, the detailed emission properties of these materials have not been fully clarified. In this work, we report optical properties of AlxGa1-xN epilayers (x ≤ 0.6) in compare with GaN and In0.18Ga0.82N, as a function of temperature using photoluminescence (PL), integrated PL intensity, and time-resolved PL (TRPL).
Experiment
The AlxGa1−xN thin films used in this study were grown by metalorganic chemical vapor deposition (MOCVD) on (0001) sapphire substrates. The samples were nominally identical aside from deliberate variations in the Al content x of the AlxGa1−xN alloys, to investigate the influence of x. The growth temperature was about 1050 °C. Prior to AlxGa1−xN growth, a thin ∼ 5-nm-thick AlN buffer layer was deposited on the sapphire at a temperature of 625 °C. Triethylgallium, triethylaluminum, and ammonia were used as precursors in the AlxGa1−xN growth. The AlxGa1−xN layer thickness was about 1 μm. To evaluate the Al alloy composition and to check for ordering effects, the samples were analyzed with high-resolution x-ray diffraction (XRD) using Cu Kα1 radiation. PL experiments were performed using the 244-nm line of an intracavity doubled cw Ar+ laser as an excitation source. TRPL measurements were carried out using a picosecond pulsed laser system consisting of a cavity-dumped dye laser synchronously pumped by a frequency-doubled modelocked Nd:YAG laser for sample excitation and a streak camera for detection.
Results and Discussion
Figure 1 shows the PL peak energy position (EPL) as a function of temperature for In0.18Ga0.82N [Reference Cho, Little, Gainer, Song, Keller, Mishra and DenBaars15], GaN, and AlxGa1−xN epilayers with x = 0.17, 0.26, 0.33, and 0.6. The temperature-dependent PL peak shift for the GaN layer was consistent with the well-known energy gap shrinkage: Eg(T) = Eg(0) − αT2/(β+T), where Eg(T) is the band-gap transition energy at a temperature T, and α and β are known as the Varshni thermal coefficients [Reference Varshni16]. On the other hand, the PL emission from In0.18Ga0.82N and AlxGa1−xN with rather high x did not follow the typical temperature dependence of the energy gap shrinkage. Instead, these ternary alloys clearly showed the “S-shaped” emission shift [initial redshift (region I), blueshift (region II), and final redshift (region III)] with increasing temperature] behavior, which is not seen in random homogeneous III-V alloys. For the AlxGa1−xN epilayer with x = 0.17 (0.26, 0.33, 0.6), with increasing temperature up to TI, where TI is ∼ 20 (50, 90, 150) K, an initial small decrease in EPL was observed, followed by an increase in EPL in the temperature range of TI - TII, where TII is ∼ 70 (110, 150, 225) K, and finally, EPL decreased again as the temperature increased above TII. This anomalous temperature-induced emission shift is very similar to the behavior previously observed in the In0.18Ga0.82N epilayer (TI and TII were ∼ 50 K and ∼ 110 K, respectively, for the In0.18Ga0.82N epilayer) [Reference Cho, Little, Gainer, Song, Keller, Mishra and DenBaars15], except that the amount of the redshift in region I of In0.18Ga0.82N is larger than that of AlxGa1−xN of comparable alloy content x, possibly due to a different nature (or degree) of potential fluctuations. Note that the corresponding temperature regions of the AlxGa1−xN epilayers significantly depend on x: with increasing x, the characteristic temperatures TI and TII increase and the temperature regions I and II are extended into higher temperatures. Another unusual property of the PL spectra for these ternary alloys is that the FWHM shows an anomalous “inverted S-shaped” FWHM broadening (increase-decrease-increase) behavior with increasing temperature [Reference Cho, Little, Gainer, Song, Keller, Mishra and DenBaars15, Reference Cho, Gainer, Lam, Song, Yang and McPherson17].

Figure 1. PL peak energy for In0.18Ga0.82N [Ref. 15], GaN, and AlxGa1−xN (x = 0.17, 0.26, 0.33, and 0.6) epilayers in the temperature range from 10 to 300 K. The emission peaks from In0.18Ga0.82N and AlxGa1−xN clearly show an anomalous S-shaped shift with increasing temperature. The free exciton (FX) and bound exciton (BX) curves are shown for GaN and follow the typical temperature dependence of the energy gap shrinkage.
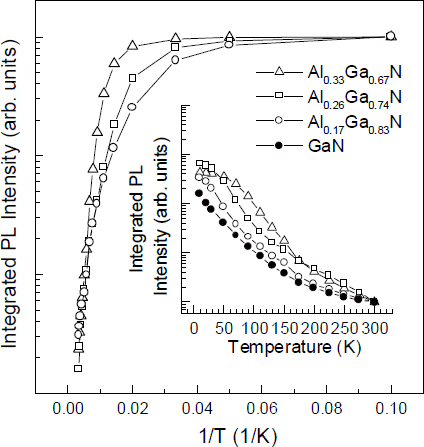
Figure 2 shows Arrhenius plots of the normalized integrated PL intensities (IPL) over the temperature range of 10 – 300 K. The main difference between the IPL curves occurs in the temperature range showing the abnormal temperature dependence (i.e., regions I and II). An activation energy (Ea) estimated from the relationship IPL = I0/[1+A exp(-Ea/kT)] in the transition region II corresponds to the magnitude of effective potential fluctuations. The activation energies are 9.6 ± 1.5, 21.2 ± 1.2, and 44.6 ± 1.8 meV for the AlxGa1−xN epilayers with x = 0.17, 0.26, and 0.33, respectively, reflecting more effective confinement with increasing x.

Figure 2. Normalized integrated PL intensity as a function of temperature for the AlGaN-related emission of AlxGa1−xN epilayers with Al content x = 0, 0.17, 0.26, and 0.33.
Figure 3 shows the temperature dependence of the TRPL lifetimes for the Al0.17Ga0.83N and Al0.33Ga0.67N thin films. The lifetimes were monitored at the peak energy (closed circles), lower energy side (open squares) and higher energy side (open triangles) of the PL peak position. For both samples, the measured lifetime increases with decreasing emission energy, and hence, the peak energy of the emission shifts to the low energy side as time proceeds. In temperature region I, the change in lifetime with temperature is very small and the difference between the lifetimes measured above, below, and at the peak energy is quite large, indicating that radiative recombination processes are dominant. As the temperature is further increased, the overall lifetime quickly decreases in region II and is almost constant in region III, reflecting a strong influence of non-radiative recombination processes. This is further evidenced by a quick decrease in the difference between lifetimes measured above, below, and at the peak energy in region II and no difference through region III. Using the relationship between the quantum efficiency η(T) and the lifetime τ(T), we found that the transition from radiative to nonradiative recombination occurs at ∼ 30 and ∼ 80 K for the Al0.17Ga0.83N and Al0.33Ga0.67N thin films, respectively. Consequently, radiative recombination is dominant in region I, and the transition from radiative to nonradiative recombination occurs at about TI, for both samples. In region II, in which a blueshift of the PL peak energy was observed, nonradiative recombination becomes dominant, so the lifetimes and their differences dramatically decrease. In region III, a typical temperature dependence of PL spectra was observed and no sudden change of lifetime occurs.

Figure 3. Lifetime as a function of temperature for the emission in AlxGa1−xN epilayers with x = 0.17 and 0.33. Note that the lower energy side of the PL peak has a longer lifetime than the higher energy side for T < TII, while there is no difference between lifetimes monitored above (open triangles), below (open squares), and at (closed circles) the peak energy for T > TII.
A similar anomalous temperature dependence for the PL peak energy was reported for ordered (Al)GaInP [Reference Driessen, Bauhuis, Olsthoorn and Giling18, Reference Yamashita, Kita, Nakayama and Nishino19] and disordered (Ga)AlAs/GaAs superlattices [Reference Chomette, Deveaud, Regreny and Bastard20, Reference Yamamoto, Kasu, Noda and Sasaki21]. Moreover, there have been some reports on the long-range ordering effect in molecular beam epitaxy-grown InGaN and AlGaN films [Reference Korakakis, Ludwig and Moustakas22]. To determine if ordered domains are in our AlxGa1−xN alloys, XRD measurements were made. However, no (0001) XRD patterns were observed, indicating an absence of ordered domains in the AlxGa1−xN alloys under investigation. Therefore, we rule out the possibility of the ordering effect in the AlxGa1−xN alloys. This is quite surprising since the AlGaN ternary alloys investigated have neither ordering effects nor phase separations (according to theoretical prediction [Reference Matsuoka14]), and most homogeneous ternary alloys do not show such an anomalous emission behavior. Therefore, we conclude that the anomalous emission is due to optical transitions from “localized” to “extended” band tail states, and that the band-gap fluctuation responsible for the anomalous behavior is enhanced with increasing x and can be attributed to energy tail states of inhomogeneous alloy fluctuations non-randomly distributed in the plane of the epilayers.
Conclusions
We investigated the optical characteristics of MOCVD-grown (Al, In)GaN epilayers by means of PL, integrated PL intensity, and TRPL. We observed anomalous temperature-induced PL emission behavior for In0.18Ga0.82N and AlxGa1−xN epilayers: an “S-shaped” PL peak energy shift (decrease-increase-decrease) and an “inverted S-shaped” PL FWHM broadening (increase-decrease-increase) with increasing temperature. From the integrated PL intensity and TRPL measurements as a function of temperature, we found that the anomalous temperature-induced emission shift is deeply related to thermal population in localized energy tail states of alloy potential inhomogeneities in the AlxGa1-xN epilayers. The following characteristics increase with increasing Al content in the AlGaN epilayers: (i) a Stokes shift between the PL peak energy and the absorption edge, (ii) a redshift of the emission with decay time, (iii) the deviations of the PL peak energy, FWHM, and PL intensity from their typical temperature dependence, and (iv) the corresponding temperature range of the anomalous emission behavior. Therefore, we attribute the anomalous emission behavior to the enhanced band-gap fluctuation in AlxGa1-xN epilayers caused by an inhomogeneous spatial distribution of the Al content, and the degree of band-gap fluctuation increases with increasing x.
Acknowledgements
The authors would like to acknowledge the contributions of Dr. Y. H. Kwon for the XRD measurements. This work was supported by AFOSR, ARO, ONR, DARPA, and CRI of MOST.