

1. Introduction
In the century that has passed since the great 1918 influenza pandemic, there have been three further influenza pandemics in 1957, 1968 and 2009, but the combined death toll from these lesser pandemics is only a small percentage of the tens of millions who died in the 1918 pandemic, which stands as the deadliest in history. More died from the 1918 pandemic than in the First World War. The catastrophic death toll depends partly on the specific lethality characteristics of the 1918 H1N1 virus, partly on the vulnerability of individuals to the H1N1 virus, and also partly on the dynamics of its contagion. To begin, a review is given of the contagion of the 1918 pandemic.
1.1 Influenza contagion
Consider someone who is infected with influenza. The number of secondary infections generated by this primary infection is called the basic reproductive number R0. This depends on the chance that an infected person infects another close by, which is a characteristic of the virus, and the number of people in the social network of the infected person, which is a characteristic of the social connectivity of the person. Those at hubs of social networks can become super-spreaders of infectious disease.
Pandemics are often associated with mass fluxes of populations, such as those that arise during times of war, when people are mobilised on an epic international scale (Humphries, Reference Humphries2013). The large mixture of different populations increases the contagion of infectious diseases such as influenza. Significantly for risk assessment, political conflict and disease spread are causally linked. In Yemen, ravaged by civil war since 2015, the cholera epidemic has become the largest in modern history, with a million cases by the end of 2017.
The origins of the great pandemic of a century ago remain obscure. But the mass contagion on the Western Front was greatly exacerbated by a cohort of 95,000 Chinese labourers who journeyed from Northeast China via ship to Vancouver; by train across Canada to Nova Scotia; by ship to Plymouth and other English ports; by train to Folkestone in southern England; before embarkation to their destination in France and Flanders. The Chinese Labour Corps programme was eventually cancelled by the British government because of the danger of “plague” in China. Had this programme not been cancelled, the contagion source would have continued to fuel the pandemic.
The labourers were despatched by the Chinese government in the forlorn hope that by providing logistical assistance to the Allies, China might be restored its prized seaside port city of Qingdao, a former German colony (illustrated in Figure 1).
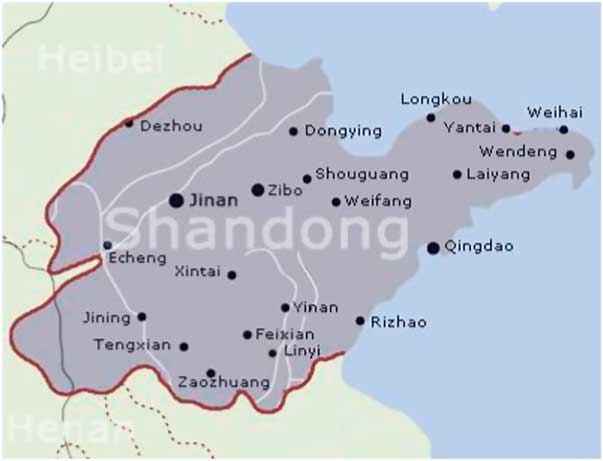
Figure 1 Map of Shandong province of Northeast China, from where many of the Chinese Labour Corps were recruited. The port city of Qingdao is shown on the northeast coast.
The 1918 influenza pandemic is mistakenly called “The Spanish Flu”, because Spain was neutral during the First World War, and there was no news embargo on the death toll there. Most likely, migrant Spanish and Portuguese workers travelling by train to and from France brought the pandemic to Spain (Trilla et al., Reference Trilla, Trilla and Daer2008). Indeed, in Spain, the 1918 pandemic is sometimes called “The French Flu”.
More accurately and informatively, the pandemic might be termed, “The Qingdao Revenge” (Woo, Reference Woo2015). China was never granted what was sought in sending the Chinese Labour Corps to the Western Front, but the deadly scourge of influenza was spread around the globe. Infected ships sailed from Plymouth in southern England to Brest in France, Boston in United States and Sierra Leone. From West Africa, infected ships sailed to Brazil and elsewhere in South America etc. Another consequence of China being snubbed at the post-war Treaty of Versailles, was its mistrust of the western powers.
Counterfactually, the Chinese Labour Corps might never have been sent. Reluctant to make any colonial concessions, the British had originally rejected the Chinese offer of labourers, as they had turned down the offer of troops. The mounting attritional losses on the Western Front changed the British response, but this was a finely balanced decision. The British war cabinet did not want to give China leverage over its crown colony of Hong Kong, or its other economic interests in China. The indifferent treatment of the labourers by the British army reflects the substantial chance that the Chinese Labour Corps might never have been permitted.
The deadly virus that first appeared in China in the winter of 1917–1918 might then have spread far more slowly overland westwards through Central Asia to Europe, with a smaller effective reproductive number R0, and less global dispersion. The worldwide toll of influenza victims might then have been significantly mitigated. To understand this, consider the Ebola crisis of 2014–2015. The virus was effectively contained within West Africa, and this greatly reduced the number of victims. Had there been a large inter-continental migration of many tens of thousands from West Africa, Ebola would have spread by air rapidly around the world. In the more recent Ebola outbreak in the Democratic Republic of the Congo, the war zone has complicated the rollout of Ebola vaccine (Maxmen, Reference Maxmen2018).
In general, standards of public health today are far higher than in 1918, and it is of practical interest to consider the pathways by which a pandemic disaster of 1918 proportions could re-emerge. The nexus between political conflict and a global pandemic provides one clear route to disaster. If an epidemic were to emerge in one of the numerous developing regions in a state of political unrest, civil strife or anarchy, the absence of disease surveillance and fragile public health system could well allow the contagion to become established there and then spread abroad to other continents via refugees with little constraint.
2. Age-profile of victims of the 1918 pandemic
As with the Great War, the pandemic disaster has gradually receded from living memory, but the public health interest has not faded. The centenary of the 1918 pandemic provides an opportune time for life and health insurers and actuaries to look back and learn important lessons from pandemic research. Remarkably, considering the many decades that have elapsed since 1918, and the scientific revolution of molecular biology that shaped the second half of the 20th century, it is only in the past few years that virologists have resolved one of the great mysteries of the 1918 pandemic: the age-dependence of mortality. This resolution, which transforms our understanding of pandemic mortality, is important for many stakeholders in the health industry, and is of particular significance for life and health insurers.
As with all historical disasters, extensive research into understanding what happened, and indeed, what else might have happened, is rewarded by an improved framework for risk assessment (Woo et al., Reference Woo, Maynard and Seria2017). One of the well-known, but still puzzling, characteristics of the 1918 pandemic was that the mortality rate amongst young adults was especially high. This has been ascribed to an over-reaction of the immune response system, referred to as a cytokine storm. Consider someone in their late 20s in 1918. It turns out that such an individual was especially vulnerable to the pandemic; more vulnerable than someone in their 30s, or teens, who would also have an active immune system. The cytokine storm theory has never really been able to explain the age-dependence of 1918 mortality very well. It is hard to understand why 30-year olds would be subject to the cytokine storm reaction when 18-year olds were not. There must be some other important mechanism involved.
For scientific research into extreme hazard events, both natural and man-made, it often takes the occurrence of further events to achieve a better understanding of what happened in the past. Catastrophes are rare occurrences, and scientific progress typically makes discrete jumps when major new events occur. In between times, ideas can be formulated, but empirical evidence is required to confirm them.
This is the case with pandemic risk, where the later pandemics in 1957 (H2N2), 1968 (H3N2) and 2009 (H1N1), and the deadly emerging H5N1 and H7N9 influenza viruses of the 21st century have supported virological studies in achieving a new perspective on the age-dependence of pandemic risk. In the centenary year of the 1918 pandemic, a natural question to ask is what the outcome would be if the same pandemic were to strike in 2018. Crucially, why would the vulnerability of a 28-year old in 2018 not be as high as that of a 28-year old in 1918?
Birth-date is a key risk parameter never appreciated before by pandemic risk analysts as relevant information supplementary to the age of an individual. Yet each pandemic influenza virus leaves its historical mark on the human population. From the perspective of pandemic risk, any year can be represented by the preceding pandemics, exposure to which has shaped the vulnerability of the current population. In 2018, these influential pandemics are 2009 (H1N1); 1968 (H3N2); 1957 (H2N2); 1918 (H1N1). This event-driven perspective of time mirrors that of the theoretical physicist, Carlo Rovelli (Reference Rovelli2018), for whom the world is made of events not things.
2.1 The cytokine storm
Cytokines are a diverse group of small proteins that are secreted by cells for the purpose of intercellular signalling and communication. They aid cell-to-cell communication in immune responses, and stimulate the movement of cells towards sites of inflammation and infection. Specific cytokines can elicit a variety of responses, depending upon the cytokine and the target cell. Among the many functions of cytokines are the control of cell proliferation and differentiation and the regulation of immune and inflammatory responses.
The term, “cytokine storm” was coined a quarter of a century ago in 1993, echoing the 1991 “Desert Storm” military campaign against Saddam’s Iraqi forces. The military metaphor is particular apt for the 1918 pandemic influenza, which ravaged the armies waging war on both sides of the Western Front. The original medical context was the human body’s immunological response to organ transplantation.
It has since been the focus of much medical research into a variety of major diseases (Tisoncik et al., Reference Tisoncik, Korth, Simmons, Farrar, Martin and Katze2012). The cytokine storm is best exemplified by severe lung infections, in which local inflammation spills over into the systemic circulation, producing systemic sepsis, which is a potentially life-threatening complication of an infection. Sepsis occurs when chemicals released into the bloodstream to fight the infection trigger inflammatory responses throughout the body. This inflammation can trigger a cascade of changes that can damage multiple organ systems, causing them to fail.
The action of the human immune response system is clearly a crucial aspect of pandemic disease. Studies done of patients who died from the 2009 H1N1 pandemic virus have shown how the virus could replicate efficiently in the lung, and how the pathogenic character of a virus is related to both viral replication and production of pro-inflammatory mediators.
The cytokine storm hypothesis can help explain how an individual’s inflammatory response can have a highly detrimental effect in dealing with a viral threat. But it begs the question of whether there is some undiscovered lethality factor. Within the influenza virus are eight segments of viral RNA. These molecules carry all the information needed to make new influenza virus particles. Scientists have pondered whether there is some obscure unknown lethality factor embedded within the eight RNA segments of the influenza virus. The principle of antigenic imprinting, which is reviewed in the next section, shows that no such hidden factor is required to explain the age-dependence of mortality extremely well. Crucially, the lethality of a virus is only partly intrinsic to the virus. Lethality also depends on the immunity of an individual that has arisen from past influenza exposure.
The fact that the lethality of a virus is only partly intrinsic to a virus is mirrored by its degree of contagion. This also is only partly intrinsic to the virus. If a virus attaches to the upper respiratory tract, coughing may spread the virus more easily to humans in close contact with an infected individual. But the social network of an individual is also crucial for determining the contagion. However much an individual coughs, nobody will be infected if the individual is isolated. The more people that an infected person is in close contact with, the more infections will be generated. Thus, the mass transport to the Western Front of the 95,000 Chinese Labour Corps, in cramped and unhygienic transport conditions, was one of the large-scale international social network factors that accelerated the global spread of the 1918 pandemic.
2.2 Antigenic imprinting
Influenza viruses responsible for causing pandemics are influenza type A viruses which emerge as a result of a process called antigenic shift. Such a shift causes an abrupt major change in proteins on the surface of the influenza A virus. Certain antigenic shifts may allow the virus to become more easily transmissible. Once this type of shift occurs, infection usually spreads quickly. Antigenic shift is most dangerous when it occurs in a virus with high lethality.
Antigenic shift is associated with two proteins, Hemagglutinin and Neuraminidase, found on the surface of an influenza type A virus. Approximately 80% of the spikes are Hemagglutinin, which functions in attaching the virus to a host cell. The remaining 20% of the spikes consist of Neuraminidase, which is predominantly involved in facilitating the release of newly produced virus particles from the host cell. These proteins are the basis of a simple two-factor classification system: HmNn: m is an integer from 1 to 16, and n is an integer from 1 to 9.
In immunology, an antigen is a molecule capable of inducing an immune response in the host organism. Antigenic differences between the 144 influenza A viruses are used to classify them into 16 HA (H1–H16) and 9 NA (N1–N9) subtypes. In evolutionary biology, a phylogenetic tree is a branching diagram or tree showing inferred evolutionary relationships based upon similarities and differences in their physical or genetic characteristics. Phylogenetically, there are two groups of HAs: Group 1 contains H1, H2, H5, H6, H8, H9, H11, H12, H13 and H16, and Group 2 contains H3, H4, H7, H10, H14 and H15. NAs also form two groups: Group 1 contains N1, N4, N5 and N8, and Group 2 contains N2, N3, N6, N7 and N9. Viruses of all subtypes are found in avian species, predominantly waterfowl.
Understanding the phylogenetic structure of influenza A viruses is crucial because of cross-immunity between subtypes. The principle of antigenic imprinting from childhood is that individuals imprint on the HA group of their first flu exposure and thereby experience a reduced risk of severe disease from novel flu strains within that same phylogenetic group. If a child is exposed to a H3 strain, the child will respond well to H7 in future, as well as H3. Conversely, if a child is exposed to a H1 strain, the child will respond well to H5 in future as well as H1. Over the past decade, the age data from H5N1 and H7N9 attest to the principle of antigenic imprinting (Viboud and Epstein, Reference Viboud and Epstein2016).
There is now strong recent scientific evidence for the related principle of antigenic seniority (Reichert et al., Reference Reichert, Chowell, Nishiura, Christensen and McCullers2010) where the highest antibody response is against influenza virus strains from childhood (Ma et al., Reference Ma, Dushoff and Earn2011). The most recent pandemic in 2009 lends support to this principle. This principle is a development of the concept of “original antigenic sin” (Henry et al., Reference Henry2018). Seventy years ago, Thomas Francis, an American epidemiologist with a traditional Welsh Christian heritage, found that analysis of serum samples of influenza infections revealed minimal immunological responses against the current viral strain, but a response directed instead towards a strain previously encountered in children (Francis, Reference Francis1953).
3. 1918 Case fatality rate
The lethality of an influenza pandemic is measured by the case fatality rate: the proportion of infected who succumb to the virus and die. The pandemics of 1957, 1968 and 2009 had low case fatality rates of 0.13%, 0.1% and 0.05%. By contrast, the 1918 pandemic had a much higher case fatality rate of 2.5%. The difference has major implications for public health management and socio-economic disruption. If there is only one chance in a thousand of dying from infection, commuters on public transport may take the risk of catching flu on their journey to and from work, especially if their pay depends on their physical presence at their place of employment. However, if the risk is 25 times higher, commuters may decline to travel, or at least think twice, before taking the risk of infection on a crowded bus or train. This would have severe consequences for economic disruption and financial hardship, which could itself have major insurance implications.
A most remarkable aspect of the death toll from the 1918 pandemic was its intriguing age dependence. Counter-intuitively, since immune systems weaken with age, young adults were the most at risk. This is clearly illustrated in Figure 2, which presents the number of deaths by age recorded for September and October 1918 during the deadliest wave of the pandemic in Montreal and Toronto, Canada. The elevated number of deaths among young adults aged 20–40 in Montreal and Toronto is a very striking and anomalous feature of these plots (Gagnon et al., Reference Gagnon, Miller, Hallman, Bourbeau, Herring, Earn and Madrenas2013, Reference Gagnon, Acosta, Madrenas and Miller2015). The peak at age 28 corresponds to those who were a few months old at the time of the Russian influenza pandemic (1889–1890). This was one of the first epidemics to be tracked worldwide. From the Eurasian Steppes, it spread through Russia to Western Europe during the autumn of 1889, and arrived in ports on the North American Eastern seabord in late December 1889. By March 1890, it had spread to most of the North American continent. For the 1918 pandemic, the transmission path involved the Chinese Labour Corps, which arrived in Canada from Northern China, and were then transported by rail across Canada from Vancouver to Nova Scotia, before embarking for the Western Front (Humphries, Reference Humphries2013).
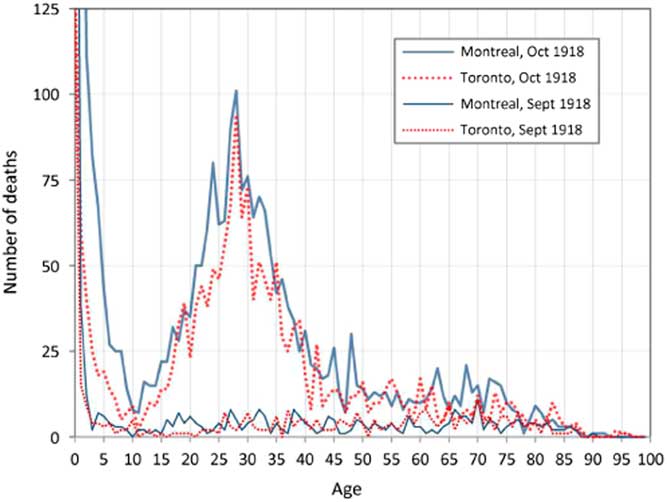
Figure 2 Recorded deaths by age in Montreal and Toronto in September and October 1918. Source: Gagnon et al. (Reference Gagnon, Miller, Hallman, Bourbeau, Herring, Earn and Madrenas2013)
The vulnerability of young adults is a universal phenomenon associated with the 1918 pandemic, and is also clearly identified in a study of mortality associated with the pandemic in France, Italy, Spain and Portugal by Erkoreka (Reference Erkoreka2010), who studied historical archives from these countries. In Paris, for example, there was a notable peak between 25 and 34.
Collection of anonymous mortality statistics at a national level hides the underlying tragedy of individual loss. Of the global cohort of 28-year olds whose birth date increased their chances of dying from the 1918 pandemic, perhaps the most famous today is the Viennese expressionist artist, Egon Schiele, who tragically died as one of the great young artistic talents, with his paintings destined to be displayed in art galleries around the world. To mark the centenary of his death, the Leopold Museum in Vienna held a jubilee exhibition in 2018, which includes this premonition of Schiele’s, written as a 20-year old: “I am human. I love death and I love life”. As the capital of the Austro-Hungarian empire, Vienna had a high population density, having attained its highest population of 2 million in 1910, which was similar to that of Berlin. As with all the main combatant nations of the Great War, a news blackout was maintained over influenza deaths in Austria and Germany. Apart from Egon Schiele and his wife, many other Viennese citizens must have died in the pandemic.
3.1 Pandemic experience in New York City
High population density increases the contagion during a pandemic. So important insight into a pandemic can be gleaned by studying its impact in a major international metropolis, such as New York City. Yang et al. (Reference Yang, Petkova and Shaman2013) have undertaken such a study, identifying four pandemic waves throughout the years 1918–1920. A total of 41,189 New Yorkers died due to the pandemic. This was about 0.7% of the population of somewhat less than six million. The mortality split between the four waves was: [1] 3,790 (9.2%); [2] 21,853 (53%); [3] 9,172 (22.3%); and [4] 6,374 (15.5%).
Most cohorts had two mortality peaks from September 1918 to March 1919. But some cohorts (e.g. the 28-year olds), experienced increased mortality throughout the whole period without a clear division between the second and third waves.
Yang et al. (Reference Yang, Petkova and Shaman2013) examined mortality patterns in detail by estimating, for each 1-year cohort, the fractional increase in excess mortality with respect to the baseline. Pandemic-related mortality was calculated by subtracting the median baseline mortality, which during the winter months included deaths from seasonal influenza. The authors recognise that this procedure may have underestimated the total mortality in the last two pandemic episodes, and might be amended by including excess seasonal influenza mortality.
Figure 3a shows the fractional total mortality increase for the second, third and fourth waves in New York City. The peak at around age 28 in the second wave is quite noticeable. Other age groups that experienced increased fractional mortality included teenagers, those in their early 30s and the late 30s. People in their 50s and over were largely unaffected.

Figure 3 Pandemic impact in New York City. Correlations of age-specific mortality patterns in the final three pandemic episodes. The lower plots compare mortality between the 2nd and 3rd waves, and the 3rd and 4th waves respectively. Source: Yang et al. (Reference Yang, Petkova and Shaman2013)
Figure 3b compares the fractional mortality increase in the second wave and the third wave. The highest figures in the top right-hand corner correspond to those in their late twenties. (The numbers on the plot are the 1-year age cohorts.) Similarly, Figure 3c compares the fractional mortality increase in the third wave and the fourth wave. The highest figures correspond to those in their 20s.
3.2 Reimagining the 1918 pandemic
The anomalously high death rate amongst young adults has been a puzzle for mortality researchers and life insurers alike. The immune system of the aged resembles that of the new-born. Both the very young and old immune systems are similarly compromised in coping with influenza. By contrast, the human immune response is fairly flat from late-teens to mid-60s (Simon et al., Reference Simon, Hollander and McMichael2015). The age-dependence of the immune system within an individual may be interpreted as reflecting the evolutionary importance of young and middle-aged adults in the procreation and survival of the human species.
The anomalously high death rate amongst young adults has been ascribed to the over-reaction of their immune response systems: a cytokine storm. But the immune response system of a 28-year old is not significantly different from that of an 18-year old, so there has to be another explanation. Some simple arithmetic provides a clue. Subtract 28 from 1918 and you get 1890. This was the year of the Russian Flu pandemic. In contrast with the H1N1 strain of 1918, the Russian Flu strain was H3N8. Virologists have discovered that childhood exposure to a previous influenza pandemic is imprinted on the immune system, and affects future response to a different pandemic strain. For those people who were young around the time of the Russian influenza pandemic of the winter of 1889–1890, childhood exposure to H3N8, rather than the H1N1 strain, would have dominated their antibody response. This early exposure would explain their much higher vulnerability to the H1N1 pandemic of 1918. They would have had much lower immunity against secondary infection with a wide range of bacterial pathogens such as cause most influenza-related mortality (Worobey et al., Reference Worobey, Han and Rambaut2014). Pandemic strains circulate as the primary seasonal flu for some years after a pandemic, so those born after a pandemic can still be exposed to the strain, as those born before.
Counterfactually, given the haphazard occurrence of pandemics, the Russian influenza pandemic might well have occurred some years earlier or later, in which case the age range of those most vulnerable to the H1N1 pandemic of 1918 would have shifted. The age range 20–40 of heightened vulnerability has not been observed in any influenza pandemic since 1918. This is because this age range is tied closely to the date of the earlier Russian influenza pandemic. If the Russian pandemic had struck a decade earlier, the vulnerable cohort would have been displaced to the age range 30–50 instead of 20–40. The 49-year-old Mahatma Gandhi might not then have survived his bout of pandemic influenza in India. As it was in 1918, Bombay was heavily struck by the pandemic, with the contagion aggravated by migrants from the countryside which had suffered crop failure.
Conversely, if the Russian pandemic had struck one decade later, at the turn of the 19th century, the vulnerable cohort would have been aged 10–30. Someone born in December 1901, who would then have been at special risk in 1918, was the 16-year-old Walt Disney. He caught the pandemic influenza in Chicago, but fortunately survived. But had his immune system been imprinted with H3N8, his creative cartoon genius might have been lost to future generations of children.
Reimagining pandemic history still further, the Russian H3N8 pandemic might never even have happened in the 19th century. It is not so unlikely that there might instead have been another H1 pandemic virus. The dominant influenza viruses in the 19th century before the Russian Flu were H1N1 (1830–1847) and H1N8 (1847–1889) (Worobey et al., Reference Worobey, Han and Rambaut2014). From this counterfactual perspective, the 1918 case fatality rate might be viewed as anomalously high.
If this switch in phylogenetic group had occurred earlier, it is conceivable that the vulnerable cohort with low immunity to H1N1 would have been very small, and the average case fatality rate from the H1N1 1918 pandemic might have been much less than 2.5%, and closer to the case fatality rates observed for the three pandemics since 1918.
The impact of an influenza pandemic virus depends significantly on the birth dates of the population at risk. An analogy with natural hazards is that the impact of an earthquake or windstorm on a city depends on the construction dates of the buildings. Changes in building codes from time to time alter the landscape of building vulnerability to external loads. A repeat of the great 1906 San Francisco earthquake can be simulated with exactly the same rupture of the San Andreas Fault. However, the building damage will be very different, because of the strengthening of the building codes during the 20th century. Similarly, the pandemic vulnerability of an individual depends not only on age but crucially also on birth date.
4. Birth year dependence of H5N1 and H7N9 avian flu cases
The 2009 influenza pandemic had a geographically wide dispersion after starting in Mexico, but a low case fatality rate of about 1 in 5,000 (0.02%), below that of the regular seasonal influenza outbreak. Over the past two decades, two avian influenza viruses, H5N1 and H7N9, have developed with high double-digit percentage lethality rates. Fortunately, neither is spread readily from person to person, so neither has developed into a pandemic. To understand the contagion process better, and to provide information to assist surveillance activities, Fouchier et al. (Reference Fouchier and Kawaoka2013) have conducted so-called gain-of-function research to attempt to develop more contagious versions of the H5N1 and H7N9 viruses through forced mutation in a laboratory. Fouchier’s strategy involved passing the influenza virus repeatedly from one laboratory ferret to another to force a viral mutation, so that infection could be transmitted via aerosol.
The number of cases of H5N1 and H7N9 reported globally since 1997 is sufficient to provide virologists with a database that allows for the study of birth year dependence of avian flu cases. The results are striking. Gostic et al. (Reference Gostic, Ambrose, Worobey and Lloyd-Smith2016) have examined the age patterns of human infections with H5N1 and H7N9, and found very interesting results. Whereas H5N1 cases are mainly in children and young adults, H7N9 cases are concentrated amongst older adults. This seemingly puzzling observation turns out to have a simple single explanation, based upon the last major pandemic, the H3N8 Hong Kong flu of 1968. This date marked the emergence of a new influenza virus in humans, and a shift in antigens from HA Group 1 (which includes H5N1) to HA Group 2 (which includes H7N9). Gostic et al. used historical influenza records to reconstruct the susceptibility of each birth cohort. This was based on the likelihood that their primary infection was with HA Group 1 or HA Group 2 influenza, which defined antigenic imprinting.
Those alive in 2018 who were born before 1968, are likely to have had their first influenza infection with a Group 1 virus, and appear protected against viruses in the same phylogenetic group, including H5N1. In contrast, those born after 1968 are likely to have had their first influenza infection with a Group 2 virus, and appear protected against viruses in Group 2, including H7N9. A growing body of epidemiological evidence indicates reduced risk of pandemic infection in those with previous seasonal exposure, and lifelong protection against viruses of different subtypes but within the same HA Group (Viboud and Epstein, Reference Viboud and Epstein2016). The specific imprinting mechanism is still being researched, but Gostic et al. (Reference Gostic, Ambrose, Worobey and Lloyd-Smith2016) favour the role of antiobodies directed towards the base of the HA protein, called the HA stem. This stem is shared within a phylogenetic group.
5. Modelling the age-dependence of pandemic risk in 2018
Traditional retrospective reviews of historical catastrophes have imagined what would happen if the event were to recur in our own time. Thus, on its 25th anniversary in 2017, the impact of a Hurricane like Andrew in August 1992 was modelled if it were to occur again. The same storm track and meteorological parameters may be assumed, but the windstorm vulnerability of buildings in 2017 was much different from 1992, because major changes in the wind loading building codes in Florida were enforced after the destruction caused by Hurricane Andrew in 1992.
In 2018, an influenza virus with the same degree of contagion and case fatality rate may be assumed as in 1918. Traditionally in pandemic influenza risk modelling, it has been customary to presume that the age-profile corresponding to a pandemic influenza virus with a high lethality rate would display the cytokine storm effect, and show that young adults with strong immune systems were especially vulnerable. This would be justifiable if age was a significant vulnerability factor – but not birth date. However, recent scientific research on influenza virology published only in the past several years shows that birth date is indeed significant.
RMS started its development of a pandemic influenza model for insurers in 2005, when the number of cases of H5N1 as reported by WHO doubled, and H5N1 began to pose a potential insurance accumulation risk. The RMS model incorporated three alternative age-profiles for an influenza pandemic. For a mild pandemic, the age-profile typical of regular seasonal influenza was taken. With seasonal influenza, the very young and the old are particularly vulnerable because of their physical frailty and fragile immune systems. For a severe pandemic, two alternative age-profiles were proposed. One recognised the implications of the cytokine storm effect, displaying higher vulnerability for young adults, as well as incorporating the seasonal influenza vulnerability of the very young and old. The alternative age-profile for a severe pandemic was a simple flat profile corresponding to similar vulnerability across all ages. This corresponded to an emerging novel virus, for which there was no previous immunity.
It is only with the gradual accumulation of data on H5N1 (and H7N9) in recent years that the diligent virological analysis of Gostic et al. (Reference Gostic, Ambrose, Worobey and Lloyd-Smith2016), and other medical scientists, has been extensive enough to exhibit empirically the principle of antigenic imprinting. Viboud and Epstein (Reference Viboud and Epstein2016) point out with due caution that basic science efforts are still needed to fully validate the antigenic imprinting hypothesis. But their scientific confidence is succinctly expressed in the self-explanatory title of their article: “First flu is forever”.
With the accumulation of published scientific evidence, the centenary year 2018, is the first year that antigenic imprinting could justifiably be introduced into pandemic risk modelling (Butler, Reference Butler2018). Indeed, in the abstract to their November 2016 paper, Gostic et al. (Reference Gostic, Ambrose, Worobey and Lloyd-Smith2016) state that their findings open new frontiers for rational pandemic risk assessment. By way of demonstration, they argue that their findings support the hypothesis that the unusually high mortality during the (Group 1) 1918 H1N1 pandemic may have arisen primarily from Group 2 antigenic imprinting in the cohort born between about 1880 and 1900. Consistent with antigenic imprinting, this same cohort was strongly impacted by the (Group 1) H2N2 Asian Flu pandemic of 1957, yet experienced no excess mortality when they were older and exposed to the (Group 2) H3N8 Hong Kong Flu.
In advance of further confirmatory scientific research, which would rely on the patient acquisition of additional severe influenza case data, pandemic risk modelling can already recognise and consolidate the existing progress by incorporating two alternative age-profiles for a severe pandemic which correspond to HA Group 1 and HA Group 2. Thanks to the shared immunity for influenza subtypes within these phylogenetic groups, there is no need to have separate age-profiles for all 16 different influenza HA subtypes.
The fact that the lethality age-profile of an individual is dependent on his or her childhood exposure rules out as scientifically baseless the option of having the same age-profile now as for a century ago. In particular, whereas young adults were especially at risk to H1N1 in 1918 because of their childhood exposure to H3N8, this is not the case in 2018. Similarly, those in their 50s now would have been exposed to the H3N2 Hong Kong pandemic influenza in childhood. Accordingly, the 2018 H3N2 Aussie flu has not been an immunological challenge as much as a different Group 1 influenza virus. However, for senior citizens over 65, Aussie flu has been a heightened risk, as shown in Australia.
Recent pathogen research helps to explain the age variability of the case fatality rate, and is encouraging for reducing pandemic mortality in the future. The regional variation in exposure to past influenza viruses is also diagnostic of future patterns of influenza susceptibility. This pathogen research is improving understanding of how previous exposure to influenza strains affects antibody response. This is crucial for the future development of a universal influenza vaccine. Such a vaccine works differently from a seasonal vaccine, which has to be remade each year based on a best guess of what type of influenza is likely to be circulating. A universal vaccine would target part of the virus that does not change each year, and so should work against human, bird and swine influenza. A question for further research is whether antigenic imprinting can be overcome by increasing the antigen amount in a vaccine. If this can be demonstrated, this would benefit those whose early childhood influenza infection was to a phylogenetic group different from what is particularly likely to occur in a future pandemic, or even epidemic.
Whilst the prospects for long-term influenza vaccine protection are bright, optimism about the current clinical trials of a universal influenza vaccine should be tempered by the increasing resistance to retroviral drugs (Hussain et al., Reference Hussain2017) and also by the persistent threat of antimicrobial resistance (AMR). Countries, like India, with a particularly high consumption of antibiotics, may be especially vulnerable to an emerging pandemic (Chaudhry and Tomar, Reference Chaudhry and Tomar2017).
An influenza virus can cause overwhelming inflammation in an infected person’s lungs that can lead to respiratory failure and death. Antigenic imprinting of immunity to the phylogenetic group of the threatening virus reduces the risk of direct death. However, an influenza virus can also increase susceptibility to other health problems. For example, older adults and people with chronic illnesses are more susceptible to bacteria that cause pneumonia. The avoidance of catastrophic numbers of secondary infection deaths in a future major influenza pandemic depends on solving the AMR challenge.
6. Lessons for health and life insurers
The recent scientific research findings are important for life and health insurers. Just from the date of birth of an insured, an insurer has knowledge of the influenza viruses against which immunity has progressively developed, most importantly possible childhood infections. For example, the cohort with childhood exposure to the H3N2 Hong Kong influenza pandemic of 1968, currently in their fifties, would be more vulnerable to H1N1 or H5N1 dominated epidemics, or others in the same phylogenetic Group 1. Geographical variations in exposure to the 1968 pandemic should impact on the immunity of current population, and should be explored.
No longer do health and life insurers have to worry over the accumulation risk of young adults falling seriously ill, or dying, in a future severe pandemic. Instead the worry shifts in age range according to the particular strain of pandemic influenza that strikes. Should the next pandemic influenza happen to be H1N1, as in 1918, or H5N1, then those insureds in their fifties who were exposed first to Hong Kong flu H3N2 would be especially vulnerable. Since this older cohort of insureds would tend to have larger valued insurance policies, the risk implications of an influenza pandemic are potentially significant.
There has not been a major influenza pandemic in a hundred years, and it has taken almost a century for the marked birth date dependence of influenza vulnerability to emerge from virological research. The evidence gleaned from the H5N1 and H7N9 outbreaks of the past several decades has been crucial in gaining scientific acceptance of the concept of antigenic imprinting. Hazard and vulnerability assessment are the twin pillars of catastrophe risk modelling. Antigenic imprinting constitutes an important milestone in scientific knowledge and understanding of pandemic vulnerability.
Societal preparedness for a pandemic influenza strain of the virulence of 1918 is greatly assisted by a better understanding of the age-profile of those particularly vulnerable. Insurers are important stakeholders in influenza pandemic risk, and need to incorporate this new improved scientific understanding into their risk management practices.
One relevant area of insurance coverage is long-term care. Actuaries need to calculate the extent to which pandemic risk offsets longevity risk. The new insights into the age-dependence of pandemic mortality should inform these actuarial calculations.
7. Mortality improvement fluctuations due to seasonal influenza
External hazards, such as wars, political and criminal violence, earthquakes, floods and infectious diseases, are sources of excess mortality that perturb mortality rates, and can upset trends in mortality improvement. These external perturbations are excluded from longevity models of mortality improvement that cover the health environment, medical intervention, regenerative medicine and anti-ageing (Woo et al., Reference Woo, Martin, Hornsby and Coburn2010).
Unlike the other external hazards, there is a regular annual winter flu season, which leads to excess winter deaths. Understanding the natural variability in seasonal flu morbidity and mortality is important for benchmarking longevity models as each year passes. The coldness of the winter has some effect on the excess winter mortality, but the major driver is the strain of seasonal flu, its severity and the effectiveness of the flu vaccine.
The possibility of large swings in seasonal flu mortality from one year to the next is starkly illustrated by comparing the 2013–2014 season with the following 2014–2015 season. The 2013–2014 flu season was the first predominantly H1N1 season since the 2009 H1N1 pandemic. There was severe illness amongst young and middle-aged adults, but older people were not so badly affected. With the vaccine effectiveness being high, the number of UK excess deaths was kept low (see Figure 4).

Figure 4 Excess winter mortality in England and Wales. Source: Office for National Statistics
By contrast, in the 2014–2015 season, H3N2 was the predominant flu virus and the vaccine was relatively ineffective due to genetic drift of the virus. Accordingly, given their enhanced vulnerability, there were large numbers of excess deaths amongst older people. An additional 28,189 people died in 2015 compared with 2014, the largest percentage increase since the pandemic year of 1968, according to the Office for National Statistics (2016). The majority (24,201) of the excess deaths were people aged 75 and over, many of whom died from flu or dementia. Office for National Statistics report that there was also a rise in the number of people whose death certificate stated the underlying cause to be dementia or Alzheimer’s, accounting for 41% of extra deaths among over-75s, although 1/3 of these also had a respiratory disease, such as flu.
Over a decade of longevity risk modelling, one of the major disappointments for all healthcare stakeholders has been the failure of a multiplicity of Alzheimer’s drug initiatives. The increased frailty of Alzheimer’s patients makes them more vulnerable to other illnesses such as flu. Development of a successful universal flu vaccine, coupled with progress in treating Alzheimer’s, would contribute much to future mortality improvement for the elderly.
8. Glossary
Antigenic seniority is the phenomenon whereby the human immune system responds most strongly to the variant of flu experienced in early childhood.
Antigenic imprinting is an extension of the concept of antigenic seniority to include variants of flu in the same phylogenetic group.
Cytokines are molecules that aid cell-to-cell communication in immune responses, and stimulate the movement of cells towards sites of infection.
Hemagglutinin is a protein found on the surface of an influenza virus that is responsible for binding the virus to the cell that is being infected.
Neuraminidase is a protein predominantly involved in facilitating the release of newly produced virus particles from the host cell.
Phylogeny is the history of the evolution of a group of organisms.
Reproductive number is the average number of infections generated by one infection.
Acknowledgements
The author wishes to thank Dr Victoria Bruce for helpful discussions.


 Open access