


As the baby boom cohort moves from its prime working years into retirement, a rising fraction of retirement-age households has substantial accumulations in defined contribution (DC) pension plans. Researchers and practitioners are increasingly interested in the retirement draw-down phase during which households must decide how to convert DC account assets into income and how to insure against longevity risk. The demand for life-contingent annuities attracts special attention because although these products play a central role in many models of optimal retiree behavior, the market for life annuities in the United States is small. LIMRA (2019) reported about $234 billion in total annuity sales in 2018 but only about $9.7 billion in immediate annuity sales.
DC plan participants typically have discretion about their retirement payout strategy. For many retirees, the process of withdrawing funds from their DC plans includes a sequence of decisions spread across many years rather than a single decision at the time of retirement. Depending on their plan's income options, retirees can select from a range of strategies, including withdrawing the funds in a lump-sum, requesting a set of structured periodic distributions, using the funds to purchase a life-contingent annuity, or deferring withdrawal of the funds until they are required to do so by federal income tax provisions (see U.S. Internal Revenue Service (2019)) known as required minimum distribution (RMD) rules. Although withdrawal options vary across plans, few DC plans in the for-profit sector offer an in-plan life-annuity option. Vanguard (2020), for example, reported that only 13% of the DC plans it administered, covering 14% of its plan participants, provided participants with an annuity option at retirement. The lack of direct plan access to guaranteed income requires retirees seeking such protection to withdraw funds and purchase an annuity in the retail market where prices tend to be less favorable. This makes it difficult to compare annuity demand with other types of retirement income strategies.
Unlike most 401(k) saving programs offered by for-profit employers, the TIAA system, launched in 1918, is a mature DC system. It serves the employees of colleges, universities, and other not-for-profit entities, and provides all participants with a large set of distribution options, including life annuities. It provides a rich opportunity to study the draw-down behavior of individuals in DC plans. Many TIAA participants have contributed to the system for most of their careers, making the balances at retirement a larger component of their wealth than the accumulations at many corporate 401(k) plans. For many participants, the TIAA balance is the primary source of retirement income. Prior to 1989, most retirees in this system were required to purchase a life annuity. From 1989 onward, participants have had many more choices, which today include the ability to take lump-sum distributions, systematic withdrawals, non-life guaranteed income, or RMD options. Administrative data on distribution choices make it possible to study not only the amount withdrawn from DC plan accounts, but also the form of such withdrawals. Most other sources of similarly high-quality information on distribution amounts, such as tax returns, lack this granular detail on payout structure. In Section 2, we will highlight the strengths and the limitations of these data in more detail.
In part because of the historically high annuitization rate among TIAA participants, the payout decisions of this population have attracted prior research attention. King (Reference King1996) presented information on the choice between single- and joint-life annuities during the mandatory annuitization era. He reported that the share of male retirees selecting a one-life annuity declined from 44% in 1978 to 26% in 1994, with the largest drop taking place after the Retirement Equity Act of 1984 required married retirees to take a joint-life annuity unless their spouse signed a waiver. Ameriks (Reference Ameriks1999, Reference Ameriks2002) updated these findings and reported growing interest in non-annuity options as the menu of distribution options expanded, with a substantial number of participants deferring distributions until they were required to do so by RMD rules.
Some of the data we report can be combined with information in these prior studies to create longer time series on distribution trends. However, our analysis differs from past work in two important ways. First, we include all non-life contingent guaranteed income options in our analysis because, unlike the previous studies, we can distinguish retirees taking income distributions from those making asset transfers using various non-annuitized distribution options. Second, we analyze both initial income choices and total income distributions, noting that in some cases participants select multiple payout options and that their first income choice may not align with their later choices.
Using administrative data from TIAA, we analyze trends in retirement ages, initial income distribution choices, and total income distributions. Because we do not have direct observations on labor market activity, we label any participant over the age of 59½ who stops contributing to the TIAA system as a retiree, although we discuss why this definition understates the average retirement age.
The estimated number of retirees rises from 19,000 in 2000 to more than 54,000 in 2018, a period when the distribution of retirement ages also shifted to older ages. Between 2000 and 2018, the average age of retirement increased by 2.0 years for men and 1.2 years for women.
Examining trends in initial income choices, we find a dramatic change in the mix of withdrawal options selected over this period. The fraction of TIAA participants who selected an annuity when they began drawing down their account declined from 61% in 2000 to only 18% in 2018. Over the same period, there was a marked increase – from 10% to 52% – in the fraction of first-time income recipients whose initial draw was an RMD. The proportion of retirees choosing systematic withdrawals as first income also increased, rising from 6% to 18%. The fraction choosing initial income in the form of non-life guaranteed income fluctuated between 20% and 30% over the study period. Among retirees who made an initial income selection before age 70, the fraction choosing a single-life annuity declined from 31% to 19% between 2000 and 2018, while the fraction choosing a joint-life annuity dropped from 36% to 19%. Among those who did not draw any retirement income until they were at least 70 years old, 52% in 2000 and 85% in 2018 used an RMD for their initial income draw. The share of this older group selecting a life annuity for its first income draw fell from 41% to about 6% over the same period. Our analysis focuses on participant decisions to initiate an income withdrawal, and in most of our analysis, this excludes one-time cash withdrawals because they are not contractual.
Besides initial income choices, we also consider total system income distributions because many participants – approximately 22% of income recipients in 2018 – receive more than one type of payout from their account. About 31% of income recipients in 2018 had a life annuity as a component of their retirement income distribution. Nearly half of those annuitants also took an RMD. Even with the decline in annuitization among new income recipients, when we aggregate over all TIAA income beneficiaries in each year, annuities were the most common type of payout in every year in our sample, although RMDs and annuities were nearly equal in 2018. The aggregation of all income beneficiaries includes some participants who have been receiving income for several decades.
This paper is divided into eight sections. The first describes the payout options available to TIAA participants and how these changed over time. Section 2 describes the administrative data that underlie the analysis, explains how the sample is constructed, and analyzes the distribution choices of the aggregate beneficiary pool over the 2000–2018 period. The next two sections summarize age-specific retirement rates for TIAA participants and the distribution of the elapsed time between retirement and the start of income draws. Section 5 tracks the changing mix over time of initial income choices among retirees and also considers one-time cash withdrawals, while Section 6 reports on the prevalence of multiple types of income draws. Section 7 supplements the analysis of administrative data by reporting the results of a brief survey, sent to several thousand individuals in the data sample, that investigates the accuracy of our retirement imputations and inquires about income support in early post-retirement years. The final section concludes.
1. How can participants withdraw assets from TIAA?
The set of payout choices available to TIAA participants has expanded over time. This section describes these choices and chronicles the evolution of the distribution menu.
Life annuities, which have been available to TIAA participants since the system launched in 1918, provide income for the remaining life of the participating annuitant, or annuitants if a two-life annuity is selected. Until 1988, a life annuity was the only option available to TIAA participants taking retirement income. An annuity is an irrevocable contract between TIAA and the annuitant(s) and is the only income option that provides insurance against the risk that the annuitant(s) may live longer than their assets would otherwise support. A participant may choose this income option at any age up until age 90. Selecting a life annuity requires making a number of choices, including between a fixed annuity (TIAA Traditional or TIAA Stable Value) or a variable annuity (CREF) and between single (participant only) or joint (participant and spouse/partner) life coverage. Additionally, a participant can specify a guaranteed period, with an associated reduction in the periodic annuity payment, to ensure that income payments to a designated beneficiary will continue for at least a minimum number of years even in the case of an early death of the annuitant(s).
Beginning in 1989, the distribution choice menu broadened to include alternative forms of guaranteed non-life annuity options and non-guaranteed income.Footnote 1 An annuity certain provides a participant with a guaranteed stream of payments for a fixed period, such as 10 or 20 years. Although labeled an annuity, the payouts associated with this option do not depend on the mortality experience of the participant or any other beneficiaries. A participant can begin an annuity certain at any age but may face tax penalties for distributions taken before age 59½.
A transfer payout annuity (TPA) is similar to an annuity certain, providing a sequence of payments from a TIAA Traditional account spread over a period of 7–10 years, which can be taken either as income or as an asset transfer to another investment. A participant can begin a TPA at any age, but again, income distributions taken before 59½ may be subject to an early distribution tax penalty. Our analysis excludes TPAs that represent asset transfers and includes only TPAs that involve an income payout.
The interest payment retirement option (IPRO), introduced in 1991, can be used by individuals who do not yet want to purchase an annuity but wish to begin receiving systematic income payments from accumulated assets in their TIAA Traditional Annuity. The monthly interest credited to the TIAA Traditional Annuity accumulations is distributed to the participant as an income payment, while the principal balance of the accumulation remains undistributed and must later be annuitized or converted into RMDs. A participant must begin an IPRO before the age of 69½.
Beginning in 1991, TIAA began offering non-guaranteed income options to its participants. The most commonly used option is the RMD,Footnote 2 which provides retirees over the age of 70½ with an amount of income just sufficient to avoid penalties that the federal government assesses on those who have assets accumulated in tax-deferred retirement accounts. The RMD is required if the participant's other income draws fall short of the IRS requirement.Footnote 3 The impact of RMD rules has begun to attract research attention. Horneff et al. (Reference Horneff, Maurer and Mitchell2021) use a lifecycle model to study how RMD requirements could affect DC plan withdrawals and consumption. Brown et al. (Reference Brown, Poterba and Richardson2017) and Mortenson et al. (Reference Mortenson, Schramm and Whitten2019) studied the impact of an RMD holiday in 2010, finding that many taxpayers continued to take RMDs even though they did not have to.
Systematic withdrawals and transfers (SWATs) have been available to participants since 1996. Participants using a SWAT contract specify a desired schedule of payments, and regular withdrawals or transfers are made from their account according to the schedule. Payments can be stopped or changed at any time, which makes this a very flexible distribution option, but will otherwise be made as long as there are assets left to fund them. Participants can begin SWAT payments at any age, but may be subject to early withdrawal penalties. Following our treatment of TPAs, we only include SWAT payments taken as income.
Finally, cash payouts, taken as lump-sum distributions, have been available to participants since 1991. We include cash payouts that represent taxable distributions in our analysis but exclude asset transfers that are rollovers to other asset managers. We distinguish between the two, as with TPAs and SWATs, using information on the distribution's tax status, which is captured on the IRS Form 1099. Participants may take cash payouts at any time; they may be subject to early distribution tax penalties if their age is below 59½ years.
Table 1 summarizes the features of the various income distribution options. Each year, a participant who has not previously annuitized his or her entire balance at TIAA can choose to annuitize, to elect a non-annuity payout plan, or to take only whatever distribution is required – possibly zero – and to postpone further draw-down decisions for another year. This delay option is exercised by many participants. The gap between our estimate of the participant's retirement date and the start of income payouts is often several years.Footnote 4 Only about half of the new retirees in our sample start taking income in the year they retire, so focusing only on participant choices at the time of retirement may provide an incomplete or even misleading perspective on retirement distribution behavior.
Table 1. Features of income distribution options

2. Data on income choices of TIAA participants
TIAA participants include a diverse population that works primarily in the non-profit sector, including universities, non-profit museums, hospitals, think tanks, and some K-12 schools. The employers who choose TIAA as a retirement plan service provider range from very small non-profit institutions to very large university employers. At some institutions, TIAA is either the sole provider, or one of the providers, of employees' primary retirement plan. At others, it provides a supplemental retirement plan. Participation in primary plans is often mandatory; participation in supplemental plans is almost always voluntary. The TIAA administrative records we use in this paper include tenure in the TIAA system, contributions, asset allocations, income distributions, plan contract information, and limited demographic information.Footnote 5 We do not observe wealth outside of the TIAA system, nor, as we will discuss below, do we observe employment records.
The rich administrative data that forms the basis for this project has several strengths, the most notable being our ability to see all TIAA payout choices over time for a very large number of participants. The data also have several limitations. First, it contains very limited demographic information beyond age and sex. For example, we do not have information on marital status or level of education.
Second, the data are drawn from a single financial institution, so it is not possible to measure a participant's net worth or the value of retirement accounts held outside of TIAA. The lack of information on assets held at other financial institutions raises challenges for measuring payout strategies: a participant might pursue one payout strategy with her TIAA accumulation and another with an accumulation at another firm. This limitation also means that there is no information on the payout decisions of participants who withdraw their assets from the TIAA system and make retirement income decisions at another financial institution.
Third, the TIAA population, although quite diverse, is not representative of the broader DC plan participant population, as described for example in Brady and Bass (Reference Brady and Bass2019). For example, although we do not have data on education, the fact that most TIAA participants work in higher education likely means that the average level of education is higher than the general population. In addition, the historical way in which TIAA products were delivered, including on-campus corporate representatives on many large campuses, may have resulted in greater understanding and utilization of annuities among TIAA participants than among most other DC plans. Thus, although this analysis is informative of how individuals behave when faced with a rich set of distribution options, one should exercise caution in generalizing these results to the full U.S. population.
With these caveats in mind, we now turn to our first look at the data. Figure 1 plots the share of all TIAA income recipients in each year between 2008 and 2018 who receive various types of payouts. Note that many of these individuals may have retired before the start of the sample period, and thus this figure represents repeated cross-sections of payouts by year, rather than the payouts selected by new retirees in that year. We will explore choices by those making payout choices within a year below. Also note that because income recipients can receive more than one type of distribution, the percentages by year add up to more than 100%. The most striking trend is the decline in the share receiving annuity payouts, which fell from 52% in 2008 to 30.5% in 2018, and the corresponding increase in the share receiving RMDs, which rose from 16% to 29% over the same period. The decline in the share of all income beneficiaries with an annuity suggests that the fraction of new income beneficiaries choosing annuities has declined over time. The fraction of participants receiving non-life guaranteed income (annuity certain, TPA, and IPRO) or taking systematic withdrawals (SWATs) was relatively stable. The proportion taking lump-sum cash withdrawals rose from 22% in 2008 to 35% in 2013; it has declined since then. Although the share of all income beneficiaries drawing income from a life annuity has declined, annuities were the most popular form of retirement income over the sample. In 2018, the number of annuitants was roughly equal to the number drawing lump-sum cash payouts.

Figure 1. Percentage of TIAA income recipients receiving each type of distribution.
Source: Authors' calculations.
Table 2 summarizes the evolution of the income beneficiary population at TIAA. The first column shows the number of participants in the TIAA system. Participants include those who are currently contributing, those who are no longer contributing but have positive account balances, and non-contributing beneficiaries (typically surviving spouses) who are receiving payouts, a group that is almost equally divided between men and women. The second and third columns show the number and percentage of participants drawing income. About one participant in five was drawing income in 2018; this share rises over the 11-year period as the participant population ages. The last column reports an estimate of the number of income beneficiaries who stopped contributing to their TIAA plans in each year since 2000. Comparing columns 2 and 4 underscores two things: the long length of payout periods, and the pattern in recent years for many participants never to draw income. In 2018, post-2000 retirees comprised of only about one-third of those receiving income, a result of both the large stock of pre-2000 retirees and the substantial number of post-2000 retirees who had not started to draw income.
Table 2. TIAA participants and income beneficiaries, 2008–2018

Source: Authors' calculations.
The declining role of annuities evident in Figure 1 and Table 2 reflects two factors. First, as noted above, institutional payout options have broadened over time. Because the population includes individuals who may have retired decades earlier, this may reflect that earlier cohorts had fewer choices. Second, we are most interested in how the payout decisions of new retirees have changed over time. To study this, we would ideally observe retirement dates and examine how behavior changes across different retiree cohorts. A limitation of the TIAA data, however, is that it does not include any data on self-reported or administrative retirement dates.
In light of this data limitation, we focus on the individuals who are over 59½ and who make contributions to TIAA in one year but not the next. For ease of exposition, we will refer to these individuals as ‘retirees’ in the rest of this paper, but we emphasize that we are measuring the cessation of TIAA contributions rather than retirement per se. The primary way in which these measures differ is that some individuals may continue to work even after stopping TIAA contributions. There are several ways this could occur. For example, if the TIAA plan was a voluntary supplemental plan, an individual over 59½ might simply stop contributing even though they continued to work. Alternatively, a university might offer more than one 403(b) vendor, and an individual could have switched from contributing to TIAA to contributing to a different financial provider. Finally, the individual may have left a university with TIAA as its retirement plan provider and moved to a university or another employer that does not offer TIAA products. Ameriks et al. (Reference Ameriks, Briggs, Caplin, Lee, Shapiro and Tonetti2018) present evidence on the role of such “bridge jobs” between career employment and full retirement for a sample of Vanguard participants.
In Section 7, we report results of a survey that we ran among a subset of this group. We found that for about two-thirds of the sample, being at least age 59½ and stopping TIAA contributions is an accurate measure of their self-reported retirement date. For a minority of the sample, however, individuals continue to have some form of labor force attachment. Thus, we stress that our measure of retirement will have a lower average retirement age than one based on actual labor force attachment.
Table 3 presents summary information on the new retiree sample that is the basis for the rest of our analysis. The first column shows the number of TIAA participants in each year, and the second, the number of those participants who are over the age of 59½. In 2018, 1.56 million of the 4.27 million participants were at least 59½. During our sample period, the age distribution of the TIAA participant population shifted toward older ages.
Table 3. Description of TIAA participant and ‘new retiree’ samples

Source: Authors' calculations.
The third column reports the number of new retirees in each year, i.e., the number of participants who are more than 59½ years old, stopped making contributions to TIAA in that year, and did not make any subsequent contributions. The final column reports the percentage of individuals who retired in each year who had received some income payouts from TIAA by the 2018 plan year. It is possible, but unusual, for a participant who turned 59½ after 2000 to have started receiving income prior to the date of retirement. Only 0.8% of all retirees fall into this category.
The last column of Table 3 shows that nearly half of all post-2000 retirees had started an income draw by 2018. This percentage rises in the number of years a person has been retired. It increases from under 35% for 2018 retirees to more than 65% for those who retired in 2000. Importantly, the percentage of participants who ever take an income draw asymptotes to a level below 70%, a reminder that some TIAA participants never withdraw funds in a way that generates retirement income.
The sample includes 660,357 participants who retired between 2000 and 2018. The number of participants grew at an average annual rate of 3.1%, while the number over 59½ grew at a 5.6% annual rate. The share of total participants over the age of 59½ grew from 24% in 2001 to 37% in 2018, highlighting the aging of the participant population. There are often several years between a participant's last contribution and first income draw. There are 327,996 participants in our sample who retired after 2000 and who began drawing income before 2018. Those who retire during our sample, but are never observed drawing income, might never have reached an action-forcing constraint, such as attaining the age at which RMD payments must begin, or they might have taken one or more cash withdrawals from their account. We do not classify lump-sum cash distributions as income payouts because these are unlikely to reflect ongoing retirement consumption needs. Instead, some of these lump-sum payments represent individuals who may have rolled their account balance out of TIAA and to an IRA at another financial institution.Footnote 6 Additionally, some of those who retired died before beginning income draws. Analyzing the choices of the last two groups is beyond the scope of this paper.
3. Rising retirement age of TIAA participants
Before studying the changing pattern of income draws, we consider the retirement behavior of TIAA participants who are at least 59½ years of age. As noted above, our definition of retirement is that the individual has ceased making contributions to a participant's TIAA retirement account. Figure 2 shows the distribution of retirement ages for TIAA participants in each year between 2000 and 2018. The number of retirees rises from less than 19,000 in 2000 to more than 54,000 in 2018, reflecting both the age structure of the U.S. population – those in the baby boom cohort are retiring at the end of the sample – and the particular age composition of the industry that TIAA serves. The median age of retirement rises from 64.3 in 2000 to 65.6 in 2018. The box plots for each year show the median age, the 25th and 75th percentiles, and the 5th and 95th percentiles of the retirement age distribution. The share of the TIAA participant population that is working well into their 70s has increased over time. In 2000, 10% of retirees were above the age of 70.4; by 2018, the 10th percentile had risen to 73.1 years. The 5th percentile value increased in tandem, from 73.0 in 2000 to 76.0 in 2018. In 2018, 25% of the retirees were older than 69.1 years; the comparable age in 2000 was 66.8 years.

Figure 2. Distribution of retirement ages, by year, for TIAA participants.
Source: Authors’ calculations.
Figure 3 compares the age distribution of retirements in 2000 with that in 2018. In 2000, there were two local maxima in the retirement age distribution, at 62 and 65. By 2018, the distribution had shifted well to the right; the local maxima at age 62 was only about two-thirds the size of its corresponding 2000 value, and the local peak at age 65 had been replaced by a smaller local peak at 66. This may reflect the shifting of the Social Security full retirement age from 65 to 66 over this period. The share of retirements taking place before age 66 declined between 2000 and 2018, while the share of retirements at ages above 66 increased.

Figure 3. Distribution of retirement ages for TIAA participants, 2000 and 2018.
Source: Authors’ calculations.
Given the limited demographic information available in our data, one might be concerned that the upward shift in retirement ages reflects changing demographics of our sample rather than an actual trend toward later retirement. For example, in 2000, 58.7% of new retirees were male. That percentage declined over the next two decades, reaching 44.6% in 2018. If men and women have different preferences for retirement income choices or for length of working life, the shifting composition of the retirement-age population could contribute to some of the differences in behavior over time that we report.Footnote 7
To begin exploring this, Figure 4 plots the average retirement age by year for men and women. Over the course of our sample, the average retirement age for women rose from 64.6 in 2000 to 65.8 in 2018, an increase of 1.2 years. For men, the rise is greater, from 65.3 in 2000 to 67.3 in 2018, an increase of 2.0 years. These patterns resemble those for the broader U.S. population, although the estimated average retirement ages for TIAA participants are higher than economy-wide averages. Munnell (Reference Munnell2017), for example, estimates average retirement ages of 62.3 for women and 64.6 for men in 2015 using Current Population Survey data.

Figure 4. Average age of retirement, by gender, 2000–2018.
Source: Authors' calculations.
In 2000, a male TIAA participant who, as he aged, faced the age-specific retirement probabilities for men in that year had a 19.8% probability of working until at least age 70. The analogous probability in 2018 was 25.2%. In some intervening years, the probability was even higher. In 2010, for example, in the immediate aftermath of the Great Recession and during a period of reduced DC balances, it was 30.3%.
4. Trends in the timing of income draws by TIAA retirees
The longitudinal nature of the TIAA data permits us to study the multi-period nature of the income draw decision. Figure 5 shows the distribution of dates at which income payouts began for all participants who retired between 2000 and 2018. The figure presents the median year in which income draws began, along with the 5th, 25th, 75th, and 95th percentiles. The median gap between a participant's last contribution, and that participant's first income draw, is between 1 and 2 years for all retirement cohorts. For those who retired around 2000, roughly three-quarters of each cohort initiates an income draw within 6 years of retirement. Five percent of the 2000 retirement cohort waited at least 11 years before drawing any income from their TIAA account.

Figure 5. Distribution of first income draw by retirement year.
Source: Authors' calculations.
Just over 13% of retirees draw income prior to the year that coincides with retirement. Pre-retirement income draws could be due to some individuals holding multiple retirement accounts, reflecting past employment at employers other than their current one. It would be possible to start distributions from other accounts while continuing to work at, and contribute to the retirement account at, the current employer. Roughly 28% begin income draws within the first 6 months after retirement, and by 4 years after retirement, about 43% have taken at least one income draw. A significant number of participants wait many years after retirement before drawing income. This raises the question of how these participants are supporting themselves, a subject we will address in Section 7 using a survey that we conducted among a subset of these participants.
Some participants we have labeled as retired and who are not drawing income are older than 70½, the age at which RMDs must begin. There are several explanations for why there may be no withdrawals from these accounts. One is that RMD rules do not require withdrawals from each 403(b) account, but rather specify a total amount that an individual must withdraw across all accounts. Participants who have multiple 403(b) accounts at multiple providers could meet their RMD requirements by taking distributions from a source other than TIAA. Another possibility is that these participants have stopped making contributions to their 403(b) plans, but are still employed at the sponsoring institution. Ongoing employment delays the effective RMD date. Our survey in Section 7 offers information on these alternative explanations.
The gap between retirement and the start of income distributions differs between participants who draw income in different ways and who retire at different ages. Figure 6 shows the cumulative distribution, for those who take a plan distribution during our sample, of the months between retirement and distribution for those who select life annuities, RMDs, SWATs, and other non-life guaranteed payouts. For those who select life annuities, more than 80% begin income draws within 6 months of retirement. For those who we observe drawing income with an RMD, even after 4 years, the probability of having started an income draw is less than 50%. SWAT and non-life guaranteed payout recipients are closer to life annuitants, but slower to begin drawing income after retirement.

Figure 6. Cumulative percentage of retirees taking first income draw, by income type and years since retirement, 2000–2016.
Source: Authors' calculations.
Banerjee (Reference Banerjee2013) reports that withdrawal behavior from IRAs is quite different for those aged 70 and under relative to those aged 70 and above. Inspired by this finding, Figure 7 divides our sample into those who retired before and after age 70. In our sample, 14.2% of all retirees left the labor market after age 70½. Another 8.7% retired between the ages of 68½ and 70½, within 2 years of the RMD requirement. The age pattern of retirements is very different, however, at the start and end of the sample. In 2000, 9.8% retired after 70½, and 7.7% more within 2 years of reaching that age. In 2018, however, 17.9% retired after age 70½, and 9.9% in the prior 2 years. The shift in the age distribution of retirees is a key factor explaining the observed change in retirement income draws.

Figure 7. Cumulative percentage of retirees taking first income draw, by age at retirement and years since retirement, 2000–2016.
Source: Authors' calculations.
There are two notable differences between the two groups of retirees. First, those who retire at older ages are more likely to have drawn income prior to retirement. More than 40% of the post-70 retiree group drew some income prior to retirement, and more than a quarter drew income more than a year before their 403(b) contributions ceased. Second, the gap between retirement and the onset of distributions for those who draw income through RMDs is much shorter for the over-70 than for the under-70 retirees. This is largely mechanical, reflecting the smaller window of time between retirement and the age at which RMDs must start for the latter group.
Figure 8 reports the distribution of ages at which participants began to draw income in both 2000 and 2018. In 2000, there were two peaks in the distribution, at ages 62 and 65 – the early and normal retirement ages for Social Security, respectively. The distribution in 2018 was single-peaked, with nearly one-quarter of those who initiated an income draw doing so at age 71. The share of participants beginning distributions before age 65 fell from 47.8% in 2000 to 13.3% in 2018, while the share who were above 70 rose from 18.7% to 61.2%.

Figure 8. Distribution of first income ages in 2000 and 2018.
Source: Authors’ calculations.
Most of the growth in income initiation since 2000 has been among those over 70. The number of under-70 new income recipients grew by a factor of 2.25 between 2000 and 2018, while the number of over-70 new recipients rose more than 15-fold.
5. The choice among initial income options by TIAA participants
We now consider trends in initial retirement income choice, especially between life annuities and other forms of income. Figure 9 summarizes the form in which retirees have chosen to take their first income draws over the sample period. This sample consists of all distributions that began after age 55 for participants who are 59½ or older during our sample period.Footnote 8 The figure shows that in 2000, just over a decade after the end of required annuitization, the majority of participants (52%) still took a first income draw in the form of a single- or joint-life annuity. By 2018, only 18% did.
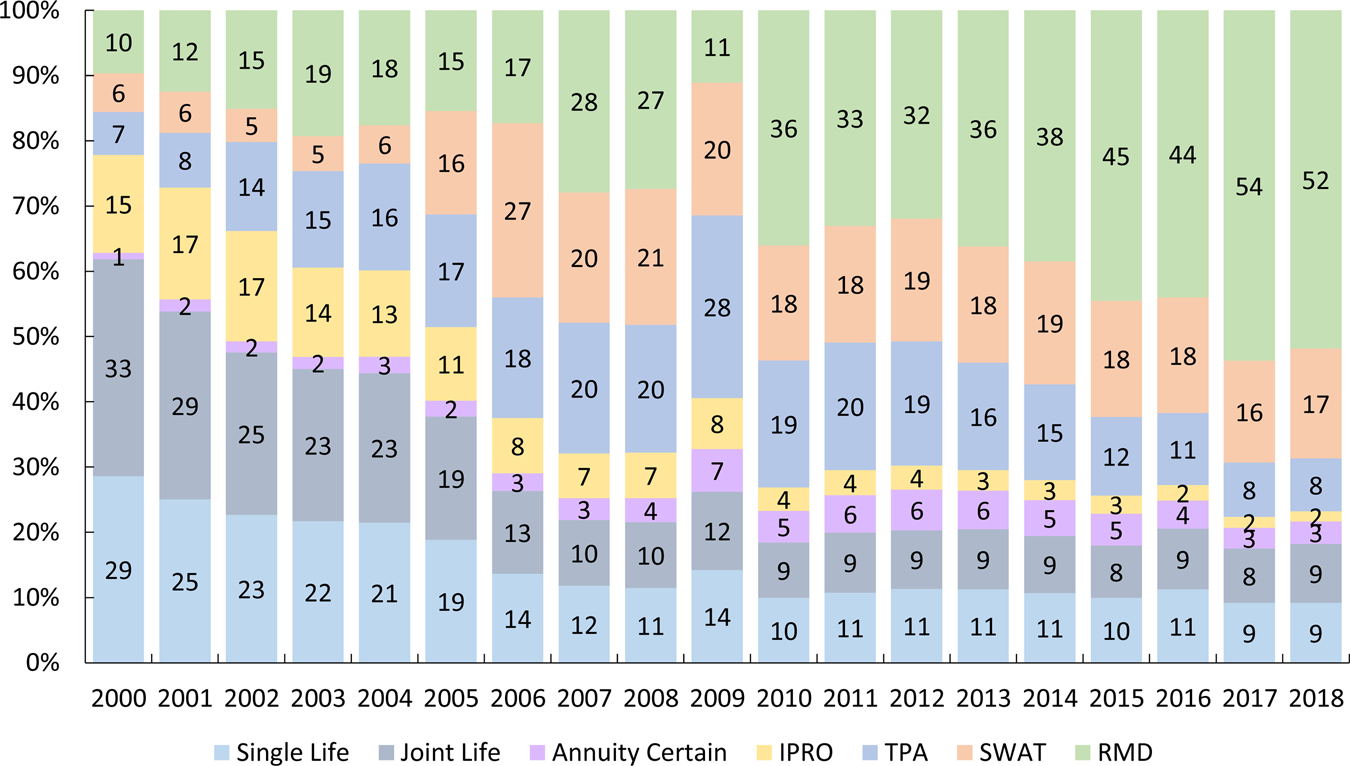
Figure 9. First income distribution, by type, 2000–2018.
Source: Authors' calculations.
As the proportion of retirees opting to start life annuities has declined, the utilization of RMDs has become more common. The RMD option was the initial choice of 10% of those who began distributions in 2000, but of 28% by 2007 and an even higher share after the Great Recession. Since the simplification of the RMD sign-up process in 2012, the use of RMDs has continued to grow, reaching 54% in 2017 and 52% in 2018. Minimum distribution options (MDOs) are now the most common way for TIAA retirees to begin withdrawing assets. Other payout options are used less often but have shifted in relative importance. Use of non-life guaranteed options (IPRO, TPA, and annuity certain options) peaked in the mid-2000s at around 30% but has declined since the Great Recession to about 13% in 2018. Similarly, the proportion of retirees taking first income as a systematic withdrawal (SWAT) peaked at 27% in 2006 and has declined to around 17% in 2018. The growing use of RMDs as an initial income choice has coincided with a decline in the use of all other forms of initial retirement income.
Calendar year 2009 stands out as anomalous in Figure 9. During the global financial crisis, the RMD requirements were suspended. Participants who reached the age at which such distributions usually begin could postpone them. Brown et al. (Reference Brown, Poterba and Richardson2017) and Mortenson et al. (Reference Mortenson, Schramm and Whitten2019) find that about one-third of households took advantage of the opportunity to delay RMDs. The distribution holiday resulted in a decline in the number of new RMD income draws.
A participant of a given age has access to some, but not all, distribution options. Those below 70½, for example, may not use the RMD payout option, and those over the age of 70 may not elect an IPRO. To account for these age constraints, we divide our retiree sample into those who are not yet 70, and those who are 70 and older. Figure 10 shows the selection of payout options by those who make their first income draw before they are subject to RMD requirements. Two-thirds of this group chose a life annuity as their first draw in 2000. The fraction of those making first income draws who chose a single-life annuity declined from 31% to 19% between 2000 and 2018, and the percentage choosing joint-life annuities dropped from 36% to 19%. Most of the decline for both annuity options took place before 2007, and coincided with rising utilization of non-life guaranteed income in the form of TPAs and IPROs. After 2010, take-up of non-life guaranteed income options declined modestly and was offset by the rise in the use of life annuities and systematic withdrawals.

Figure 10. First income distribution, by type, for retirees under age 70.
Source: Authors' calculations.
Figure 11 summarizes trends in first income draws by retirees aged 70 or older. For this group, which is subject to the RMD rules, annuitization falls from 41% in 2000 to only 5% in 2018. The use of RMDs grows from 52% to 85%. As for younger retirees taking income draws, the utilization of SWATs and non-life guaranteed income options peaks in the mid-2000s and then declines. The data show that a participant who does not take a first income draw before age 71 has a nearly 90% chance of taking an RMD as an initial income draw.

Figure 11. First income distribution, by type, retirees age 70 or older.
Source: Authors' calculations.
Women were more likely than men to choose a life annuity as a first income draw at the start of our sample, but the gender disparity faded over time. In 2000, 76% of women and 60% of men under the age of 70, and 49% of women and 36% of men over the age of 70, chose either a joint- or single-life annuity. By 2018, the under-70 proportions were 38% for both genders, and the over-70 proportions were 6%. While annuitization among both groups declined, the drop was somewhat larger for women in both age groups.
The shifting mix of men and women in the group of first-time income recipients has affected the relative demand for joint-life rather than single-life annuities. In 2000, for first-time income recipients under the age of 70, 32% of women selecting an annuity chose a joint-life product, compared with 75% of men. This disparity narrowed over time, to 37% and 66% in 2018, but when combined with the drop in the share of men in the new beneficiary pool, it has contributed to a fall in the share of first-time income recipients choosing joint-life products.
The shifting pattern of first income selections for the population of new TIAA retirees is partly due to shifts in the distribution of ages at which these draws occur, combined with persistent age-related differences in the nature of first income draws. Figure 12 illustrates this by showing the distribution of ages at which participants drew first income in each year of our sample. The data in the figure are related to information by King (Reference King1996) and Ameriks (Reference Ameriks2002), but those studies did not highlight the evolution from life annuities to other forms of first retirement income draws that began in the early 1990s. The blue line in Figure 12, with the legend on the right margin, plots retirees' average age at first income draw. This rises from 65.5 to 69.8 between 2000 and 2018. The bar charts in Figure 12 show that the proportion of retirees taking their first income after age 70 rose from 19% to 61%. The data in the two previous figures show that in 2018, the probability of choosing an annuity as first income draw is 38% for a participant who claims income before age 70, compared with 6% for those who start drawing income after age 70. A 10 percentage point increase in the share of participants claiming after age 70, holding these age-specific annuitization probabilities constant, would therefore translate into a 3 percentage point drop in the share of new claimants selecting an annuity.

Figure 12. Distribution of ages at first income draw, TIAA participants, 2000–2018.
Source: Authors' calculations.
The strong performance of equity markets over our sample period probably led some TIAA participants to reach retirement age with a larger-than-expected balance in their DC account. This could have affected distribution choices, for example if those with larger balances are less inclined to choose life annuities. Figures 13 and 14 present information from 2001 and 2018 on the choice of first income draw for participants grouped into deciles with regard to their account balances. For retirees who have not yet reached age 70, the data show higher rates of life annuitization in the middle of the participant balance distribution throughout the sample period. In 2001, for example, more than 35% of the first income draws for those in the third through eighth account balance deciles were life annuities. Even in the two highest deciles by participant balance, nearly 20% of retirees in 2001, and nearly 40% in 2018, selected a life annuity as their first income draw. At the other end of the account balance distribution, participants with small balances were relatively unlikely to receive income from life annuities, and tended to choose guaranteed payouts with no life contingency. This may reflect the small income stream that would be associated with choosing an annuity.

Figure 13. Type of first income distribution for retirees younger than age 70, by participant account balance decile.
Source: Authors’ calculations.

Figure 14. Type of first income distribution for retirees aged 70 and older, by participant account balance decile.
Source: Authors’ calculations.
Unlike retirees who are younger than 70, who show some variation in type of first income by account size, RMDs are the overwhelming type of first income across the account size distribution for those who retire after age 70. Figure 14 illustrates this. The figure shows that in 2018, over three-quarters of the retirees in this age group in all deciles of the account balance distribution chose an RMD as their first income draw. In 2001, RMDs were less prevalent than in 2018, and between 10% and 20% of retirees in all deciles chose SWATs. Nearly 20% of those in the middle of the participant balance distribution chose life annuities, and non-life guaranteed products were used by about one-quarter of the retirees in the lowest account balance deciles. This variation across deciles, along with the share of participants receiving income in any form other than an RMD, declined substantially between 2001 and 2018.
6. Multiple payout choices and total system income distributions
The foregoing analysis focused on retirees' first income choices. Nearly one-quarter of participants, however, draw multiple forms of income over the course of their retirement years. For example, a participant might choose a ‘partial annuitization’ strategy by purchasing a life annuity with half of his or her retirement assets and taking RMDs from the remaining balance. To gain insights into utilization of multiple payout streams, we examine the composition of retiree income sources in 2012 and 2018. This analysis, similar to the summary information in Figure 1, considers all income-receiving TIAA retirees in a given year rather than just first-time recipients in that year. We consider lump-sum cash distributions as well as the various income distributions described earlier because many retirees use such lump-sums to supplement their retirement income. It aggregates those who took first income draws in many different years.
In showing the share of retirees who receive various combinations of income draws, we focus our analysis on retirees who have one or two payout choices. Table 4 shows the number of retirees taking one or two different payouts in 2012 and 2018, respectively. In 2012, 191,348 retirees received income or took a cash distribution, of whom 96.68% (184,991) took one or two payout options. Comparable figures for 2018 show the significant growth of the retiree population, with 308,515 taking a payout and 96.16% (296,681) having two or fewer distribution sources. The main diagonals measure retirees who received only a single type of payout, and the off-diagonal cells measure combinations of two types of payouts. For both years, we highlight in bold the top three single payout choices, and in italics the top three combinations of distributions.
Table 4. Number of retirees taking one or two income types, 2012 and 2018

Notes. Of 191,348 retirees receiving income in 2012, 184,991 received one or two options (96.68%). Of 308,515 retirees receiving income in 2018, 296,681 received one or two options (96.16%).
Source: Authors’ calculations.
There are a number of similarities in payout behavior in 2012 and 2018. In both years, about 78% of retirees received only one income option. An RMD and a life annuity with a guarantee period were the most popular and next-most-popular choices. For those taking multiple draws, the combination of an RMD with a life annuity (either with or without a guarantee) was most frequent. In both years, the top three payout choices were an RMD, a life annuity with a guarantee period, and cash. In 2012 (2018), about 26.1% (41.4%) of retirees taking a distribution took an RMD, 24.1% (23.1%) received payouts from a life annuity with a guarantee period, and 26.5% (19.2%) received a cash distribution.
Table 4 shows that lump-sum cash distributions are common, but that their use declined between 2012 and 2018. In 2012, about 35% of retirees taking cash draws also received income payouts. This proportion increased to 45% in 2018. In both years, a common combination is an RMD and a cash payout – essentially a way of increasing the rate of payout beyond what the RMD rules specify. Another common pairing is an RMD and a life annuity. In 2012, about 13.4% of those who took an RMD also received a payout from a life annuity; in 2018, the comparable value was 10.1%.
Table 4 also shows the relative popularity of different types of annuity-based income. In both 2012 and 2018, there were significantly more participants drawing life annuities with guarantee periods (24.1% and 23.1% in 2012 and 2018, respectively) than life annuities without guarantees (7.3% and 6.5% in 2012 and 2018, respectively). In 2012, the proportion of retirees receiving distributions who were taking RMDs was about 26%, while 31% were taking some form of life annuity. By 2018, 41% of retirees were receiving an RMD, and 29% were receiving a life annuity. Similarly, the proportion of retirees taking cash payouts, systematic withdrawals, or non-life guaranteed income all declined relative to the RMD population.
7. Survey evidence on the absence of withdrawals for some ‘retirees’
The administrative data suggest that some TIAA participants do not begin income withdrawals for several years after their retirement plan contributions cease, a pattern that could be explained by a number of different factors. To explore this finding, we sent a short ten-question survey to 15,775 participants who stopped contributing to TIAA in 2013 or 2014. We asked if they could confirm the date of their last contribution and if they were now retired. If they were retired, and had taken any withdrawals from their TIAA accounts, we asked how they had supported themselves since retiring.
The survey was sent to participants via email in late November 2022. It resulted in 1,988 responses, a 12.6% reply rate. In total, 89% of respondents reported that our administrative record of their last TIAA contribution matches their recollection.
When asked ‘which statement best describes your current employment state?’, 82% indicated that they were retired and did not work. Fourteen percent indicated that they worked part-time, while only 4% reported full-time work. Of the 82% of respondents who classified themselves as retired, just over 13%, or 8.5% of the full sample, said that they retired between 2019 and 2022. Fifty-seven percent of those who reported themselves retired indicated that they had retired in 2013 or 2014, and another 9% indicated that they had retired earlier. In response to the question ‘Did you retire around the date of your last TIAA contribution?’, 70% of respondents indicated yes, 6% did not remember, and the remaining 24% said that they did not. These responses provide general support for our use of the cessation of plan contributions as an indicator of retirement, but they suggest that about one-third of those who stop contributing have some employment income, especially in the years immediately following the end of contributions.
Roughly one-quarter – 24% – of the respondents indicated that their retirement date did not coincide with their last contribution. When asked why not, 46% of this group indicated that they changed jobs to an employer who did not offer a TIAA plan, 25% said that they continued to work full time at the same employer but decided to stop contributing, and another 16% said that they shifted to part-time employment at the same institution and were no longer covered by their employer's retirement plan.
We also asked about the potential presence of a working spouse whose income could support post-retirement consumption for TIAA participants. In total, 71% of respondents reported living with a spouse or another partner, and only 16% of this group, 11% of the respondents, indicated that this person was employed. We did not collect information on the retirement date for the spouse or partner; since nearly two-thirds of the respondents retired 8 or 9 years ago. Some of them may have had working spouses at the time of their retirement, even though those were retired at the tiem of the survey.
The survey responses provide some information on the circumstances of the participants who have stopped contributing, but to directly understand how non-contributors who have not drawn any funds from their account are supporting themselves, we asked this question directly with a number of potential responses. Table 5 shows the results for those who did not take any withdrawals in the first year after they stopped contributing, and those who did not take any contributions before the end of our sample in 2018.
Table 5. Sources of support for living expenses in years after TIAA contributions cease

Note: Authors' tabulations from survey of TIAA participants who were no longer contributing to their retirement accounts but had not taken income from those accounts in the first year after contributions ceased, or in any year since contributions ceased. The survey is described in greater detail in the text.
Respondents could identify multiple sources of support, and the results suggest substantial use of a range of different sources. Social Security benefits were the most common income source cited by respondents, with more than three-quarters of those over 65, and more than half under 65, citing this income source. Whether participants who drew some support from Social Security were doing so despite the recommendation from many financial advisors that Social Security claiming should be delayed until age 70, cannot be determined from our survey. Income from a defined benefit plan, and from non-retirement savings, were the next-most common income sources. More than one in six indicated that they received income from a retirement account not at TIAA.
Taken together, the findings on the frequent delays between the end of contributions to TIAA retirement plans, and the many sources of income that participants rely on when not drawing down these assets, constitute an important reminder of the complexity of financial support for retirement and the many paths that households who are relatively well-prepared for retirement choose for reaching that goal.
8. Conclusion
This paper documents trends over the last two decades in TIAA participant retirement and retirement income choices. Because this is a mature DC retirement system, the choices made by its participants may provide important insights on the behavior of broader populations as the U.S. DC system becomes the centerpiece of retirement wealth for most workers. Banks et al. (Reference Banks, Crawford and Tetlow2015) make a similar argument in their study of annuity demand in the UK DC system.
Among the TIAA participants, between 2000 and 2018, the average retirement age rose by 1.2 years for women and 2.0 years for men. There is considerable variation in the length of time between retirement age and the start of an initial income draw from a participant's retirement account; only 40% of participants take a first income draw within 48 months of stopping plan contributions. The combination of longer working lives and delayed retirement income starts means that a growing fraction of TIAA participants do not take a first income draw until they are subject to RMD rules. The fraction of retirees taking no income until the RMD age of 70.5 rose from 10% in 2000 to 52% in 2018. Concurrently, the fraction of first-time retirement income claimants who selected a life-contingent annuitized payout stream declined from 61% to 18%. Among those who made an initial income selection before age 70, annuitization rates were significantly higher than among those who began income draws at an older age.
The sharp decline in the share of new income beneficiaries choosing a life annuity is gradually reducing the percentage of all TIAA beneficiaries with life annuities. It declined from 52% to 31% between 2008 and 2018. Despite the decline in new annuitants, in 2018 a life annuity was still the most common form of retirement income distribution for the TIAA beneficiary population. It was slightly more popular than an RMD, but likely to fall below the RMD option very soon.
During the closing years of our sample, the rising share of first income draws that began after age 70 indicate that the RMD was becoming the de facto default option for withdrawals by TIAA participants. This suggests that the effect of RMD rules on participant draw-down behavior, and potentially on their consumption spending – as studied by Horneff et al. (Reference Horneff, Maurer and Mitchell2021) – warrants further analysis. Throughout our sample, participants were required to begin RMDs in the year when they turned 70½. Legislation in both 2019 and 2022 has raised the RMD age, first to 72 in the Setting Every Community Up for Retirement Enhancement (SECURE) Act of 2019 and then further to age 73 beginning in 2023 and age 75 in 2033 in an omnibus spending bill in late 2022. The higher RMD age could affect the role of this payout strategy as a default for withdrawals, suggesting the value of ongoing monitoring of payout decisions.
Acknowledgments
We thank Brent Davis, Quentin Graham, and Tai Kam for outstanding research assistance, and Olivia S. Mitchell, Melinda Morrill, Alicia Munnell, and John Sabelhaus for helpful comments. Brown is a trustee of TIAA, Poterba is a trustee of CREF and the TIAA-CREF mutual funds, and Richardson is Managing Director and Head of Research for the TIAA Institute; TIAA is the retirement income provider that made data available for this project. The research reported in this paper was performed pursuant to grant RDR18000003 from the U.S. Social Security Administration (SSA), funded as part of the NBER Retirement and Disability Research Consortium. Opinions and conclusions expressed are solely those of the authors and do not represent the opinions or policy of any agency of the federal government, NBER, SSA, or TIAA. Neither the U.S. government nor any agency thereof, nor any of their employees, makes any warranty, express or implied, or assumes any legal liability or responsibility for the accuracy, completeness, or usefulness of the contents of this paper. Reference herein to any specific commercial product, process, or service by trade name, trademark, manufacturer, or otherwise does not necessarily constitute or imply endorsement, recommendation, or favoring by the U.S. government or any agency thereof.


 Open access