


Introduction
Spectral albedo is the ratio of the upwelling spectral irradiance reflected by the surface of snow and sea ice to the downwelling incident spectral irradiance at the surface. All-wave albedo is the integral of spectral albedo over the whole solar spectrum. It is a major variable controlling the energy budget of sea ice, and an important tuning parameter in modeling sea-ice-atmosphere interaction and global warming. Any reduction of the surface albedo means more absorption of solar radiation, which tends to increase the temperature at the surface. Absorption of shortwave radiation can result in internal melting and an increase of liquid-water content, changing the surface characteristics and internal structure of the snow cover (Reference Grenfell and MaykutGrenfell and Maykut, 1977). Accompanying the absorption of solar radiation is metamorphosis of snow crystals, which results in larger grain-size and a decrease in number density of the snow grains. All of these factors will contribute to the decrease of snow albedo.
The all-wave albedo of open ocean is much smaller than that of the snow and sea-ice cover. Approximately 85−95% of the incident solar radiation is absorbed by the open ocean, while 30−50% or less is absorbed by a snow and sea-ice cover (Reference Washington and ParkinsonWashington and Parkinson, 1986). Thus, during the summer season, a reduction of snow and sea-ice albedo due to snow metamorphosis and possible removal of the snow cover enhances the absorption of solar energy. This results in thinning and breaking-down of ice floes, and possible reduction of ice concentration and ice extent, which will further reduce the area-averaged albedo. On the other hand, an increase in surface albedo due to freezing means more solar energy is reflected back to the atmosphere, resulting in less input of energy into the sea ice or ocean. This results in a higher probability of more freezing of ocean water in polar regions, and an increase in the areal ice coverage and possibly snow and sea-ice thickness, which will produce a further increase in the area-averaged albedo. The positive feedback of the surface albedo to changes in atmospheric conditions makes the snow and sea ice in polar regions an important subject for weather prediction and global-warming studies.
In summer, the Arctic and the Antarctic have different patterns of sea-ice and snow decay (Reference Andreas and AckleyAndreas and Ackley 1982; Reference Fetterer and UntersteinerFetterer and Untersteiner, 1998). In the Arctic, melt ponds form as snow melts and meltwater accumulates on the ice surface. Decay of snow and ice is mainly from the top of the cover. In the Antarctic, melt ponds are rarely observed (Reference ArctowskiArctowski, 1908; Reference WordieWordie, 1921; Reference SpichkinSpichkin, 1967; Reference AckleyAckley, 1979), so the surface albedo of Antarctic sea ice is close to the typical albedo value of snow-covered ice all year around. Antarctic sea-ice albedo shows large variation due to the spatial complexity and variability of the surface even within the same region.
Although many albedo studies have been carried out in the Arctic (Reference HansonHanson, 1961; Reference Chernigovski, Fletcher, Keller and OlenicoffChernigovski, 1966; Reference LanglebenLangleben, 1969,Reference Langleben1971; Reference Grenfell and MaykutGrenfell and Maykut, 1977; Reference Grenfell and PerovichGrenfell and Perovich, 1984; Reference De Abreu, Barber, Misurak and LeDrewDe Abreu and others, 1995) and Antarctic (Reference LiljequistLiljequist, 1956; Reference HansonHanson, 1960; Reference HoinkesHoinkes, 1960; Reference WellerWeller, 1968; Reference Kuhn, Kundla, Stroschein and BusingerKuhn and others, 1977; Reference Carroll and FitchCarroll and Fitch, 1981; Reference YamanouchiYamanouchi, 1983; Reference Allison, Brandt and WarrenAllison and others, 1993; Reference Grenfell, Warren and MullenGrenfell and others, 1994), the data obtained are not sufficient for a global study. The processes affecting the snow surface albedo are still only qualitatively known, and the available albedo data on regional and temporal differences are too sparse to validate albedomodeling efforts (Reference Fetterer and UntersteinerFetterer and Untersteiner, 1998). Most of the albedo measurements in Antarctica are from continental sites. There are few datasets of all-wave and spectral albedos available for the Southern Ocean (e.g. Reference Allison, Brandt and WarrenAllison and others, 1993), and even fewer for the West Antarctic sea ice, including the pack ice in the Ross Sea. Consequently, an attempt was made to measure the albedo during a summer cruise on board the U. S. research vessel nathaniel b. palmer in the Ross Sea in January and February 1999. Other parameters such as snow surface temperature, snow depth and snow grain-size were also routinely measured. In addition, one or two snow pits were dug at each of the ice-floe stations, and precise measurements of snow depth, stratigraphy, density, grain-size and morphology, salinity and temperature were recorded (Reference Morris and JeffriesMorris and Jeffries, 2001).
Study Area, Instrumentation and Methods
Study area
The cruise route is shown in Figure 1. The sea-ice cover in the Ross Sea is primarily first-year pack ice. Sea ice and its snow cover were used as the primary platform for albedo measurements. Temporal variation of the all-wave albedo and spectral albedo was measured from the northern edge to the southern edge of the pack ice along three lines of longitude: 165° W, 150° Wand 135° W Albedo measurements were carried out on 24 first-year ice-floe stations and one land-fast ice site (station 9).
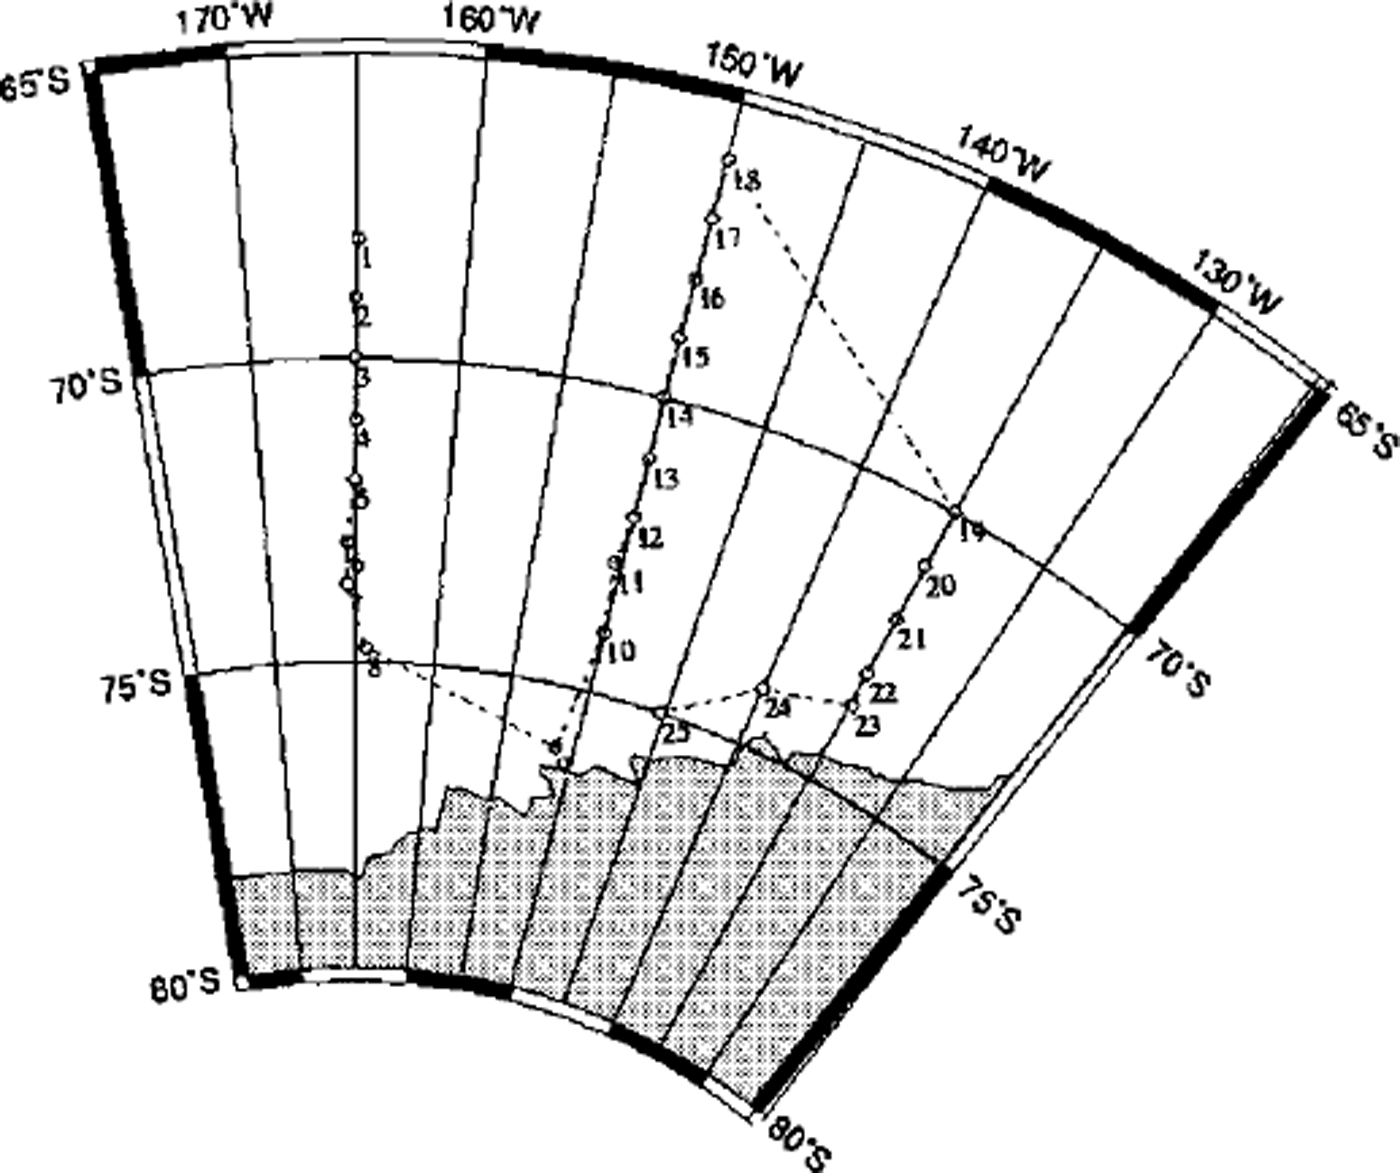
Fig. 1. The cruise track of r/ v Nathaniel B. Palmer and albedo station locations during a summer cruise in the ross sea (january and february 1999). see table 1 for corresponding days of year.
Instrumentation and methods
The all-wave albedo and spectral albedo data discussed in this paper include data for both cloudy and clear-sky conditions. Almost all the measurements were carried out under cloudy sky conditions: only two sets of albedo data were obtained under very clear-sky conditions (stations 5 and 9). Downwelling solar irradiance was measured together with the all-wave albedo. Most measurements of all-wave albedo and spectral albedo were carried out from 1000 to 1600 h local solar time when the solar zenith angle was smallest. This choice was optimal for the measured results since the uncertainties of both measurement and model calculation are minimized (Reference Schwander, Mayer, Ruggaber, Albold, Seckmeyer and KoepkeSchwander and others, 1999). As the all-wave albedo generally varies considerably with time, depending on the cloud conditions (see next subsection), the two computers used for spectral albedo and all-wave albedo measurements were synchronized daily with the well-calibrated GMT clock on the ship. Datasets were time-stamped so that comparisons between the all-wave albedo retrieved from the spectral albedo and the all-wave albedo measured directly were possible.
All-wave albedo
The total albedo (or all-wave albedo) was measured using two EPPLEY broadband, precision spectral pyranometers (PSPs) whose wavelength sensitivity was 200−4000 nm. The two pyranometers were installed in the middle of a slender 2.2 m long aluminum bar and suspended about 1.4 m above the snow surface. Ninety-nine per cent of the upwelling irradiance received by the downward-looking pyranometer was from a ground field of view (GFOV) of 20 m. The glass domes of the pyranometers were cleaned before each deployment. As the results from the pyranometers are sensitive to the level of the instruments, care was taken to keep both pyranometers level. One PSP measured the downwelling irradiance, and the other the upwelling reflected irradiance. The two pyranometers were simultaneously scanned every second, and the data saved at time intervals ranging from one second to several minutes, depending on the deployment period, using a CR10X datalogger. The save-time interval (STI) was generally 20−60s during our measurements, although a Is interval was sometimes used to study temporal variations of the all-wave albedo with high temporal resolution. The data stored were the average of the scans during the STI.
Time series of downwelling solar irradiance (f(t)) were derived from the upward-looking pyranometer by converting the direct readings of voltage to flux units (W m−2). Likewise, the upwelling irradiance (f↑(t)) was obtained from the readings of the downward-looking pyranometer, i.e.

where vd(t) and vu(t) are the time series of the readings in units of millivolts (mV) from the downward-looking and upward-looking pyranometers, respectively, and sd and su are the sensitivities in units of mV W −1 m2 of the downward-looking and upward-looking pyranometers, respectively Thus the time series of all-wave albedo (α(t)) were obtained from
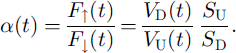
Table 1. All-wave albedo in eastern ross sea (albedo data in parentheses are for clear sky)
Spectral albedo
Spectral albedo in the visible/near-infrared (VNIR) region was measured using a high-spectral-resolution, fiber-optic spectroradiometer manufactured by Analytical Spectral Devices, Inc. (ASD). The sensor measures spectral reflectance and spectral radiance between 333.65 and 1064.9 nm in 512 channels, with a spectral resolution of 3 nm. The spectral albedo was measured using a flux sensor (or a remote cosine receptor (RGR) in the manufacturer’s terminology) connected to the spectroradiometer by a fiber-optic cable. The base of the RCR had two built-in bubbles for horizontal alignment of the receptor. The RCR was mounted at one end of a slim level bar (about 60 cm long), with the other end attached to a tripod so that the receptor was about 40 cm from the snow surface. However, for most of the measurements of upwelling irradiance, the bar was held by hand with the RCR about 30 cm above the snow surface. Care was taken to insure that the RCR remained level during measurements of downwelling irradiance or upwelling irradiance. The spectral noise values - the electronic noise level of each of the 512 silicon photodiode detectors of the spectroradiometer-were collected before the sensors were exposed to any illumination, and were automatically subtracted from the data during the measurement. The spectral albedo was acquired by measuring the downwelling irradiance, followed immediately by measuring the upwelling irradiance using the RCR. Datasets were recorded by a mini-computer that was attached to the spectroradiometer. To reduce system errors and errors caused by the fluctuations of the radiation field, several samples (each being the average of 10 scans) were collected for both upwelling and downwelling spectral irradiances.
For a Lambert surface, 99% of the upwelling irradiance that the cosine sensor receives comes from angles between 0° (nadir) and 82°, i.e. within a GFOV of 2.135−2.846 m radius for a height of 30−40 cm above the surface. As the RCR optic and level bar are small and the level bar was always pointed towards the solar azimuth under sunny conditions, shadowing effects should be negligible. For a height of 30−40 cm, 89.4−83.2% of the upwelling irradiance the RCR received was from the central part of the GFOV, with minimal shadowing effect from personnel. The shadowing effect due to personnel is estimated to be 1.1−1.8% under overcast sky conditions.
Snow surface temperature
As the top 5 cm of the snow largely determines the albedo (Reference Grenfell, Warren and MullenGrenfell and others, 1994), the skin temperature on the snow surface was measured using a non-destructive method, an Exergen Model D-501-RS Infrared Microscanner (Reference Li, Zhou and MorrisLi and others, 1999). To eliminate the effects of sky temperature and the surface emissivity on the temperature measurement, the head of the scanner was placed very near, but not touching, the surface to protect the sensor. This formed a black-body cavity between the snow surface and the surface of the microscanner, so that the measured temperature is the physical temperature of the skin of the snow surface. The microscanner is precise (±0.1 °C) and quick in acquiring skin-temperature data. Skin-temperature data discussed in this paper are exclusively from the microscanner.
Characteristics of Snow Surface on the Sea Ice
Pack ice in the Ross Sea is covered by snow all year around. Even in summer, new snow was observed to fall on top of the old snow, although it metamorphosed very quickly under solar irradiation. Icy layers, melt clusters and ice lenses were ubiquitous in the snow cover due to melt and refreeze cycles. During the 1999 summer cruise, 25 ice floes were extensively examined and more ice floes were checked visually from the ship’s bridge during the hourly ice observations: no melt ponds were observed. The conspicuous rotten edges of almost all of the ice floes indicate that the decay of the sea ice occurred at the bottom and lateral edges of the floes. Temporary wetting of the top snow layer was due to short periods of surface snow melting by solar heat, or by sea water splashed up onto the ice floe surface.
The snow surface temperature varied between −0.3° and −3.8°C, which is consistent with our observation that no slush or melt ponds were observed on the surface of any floe. The difference in surface temperature on a single ice floe was as much as 1.9°C on station 11 (15 January), and as little as 0.5°C on station 7 (10 January). Snow surface temperatures seemed to be primarily affected by the air temperature (Reference Li, Zhou and MorrisLi and others, 1999), with no observed correlation between snow depth and snow surface temperature.
Results of All-Wave Albedo Measurements
Spatial variation
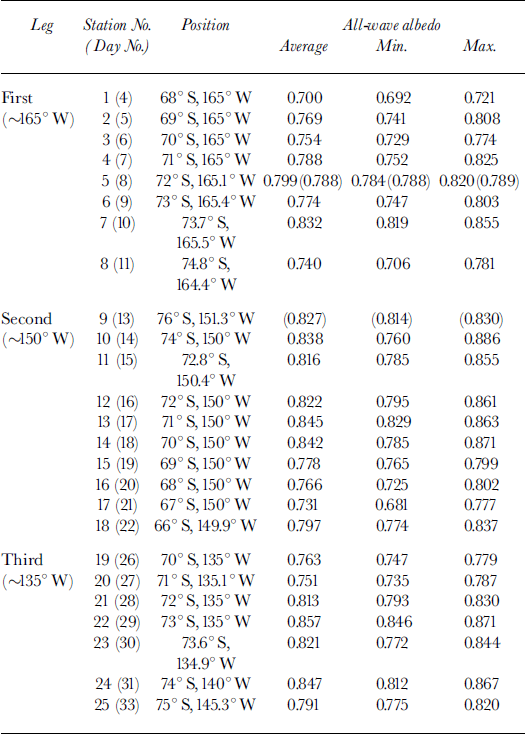
Daily-averaged albedos at all the stations are shown in Figure 2a. The average skin temperature of the snow surface on each floe is shown in Figure 2b. The three sections enclosed by dashed lines correspond to the three legs of the cruise (Fig. 1). The stations at the ends of each leg (stations 1, 8; 9,18; 19, 25) were at the margins of the pack ice. Albedos at the margins of the pack ice were lower than those in the central pack ice.
Fig. 2. Daily-averaged all-wave albedo (a) and area-averaged snow surface temperature (b) vs time and latitude.
The daily-averaged albedos, the Julian dates and the positions at which they were acquired together with the variation range are summarized in Table 1. Because clouds deplete the longer wavelengths, the spectral distribution of downwelling irradiance is altered such that snow albedo is generally greater under overcast than under clear sky (Reference Grenfell and MaykutGrenfell and Maykut, 1977). Variations in cloud conditions can also affect overcast albedos. From the albedo values shown in Table 1, we can see that daily-averaged albedos were 0.700−0.857, depending on the snow surface conditions and cloud conditions. The highest value was obtained at station 22 (29 January) on an ice floe where there was a surface layer of about 0.6 cm of recent snow, with an average grain diameter of about 0.2 mm. The lowest value was obtained at station 1 (4 January) on a relatively small ice floe (about 20 m in diameter) at the northern edge of the pack ice. The range in albedo for the pack ice in this region was similar to that obtained from the first-year sea ice in East Antarctica (0.65−0.85) (Reference Allison, Brandt and WarrenAllison and others, 1993).
The relationships between latitude and albedo and between latitude and snow surface temperature of ice floes in the central pack under cloudy skies are shown in Figure 3: data from the most southerly and northerly ice stations (stations 1,8; 9,18; 19, 25) along each of the three legs, and data taken under clear-sky conditions (station 10) are excluded. Measurements at station 5 included both clear and cloudy periods. The albedo shown in Figure 3 for this ice floe is the averaged value over the cloudy period of time. It can be seen that the albedo increases with latitude (Fig. 3a), while snow surface temperature decreases with latitude (Fig. 3b). The higher albedo at the more southerly stations is associated with the lower snow-surface temperatures and the resulting lower liquid-water content, together with smaller effective grain-size in the upper portion of the snow.
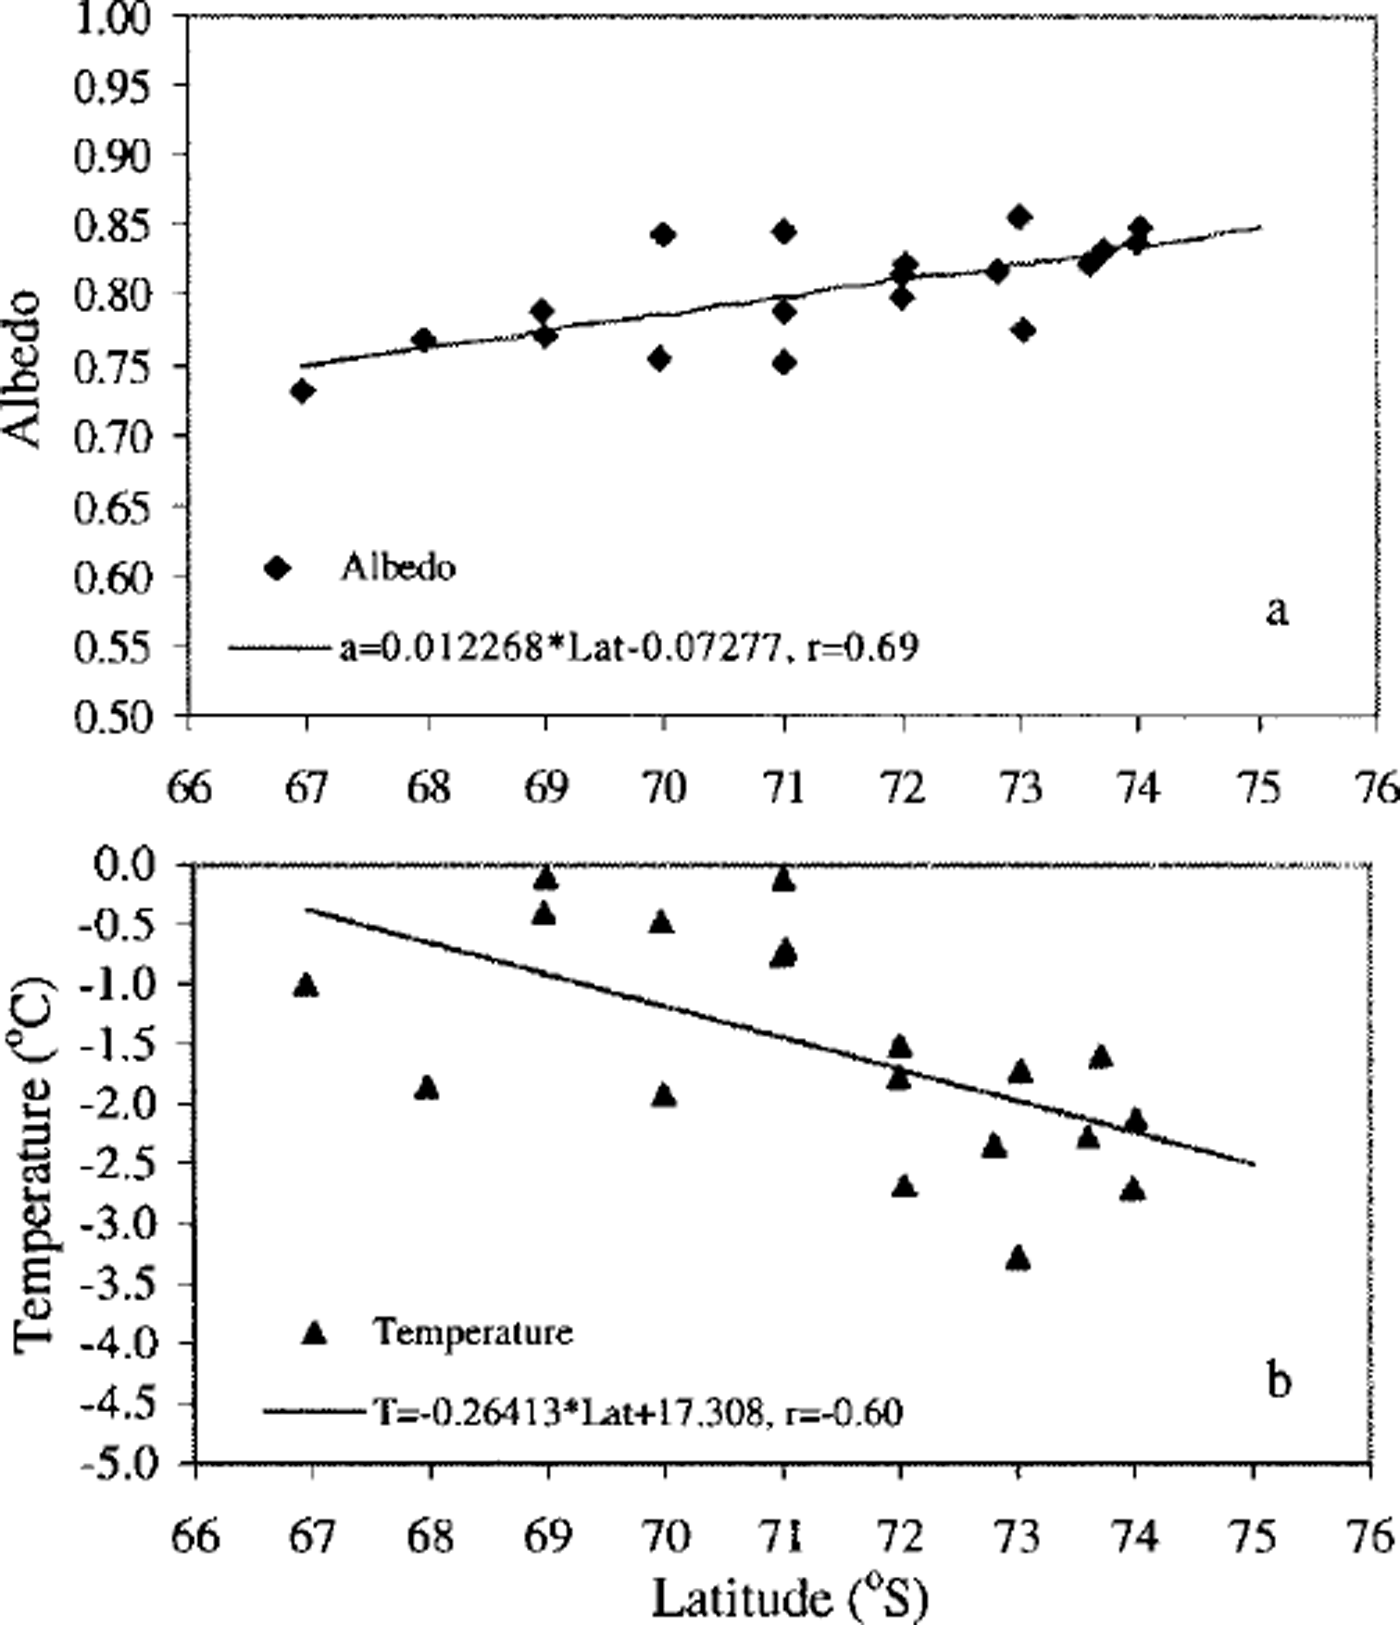
Fig. 3. Pack-ice albedo and surface temperature values under cloudy-sky conditions: the linear regression shows the relationship between (a) average albedo and latitude and (b) average snow surface temperature and latitude. stations at the pack-ice edge and on land fast ice are excluded from this analysis.
Temporal change
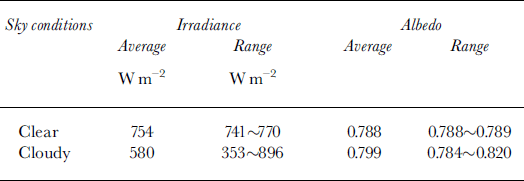
A time series of irradiance and all-wave albedo measured at station 5 (7−8 January 1999) is shown in Figure 4. From midmorning local solar time (∼1000h) until almost noon, the sky was clear. The measured irradiance increased smoothly with increasing solar elevation, but the albedo did not change significantly At 23:24 GMT (1124 h, local time), it became cloudy, with the clouds moving rapidly over the ice floe while the snow surface conditions (topography, temperature, etc.) remained almost the same. Clear and cloudy periods can be separated by the sudden variations in downwelling irradiance (Fig. 4). Even before the cloud covered the site completely, the cloud scattered more light into the site without blocking the direct solar beam. This caused the irradiance to increase slightly before it decreased abruptly as the cloud blocked direct sunlight to the site. When there were variations in the incident radiation due to changes in cloud conditions, the change in albedo was exactly opposite to that of downwelling irradiance, i.e. as downwelling irradiance increased, albedo decreased. The average irradiance and albedo during the period of most stable clear-sky conditions (22:30−23:10 GMT) and during the cloudy period are shown in Table 2, along with the irradiance fluctuation ranges during the two periods. From Table 2, we can see that the downwelling irradiance decreases by almost 23% due to the clouds. The increase of the average albedo due to clouds is about 1.4% relative to the average clear-sky albedo. The largest increase in albedo, which corresponded to the thickest cloud cover during the data acquisition, is 4.0%. The increase of albedo due to clouds is a strong function of the cloud type, coverage and thickness (Reference Grenfell and MaykutGrenfell and Maykut, 1977). Although these values are smaller than those obtained by Reference LiljequistLiljequist (1956) at Maudheim (5−10%), Reference HansonHanson (1960) at the South Pole (5−7%), and Reference WellerWeller (1968) at Mawson (11%), they are reasonable, considering the broad temporal and spatial variability of the cloud coverage and thickness.
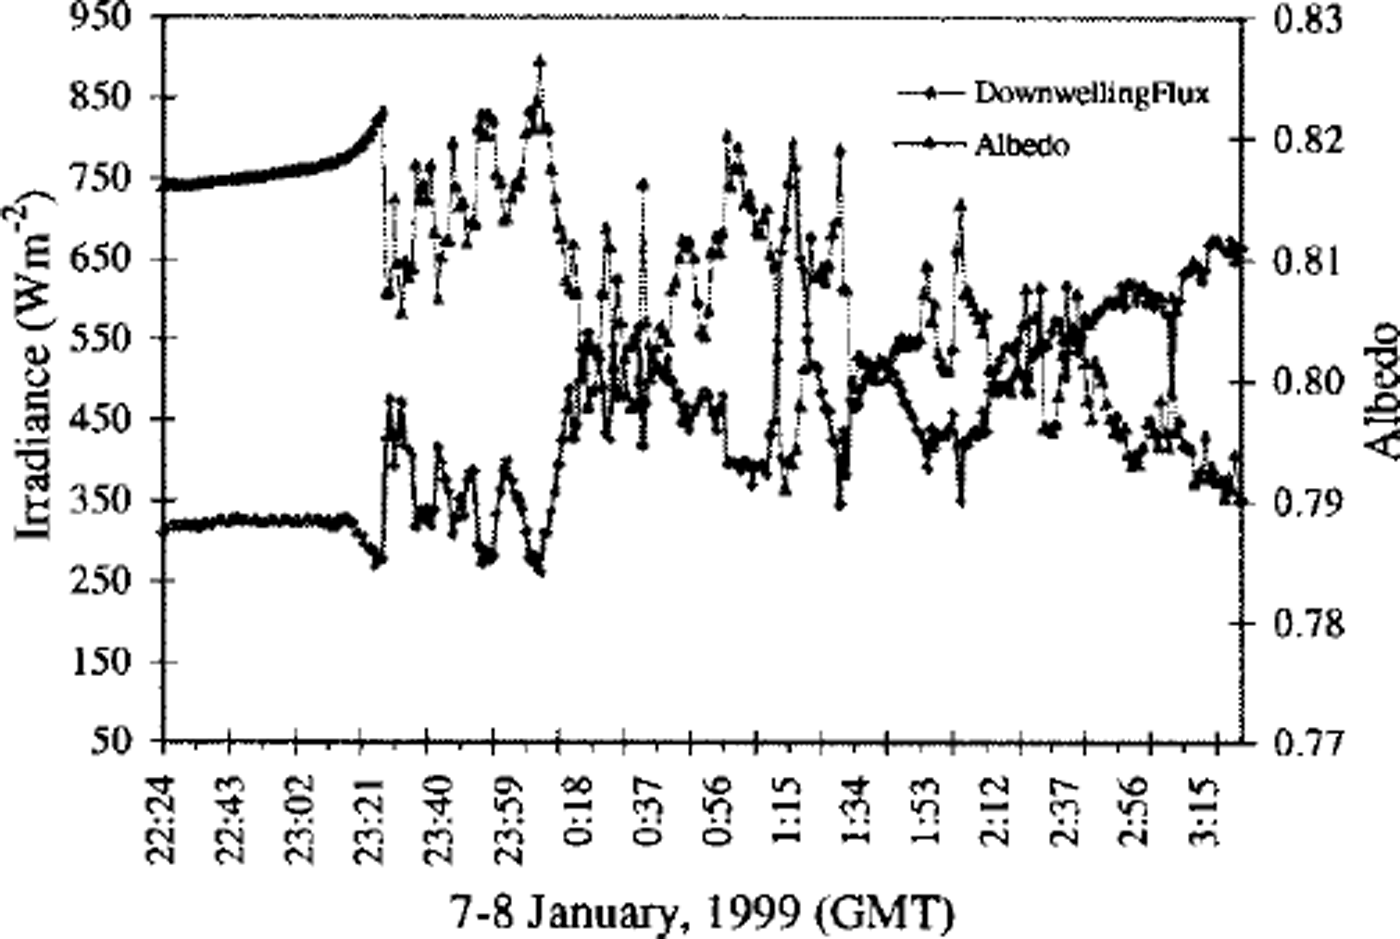
Fig. 4. Time series of downwelling irradiance and all-wave albedo measured on 7−8 january 1999 during clear- and cloudy-sky conditions. the station was located at 72°00.106 s, 165°03.242’ w. the snow depth was about 39 cm.
Table 2. Downwelling irradiance and albedo for clear and cloudy periods, 7−8 january 1999
Evaluation of Measured Albedo and Spectral Albedo
Measured albedo compared to calculated all-wave albedo
To make sure that the measurements of solar radiation for the albedo calculation are reasonable, we compared the measured values with model calculations. The clear-sky measurements taken at ice station 9 (12−13 January) were used for this analysis. This station was the southernmost station of the cruise and also the only station on land-fast ice. At the beginning of the station occupation, the air temperature was −5.4°C and the snow surface temperature was −4.0°C. The downwelling irradiance and all-wave albedo are shown in Figure 5. The downwelling irradiance decreased continuously until the end of the measurements as the solar elevation angle decreased after local noon. However, the albedo did not change significantly During the last third of the measurement period, the albedo decreased slightly.
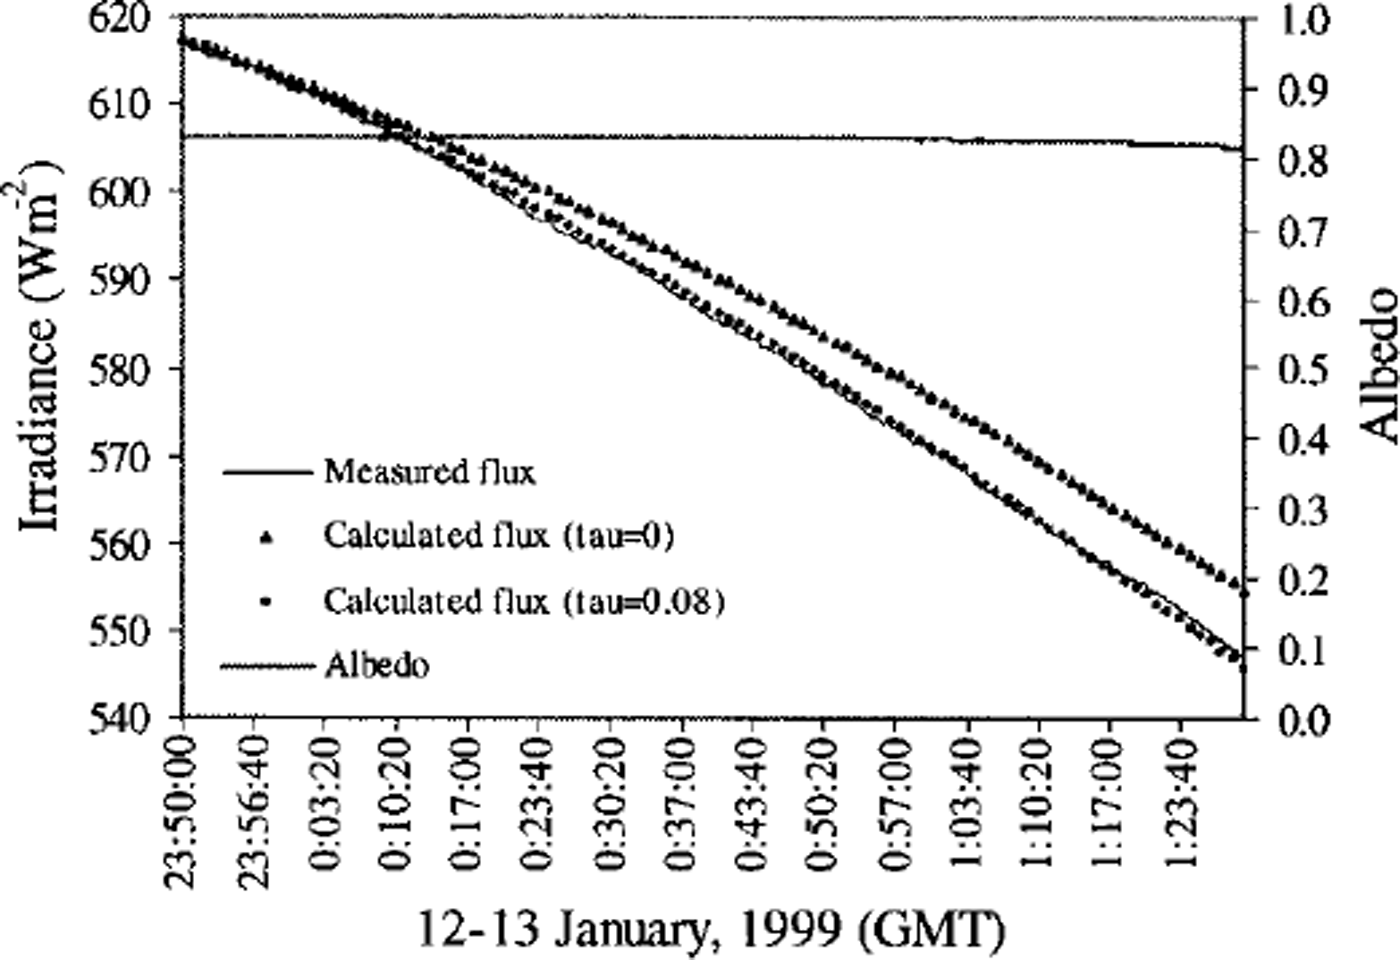
Fig. 5. Time series of downwelling irradiance and all-wave albedo measured on 12−13 january during clear-sky conditions. also shown are calculated irradiances with atmospheric attenuation (t =0.08) and without atmospheric attenuation (t =0). the station was located at 76°01287’ s, 151° 16.012’ w, with a multi-year snow cover about 154 cm thick. the excellent agreement between measured and calculated (r =0.08) irradiance makes differences between the two curves almost indiscernible. albedo remained relatively constant until the last third of the period, when it decreased slightly from 0.828 to 0.814.
Because the atmosphere was clear, we used a simple solar-zenith-angle model to calculate irradiance values for this time period to test the correctness of the irradiance measurements. Supposing at starting time t0 the theoretical value of downwelling irradiance F↓(t0) is exactly the same as the measured value F↓(t0), then for any time t later, the theoretical irradiance value is

where θ(t) is the solar zenith angle at time t, and τ is the apparent bulk optical depth of the clear-sky atmosphere. Based on the results of Reference WendlerWendler (1986) and Reference Li, Wan and DozierLi and others (1987), τ was chosen to be 0.08. The solar-zenith-angle model devised by Reference WoolfWoolf (1968) was used to calculate the temporal variation of the solar zenith angle. The results of the calculated surface solar irradiance with and without atmospheric attenuation are compared with actual measurements in Figure 5. For the case of no atmospheric attenuation (τ = 0), the maximum deviation of calculated from measured surface solar irradiance is 1.43% and occurs at 1:27:40 GMT on 13 January when the measured value is 548 W m−2 and the calculated value is 556 W m−2. For the case τ = 0.08, the maximum deviation of calculated from measured surface solar irradiance is 0.26% and occurs at 1:22:00 GMT on 13 January when the measured value is 554Wm−2 and the calculated value is 552 W m−2. This comparison demonstrates that even using a simple approximation there is good agreement between measured and calculated values, especially when the atmospheric attenuation is considered. Nevertheless, an effort is being made to model albedo using a more complicated radiative transfer method.
Comparison of all-wave albedo and spectral albedo measurements
Spectral albedo (ax) was measured simultaneously with all-wave albedo. In order to determine how well these two sets of measurements agree, all-wave albedos derived from spectral albedo data were compared to the measured values. First, the spectrally averaged visible and near-infrared (333.65−1064.9 nm) VNIR albedo (αvnir) was obtained from
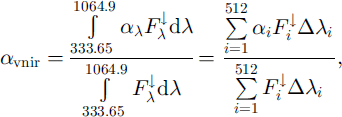
where at,
![]() and Δλi are the albedo, downwelling irradiance and bandwidth of the ith channel of the 512 channels of the spectroradiometer. The all-wave albedo αint
can be estimated through integration over the measured VNIR spectral albedo with extrapolation to the unmeasured spectral regions for clear-sky conditions:
and Δλi are the albedo, downwelling irradiance and bandwidth of the ith channel of the 512 channels of the spectroradiometer. The all-wave albedo αint
can be estimated through integration over the measured VNIR spectral albedo with extrapolation to the unmeasured spectral regions for clear-sky conditions:

where aA = a334 is assumed for λ<334 nm and αλ = (α1060 + 0.07)/2 is assumed for A > 1060 nm (Reference Allison, Brandt and WarrenAllison and others, 1993). Other values of αλ within λ ∊ [334, 1060] are the measured spectral albedo, and αλ = 0.07 is the albedo of open water. Equation (5) provides a method for deriving αint from the measured spectral albedo when the proportions of the downwelling irradiance in the ultraviolet (UV), VNIR and shortwave infrared (SWIR) spectral regions are known. The proportions of downwelling clear-sky spectral irradiance in different wavelength regions were calculated using the radiative transfer algorithm of Reference Stamnes, Wiscombe and JayaweeraStamnes and others (1988).
To derive the all-wave albedo from the measured spectral albedo for cloudy conditions, the proportion of the downwelling SWIR irradiance was calculated by subtracting the UV and VNIR irradiance from the all-wave irradiance. Compared with near-infrared radiation, the effect of clouds on the UV radiation is negligible, so the spectral irradiance FJ in the UV wavelength region 280−334 nm was taken to be the corresponding clear-sky downwelling spectral irradiance calculated using the radiative transfer algorithm (Reference Stamnes, Wiscombe and JayaweeraStamnes and others, 1988). Within the VNIR wavelength region, we used the measurements from the ASD spectroradiometer. The all-wave downwelling solar flux was measured by the upward-looking pyranometer (PSP). To account for the difference in the sensitivities between the PSP pyranometer and the ASD spectroradiometer, we defined instrument-dependent parameters Kl and k2 to relate the measured downwelling solar irradiance FPSP and spectral irradiance f{ ASD with the theoretical spectral irradiance fl derived from the radiative transfer model for clear-sky conditions:

For the ideal case, KI = K2 = 1. For the pyranometer and the spectroradiometer, we used Kl = 1.128 and k2 = 0.883, as obtained using a clear-sky case P at , station 5 (8 January).
Then the equivalent of Equation (5) takes the form for the general cases,

Spectral albedos obtained under clear-sky conditions at station 5 (8 January) on pack ice and at station 9 (13 January) on land-fast ice are shown in Figure 6a. Spectral albedos obtained under cloudy sky conditions at station 10 (14 January) on central pack ice and at station 12 (16 January) are shown in Figure 6b. The snow characteristics, solar zenith angle and albedo values are summarized in Table 3.
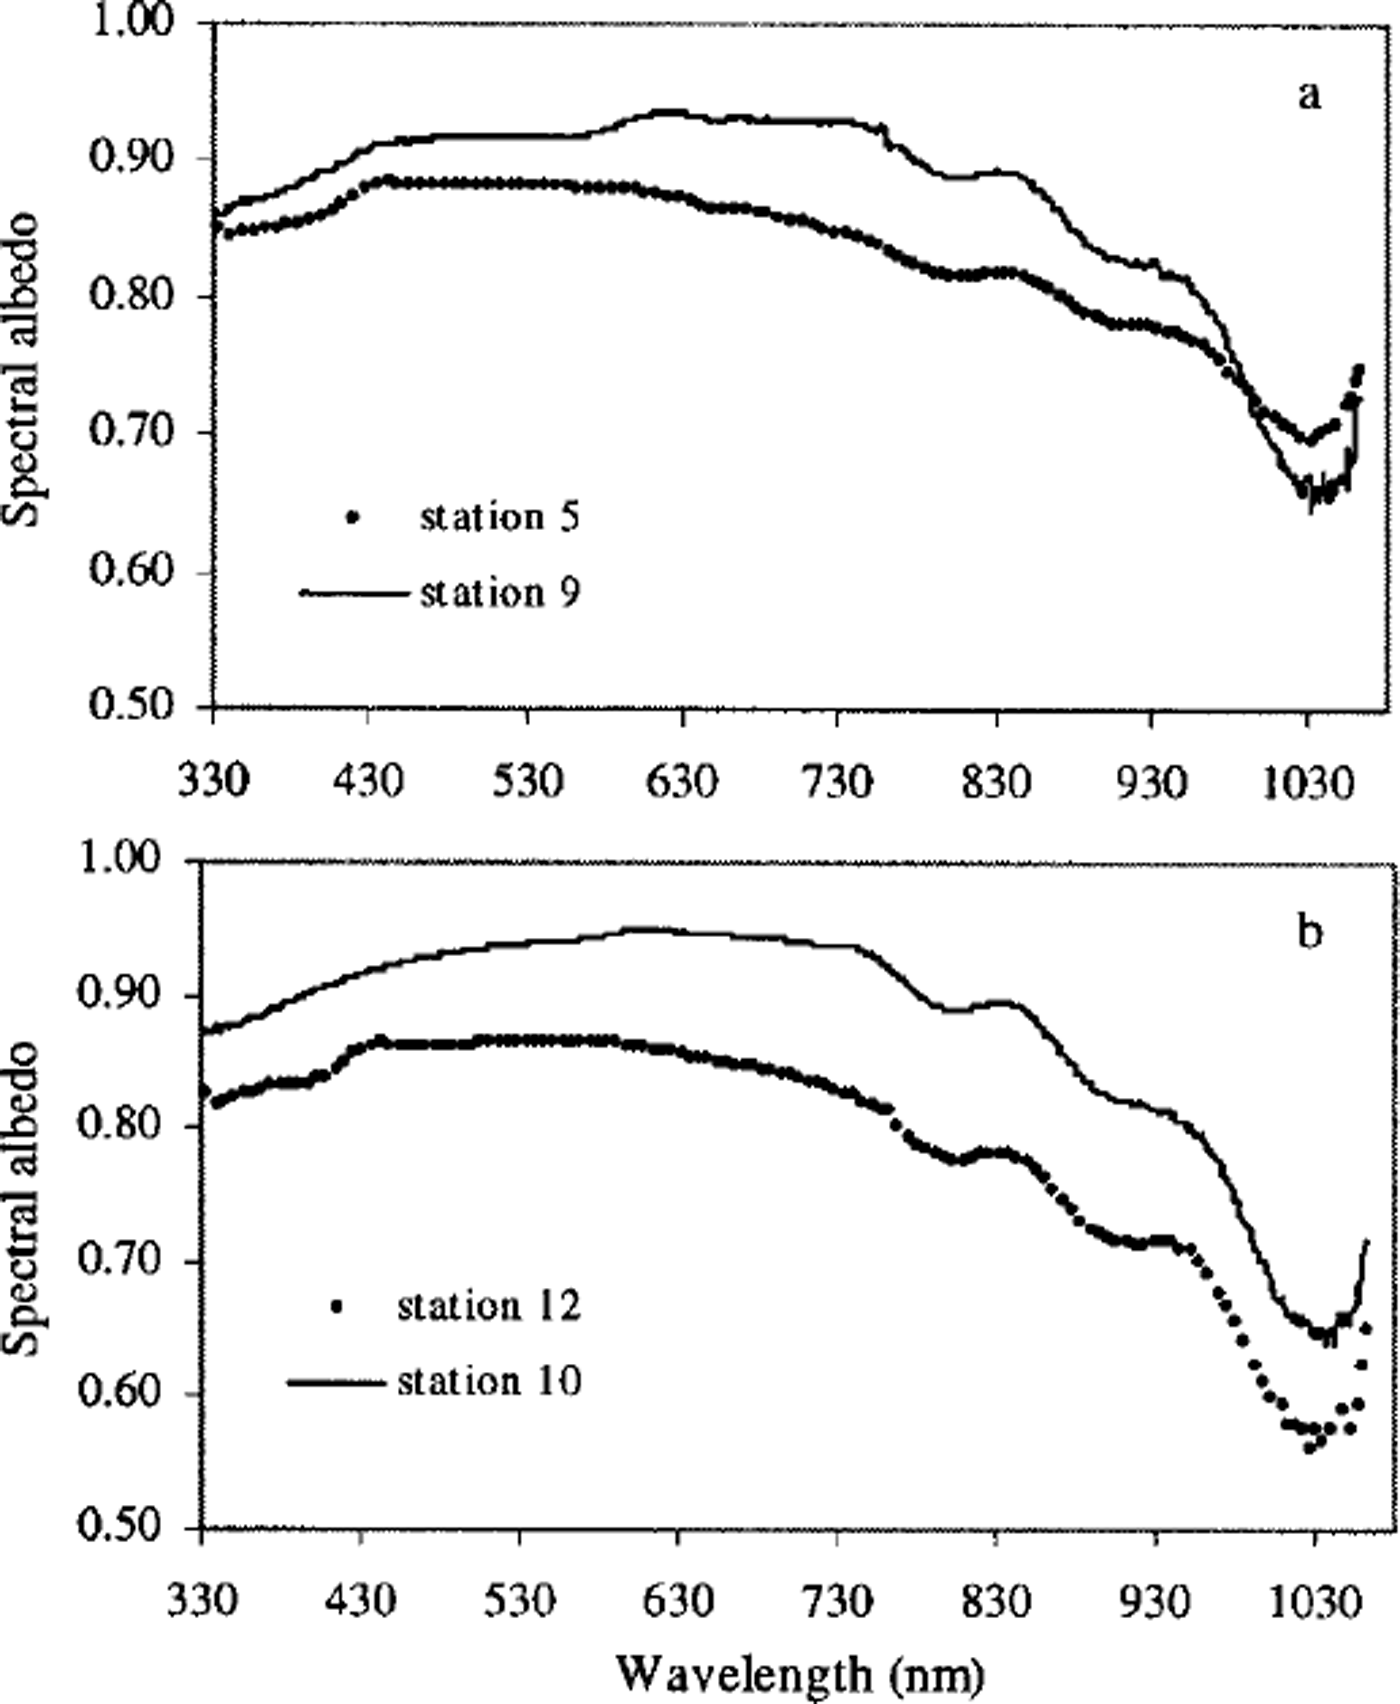
Fig. 6. (a) spectral albedos measured under clear-sky conditions at station 5 (8 january) and station 9 (13 january). (b) spectral albedos measured under cloudy conditions at station 10 (14 january) and station 12 (16 january).
Table 3. Snow parameters and retrieved albedos for selected sites where spectral albedo was measured
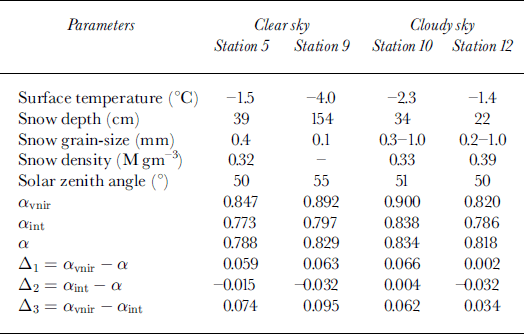
At station 5, the snow surface was made up of melt clusters ranging from 0.3 to 0.6 mm, with an average grain-size (d) of 0.4 mm and snow density p = 320 Mg m−3 for the 6 cm thick surface layer. At station 9, the snow surface was wind-packed and icy and made up of 0.1 mm snow grains. No snow-density data are available at this station. Although the sky was clear when the spectral albedo was measured at stations 5 and 9, it was much clearer at station 9 than at station 5 (see Figs 4 and 5). There was a very thin but stable layer of cirrus clouds at station 5 during the clear period in the day. From Figure 6a we can see that the spectral albedo was smaller at station 5 than at station 9 until the wavelength exceeded 994 nm. This was mainly due to the smaller grain-size (D = 0.1 mm) at station 9 (Reference Wiscombe and WarrenWiscombe and Warren, 1980; Reference Dozier and AsrarDozier, 1989).
The surface of the ice floe at station 10 was rough. Snow depth across the floe was horizontally very inhomogeneous, ranging from 3 to 60 cm. The grain-size of the top 1 cm layer was D = 0.3 mm, with coarse-grained snow ( D = 1 mm) directly below. Average density for the surface layer (6 cm) was 330 Mg m−3. The snow surface of the ice floe was flatter at station 12 than at station 10. On the very top of the snow cover was a 0.5 cm thick layer of recent snow with D = 0.2 mm, under which was a cemented icy layer of 3 cm with D = 0.6 mm. Under the icy layer were clusters of rounded particles with D = 1 mm. The averaged density of the upper 6 cm was 390 Mg m−3. The larger spectral albedo at station 10 (Fig. 6b) is mainly due to the finer grain-size (D = 0.2 mm) of the top layer.
Derived all-wave albedo values (αint) using Equations (5) and (7) for stations 5, 9, 10 and 12 are listed in Table 3. The differences between αvnir and αint are smaller (3.4−6.2%) under cloudy than under clear-sky conditions (7.4−9.5%) because the SWIR proportion was smaller under cloudy conditions. For example, at station 10, the SWIR accounted for only 7.6% of the total downwelling irradiance, but at station 5 where the sky was clear, the SWIR accounted for 19.1% of the total downwelling radiation.
The difference between the measured all-wave albedo a and those derived from measured VNIR spectral albedo is within ±3.2%. Since all-wave albedo and spectral albedo were measured on the same ice floes, yet at separate locations, these results seem reasonable given the uncertainties associated with spectral extrapolation.
Conclusions
The current investigation has focused on regional all-wave and spectral albedo measurements of the snow cover on the austral-summer sea ice in the Ross Sea. No obvious correlation between snow thickness and skin temperature of the snow surface emerged from our data. Snow surface temperature was primarily correlated with air temperature (Reference Li, Zhou and MorrisLi and others, 1999).
The measured all-wave downwelling irradiance agreed well with a simple approximation using solar zenith angle and bulk optical thickness for clear-sky conditions. Measured irradiance has not been compared with calculations for overcast conditions, due to lack of quantitative cloud-cover data. Albedo varied greatly (0.70−0.86) between different places in the Ross Sea. This large variation in albedo was also observed in the first-year pack ice in East Antarctica (0.65−0.85). Clear- and cloudy-sky albedos measured at the same site indicate that the average increase due to clouds is 1.4%, with the largest increase being 4.0%.
All-wave albedos were observed to be lower at the margin of the pack ice than in the central pack ice. Over the central pack ice, it was observed that the higher the latitude, the lower the snow surface temperature and the higher the all-wave albedo.
There was no major difference between spectral albedos under clear-sky and cloudy conditions. Both are mainly controlled by the snow grain-size, especially the snow grain-size of the top snow layer. All-wave albedos calculated from direct measurements of all-wave irradiance agreed well with those derived from integration of visible and near-infrared spectral albedos which included extrapolation to UVand SWIR regions for both clear- and cloudy-sky conditions. This indicates that our all-wave and spectral albedo measurements are reliable.
Acknowledgements
We are very grateful for the logistical support furnished by the U.S. National Science Foundation (NSF) and the Antarctic Support Associates personnel on board the R/V nathaniel b. palmer. we also sincerely appreciate the support of M. O. Jeffries, Chief Scientist of the NBP99-1 cruise, who always allowed us to be the first to occupy the ice floe before other activities which might have disturbed the surface of the snow and sea ice. The helpful comments of G. A. Maykut, S.G. Warren and another anonymous reviewer are very much appreciated. This work was supported by NASA under grant NAG5-6338 and by the NSF under grant OPP-9614844.


