


Introduction
The Ross Ice Shelf Project (RISP) began during the 1973–74 austral summer with the establishment of a base camp (~82°30'S, 166°w) on 14 December 1973. RISP is an interdisciplinary program composed of glaciological, geophysical, and oceanographic investigations. The primary glaciological objectives are to measure snow accumulation, ice strain-rates, 10 m temperatures, ice thicknesses, and ice velocities. This information is necessary to interpret data from the bore holes and ice cores drilled in the Ross Ice Shelf.
Microparticle concentration and size distribution have been measured in sample; from three sites on the Ross Ice Shelf. The analytical aspects of the Coulter counter technique are described by Reference ThompsonThompson (1977). The physical dissimilarity of firn and ice demands separate methods for sample cutting and cleaning as firn is more easily contaminated and requires special handling (Reference Mosley-ThompsonMosley-Thompson 1980).
One objective of these analyses is to examine the temporal variability in particulate deposition on the Ross Ice Shelf over two time scales: the last 400 a contained in the Q-13 core, and over many millennia contained in the J-9 core. A second objective is to determine if a seasonal cycle in microparticle deposition exists, and to test the use of microparticle concentration variations for dating ice stratigraphy on the Ross Ice Shelf. Reference Clausen, Dansgaard, Nielsen and CloughClausen and others (1979) suggest that conditions on the Ross Ice Shelf are less favorable for a seasonal pattern of dust deposition and that the fallout from nearby volcanoes may mask the possible seasonal pattern in the sparse deposition. Scanning electron-microscope examination of the material in the Q-13 core does not indicate a great abundance of fresh volcanic fragments and the predominance of clay particles suggests that airfall from Mt Erebus is not a major contributor to the insoluble particulates.
100 m Core from site Q-13
A 100 m core was drilled during the 1977–78 austral summer on the Ross Ice Shelf at site Q-13 (78°57'S, 179°55'E)(for map see figure 1 in Reference Thompson and Mosley-ThompsonThompson and Mosley-Thompson 1982). 2 611 samples representing the entire 100 m length (77 m water equivalent) were analyzed for micro-particle concentration and size distribution. The sample size at the top was 55 mm firn (21 mm water: ρ = 388 kg m−3)decreasing to 30 mm firn (27 mm water: ρ = 920 kg m−3) at the bottom. These sample sizes, coupled with the estimated annual accumulation of 160–190 mm water, provide a resolution of between 7 and 9 samples per average annual accumulation increment.
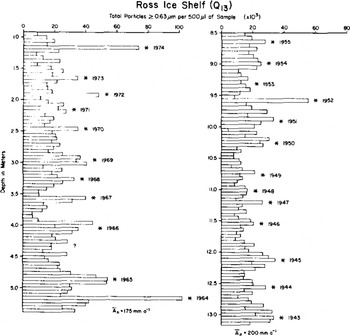
Fig.1. Total particle concentrations in two sections of the Q-13 core. Dates were assigned by counting the cyclical variations. Ān is the average annual accumulation rate for each section.
The Ross Ice Shelf is =330 m thick at Q-13 and the ice moves approximately 900 m a−1 from the south-east corner of the ice shelf (Jezek unpublished). Flow-line maps based upon intensity variations of the bottom echo (Reference Bentley, Clough, Jezek and ShabtaieBentley and others 1979) indicate that ice at Q-13 has come from the vicinity of West Antarctic ice streams A and B passing west of the Crary Ice Rise.
The detail of the microparticle record is illustrated by five representative sections (Figs.l and 2). A tentative time scale is constructed by counting the best defined microparticle concentration peaks downward from the surface. A discussion of the problems inherent in the interpretation of microparticle stratigraphy is presented elsewhere (Mosley-Thompson and Thompson in press). There have been no surface stratigraphic studies in the Q-13 area to provide confirmation that the well-preserved microparticle concentration cycles are annual.
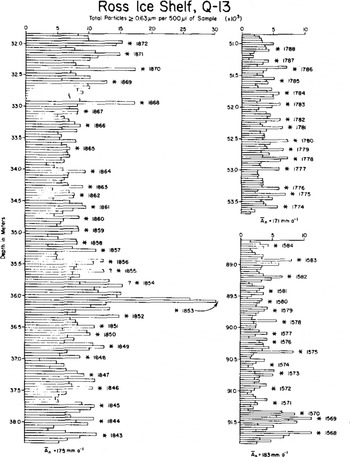
Fig.2. Total particle concentration in three sections of the Q-13 core. Dates were assigned by counting the cyclical variations in microparticle concentration. Ān is the average annual accumulation rate rate for each section.
One approach successfully employed in a previous study at the South Pole (Reference Mosley-ThompsonMosley-Thompson 1980) is to assume that the particle concentration peaks are annual, convert the vertical separation between successive peaks to water equivalent using the density profile, and construct an accumulation profile. A total of 454 peaks were counted and a corresponding accumulation record was constructed. A Fourier transformation of the data sequence and removal of periods less than 10 a was performed but no consistent trend was evident. Annual variability in net water accumulation (Ān) was found to be quite high, ranging between a minimum of 100 mm a−1 and a maximum of 260 mm a−1. Ān for the entire core is 168.8 mm a−1, intermediate between the earlier estimates of 180 mm a−1 by Reference Crary, Robinson, Bennett and BoydCrary and others (1962) and more recent estimates which fall between 120 and 160 mm a−1 (Bentley and Jezek 1981).
Figure 3 illustrates the concentration of total particles (diameters >0.63 urn) per 500 µℓ of sample for the entire 100 m core, plotted in water equivalent depth. The dates assigned at each 5 m interval were obtained by counting apparent seasonal variations in particle concentration downward from the surface as discussed above. The Q-13 microparticle record for the last 450 a bears no resemblance to the only other detailed Antarctic microparticle record, that from the South Pole (Reference Mosley-ThompsonMosley-Thompson 1980). Two prominent features of the Q-13 record are the gradual increase in concentrations since ~1800 and the very pronounced concentrations between 6.5 and 10 m (water equivalent) representing the period 1920–40 (Fig.3).
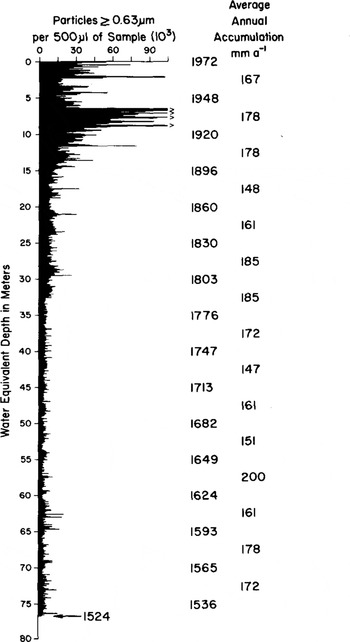
Fig.3. The concentration of total particles in 2 611 samples, representing the entire 100 m Q-13 core. Depth is in water equivalent. The estimated annual accumulation rate and data are included for each 5 m increment.
A gradual increase in particulate deposition begins around 1800, increasing by a factor of 4 by 1900 (Table I). Particulate concentrations increase rapidly after 1900 and by 1950 the concentrations are almost one order of magnitude greater than in 1730 (Table I). The ratios of concentrations in 1951 to 1730 show a small particle (0.63–0.80 µm) ratio of 8 and a large particle (>5.0 µm) ratio of 24, demonstrating that a much greater proportion of larger fragments are being deposited at the current Q-13 site than 220 a ago when the drill site was nearly 200 km further inland.
This general increase in particle concentration is attributed to the gradual northward movement of the deposition site. As the deposition site moves closer to the particle source, the exposed areas surrounding the Ross embayment, the number of particles deposited annually increases and larger fragments are more abundant (Table I).
Table 1. RATIOS OF PARTICLE CONCENTRATIONS REPRESENTING FIVE TIME INTERVALS IN THE Q-13 ICE CORE
Reference Thompson and Mosley-ThompsonThompson and Mosley-Thompson (1982) report that the current annual particle deposition rate is -150 × 107 particles m−2 at site J-9, which is ≈500 km from the Ross Sea. This contrasts sharply with the ≈800 × 107 particles m−2 deposited at Q-13 today. It is interesting that no general trend in estimated net accumulation was found. Such a trend would be in keeping with the spatial distribution of accumulation reported by Reference Clausen, Dansgaard, Nielsen and CloughClausen and others (1979) and would be expected as the site moves closer to the moisture source. This is under investigation.
Much of the material deposited at Q-13 today appears to be locally derived, and is probably transported in association with the cyclonic storm systems which move into the Ross Sea. Reference CarletonCarleton (1981) reports that cyclogenesis in the southern hemisphere winter tends to occur over middle latitudes, with maturity and decay (cyclolysis) occurring at higher latitudes. This is the same pattern as reported by Reference Mosley-Thompson and ThompsonStreten and Troup (1973) and Reference Streten and WellsStreten and Wells (1977) for other seasons. Cyclone frequency is 2.5 times greater during winter than summer (Reference CarletonCarleton 1981) and, by late winter/early spring (September), cyclolysis reaches a maximum in response to the intensified circumpolar trough. The mean distribution of dissipating vortices for five winters shows a maximum over the Ross Sea (Reference CarletonCarleton 1979). As these dissipating storms move onto the Ross Ice Shelf, they transport very small (<1.0 µm) particles from midlatitudes as well as local Antarctic material entrained from exposed areas along the eastern margin of the Ross embayment.
The very substantial increase in particle concentrations between 1920 and 1940 is quite intriguing. Size distribution data indicate that the material is locally derived and consists of great quantities of large (>1.0 µm) fragments. Very pronounced broad peaks are centered at 1927, 1934, 1938, and 1940, and are associated with modest accumulation increases. Scanning electron-microscope examination of the particles in the 1927 and 1940 peaks reveals many large (>50 µm) fragments and very few fresh volcanic glass shards, which might be expected if direct air fall from Mt Erebus were the source. The ratio of particle concentrations in the 1940 and 1927 peaks to that in 1730 (Table I) provide strong evidence that local sources contributed greatly to the total particulate mass.
Interestingly, conductivity measurements on liquid samples from a 44 m core from Windless Bight, near Ross Island, show a number of moderately elevated conductivity peaks between 1922 and 1940 (J Palais personal communication). The core was dated by assuming steady-state conditions and a constant accumulation rate of 200 mm a−1 water. Palais reports a 0.1 m thick dust band at 18.51–18.61 m (≈1929) in the core. Preliminary indications are that the conductivity increases are associated with enhanced concentrations of sea salts. More detailed comparisons between the Windless Bight and Q-13 cores will be pursued.
We propose that the most viable mechanism to account for the transport of the great quantity of poorly sorted material to site Q-13 is either an increase in the annual frequency of storms entering the Ross Sea or deeper penetration of the depressions onto the Ross Ice Shelf. Analysis of the long records of sea-level pressures and temperatures in New Zealand and Australia could reveal whether anomalous conditions characterize the 1920–40 period. Certainly under conditions of greater baroclinic instability, deeper depressions could be generated over the southern oceans resulting in deeper penetration into the Ross Sea during a longer dissipation stage.
Base camp shallow core studies
In 1973–74, thirty-six 10 m cores were recovered in the south-eastern part of the Ross Ice Shelf (Reference Clausen, Dansgaard, Nielsen and CloughClausen and others 1979). Three cores drilled at base camp on January 29, 1974 were shipped to The Ohio State University for microparticle analysis. One core was analyzed in October 1974 using a Coulter counter model T in the clean room at the Institute of Polar Studies. In November 1974, the old room was replaced with a commercial Class 100 clean room and a new Coulter counter model TA II was installed. In July 1975, the remaining two cores were analyzed in the new microparticle facility. The size ranges measured by the two counters are not comparable and, thus, only the latter two cores are discussed (Fig.4).
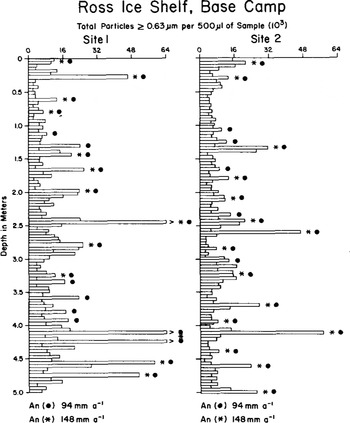
Fig.4. Concentration of total particles with diameters >0.63 µm 500 µℓ−1 sample in two cores drilled at base camp on the Ross Ice Shelf. Asterisks mark well-defined microparticle concent ration peaks (see text) while dots mark each microparticle peak. A̅n is the estimated average annual accumulation rate in mm of water.
Cyclical variations in particle concentration appear fairly well preserved in these cores, which provide the only information about the spatial variability of microparticle concentrations and the preservation of concentration variations in the stratigraphy on the Ross Ice Shelf. Previous microparticle studies (Reference Mosley-ThompsonMosley-Thompson 1980, Reference Thompson, Mosley-Thompson and PetitThompson and others 1981) have illustrated the importance of detailed pit and shallow core work for the proper assessment of stratigraphic records from deeper cores.
The first estimates of annual accumulation patterns in the base camp and J-9 area were derived from strati graphic studies in shallow pits along traverse routes and were reported as 158 mm water a−1 (Reference Crary, Robinson, Bennett and BoydCrary and others 1962). More recently the use of total 3 activity to identify time-stratigraphic horizons (Reference Clausen, Dansgaard, Nielsen and CloughClausen and others 1979) reveals that accumulation in the J-9 and base camp areas is approximately 81 and 90 mm a−1 (water equivalent), respectively. Reference Herron and LangwayHerron and Langway (1979) found that Na concentrations exhibit a seasonal variation, thus providing a method for gating. At site J-9, an accumulation rate of 90 mm a−1 was determined by counting Na concentration peaks with depth. Reference Molenar and WarburtonMolenar and Warburton (1979) report a personal communication from C Cornish that radiometric (e) dating of 5 m cores at site J-9 yielded an average annual accumulation of 97 mm a−1. In view of the correspondence among these three independent studies, it is assumed here that the average annual accumulation in the J-9 region of the Ross Ice Shelf is 80 to 100 mm a−1.
The following discussion assumes that microparticle concentrations exhibit a seasonal cycle of deposition. Microparticle work on the Ross Ice Shelf is insufficient, as the following discussion illustrates. Figure 4 presents the concentration of microparticles with diameters >0.63 µm (C) in the two base camp cores. The asterisks denote C peaks which conform to the standard criteria for welldefined peaks established from East Antarctic surface studies (Reference Thompson, Mosley-Thompson and PetitThompson and others 1981, Mosley-Thompson and Thompson in press). A well-defined peak (*) must consist of two or more samples and be separated from adjacent peaks by a distinct minimum on each side.
An alternative method is to count each microparticle concentration peak as an annual feature and estimate accumulation. The full circles (·) designate the peaks counted in this fashion. Using the density measurements from a 100 m core drilled in 1974 at J-9, the average annual water accumulation for each interpretation is calculated and shown at the bottom in Figure 4.
The counting of all microparticle peaks yields an estimate of 94 mm a−1 water equivalent, in excellent agreement with data obtained by radiometric dating. One reason that each particle concentration peak should be counted may be the large sample size (40–50 mm) analyzed. Generally, 6 to 10 samples peraverage accumulation increment is required for clear resolution of a seasonal cycle. In 1975, when these analyses were conducted, accumulation was thought to be nearly 150 mm a−1 (water) or 440 mm (surface ρ ≅ 340 kg m−3) of snow which, coupled with the sample size, gives 9 to 10 samples per average year. However, since accumulation is now known to be 90 mm a−1 or 264 mm of snow, the 50 mm sample size gives only 5 samples per average accumulation increment, a resolution too coarse to result in welldefined peaks and minima. The degree of postdepositional disruption of the snow and associated particulate material on the Ross Ice Shelf has not been assessed, but is essential for proper interpretation of the stratigraphic records.
Preliminary results from the 416-m core at J-9
A 416 m core was drilled in 1977–78 through the Ross Ice Shelf at site J-9 (82°22.5'S, 168°40'W) (Reference Zotikov, Zagorodnov and RaikovskyZotikov and others 1979). Recently, thirty-nine 1 m sections of the core were obtained for microparticle analysis. Approximately the top 0.2 m of each of the 39 sections have been analyzed for microparticle concentration and size distribution. Figure 5 illustrates the average concentration of small particles (0.63–0.80 µm) and total particles (>0.63 µm) in each of the 39 sections.
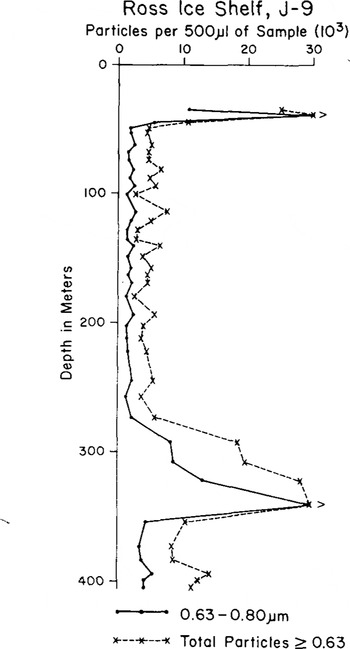
Fih.5. Preliminary results from the microparticle analysis of the upper 0.2 m of each of the thirty-nine 1 m sections of the 416 m core from site J-9 on the Ross Ice Shelf. The upper three sections are contaminated by drilling fluid. Pore close-off (ρ = 820 kg m−3) is at 45 m.
The top three samples between 36 and 44 m were contaminated by the drilling fluid. This was confirmed by microscopic examination of the particles. Pore close-off (ρ = 820 kg m−3) was reached at 44 m. Below pore close-off, ice samples are less subject to contamination and easier to clean prior to analysis.
Particle concentrations below 45 and above 250 m are very low, averaging roughly 5 000 particles (>0.63 µm) per 500 µℓ sample. It is interesting to note that these low concentrations are quite similar to the concentrations found in the lower half of the Q-13 core (Fig.3). Below 250 m, total particle concentrations increase by a factor of 4 at 290 m and by a factor of more than 10 at 340 m. Below 350 m, concentrations decrease to roughly 10 000 particles per 500 µℓ sample, twice the concentrations between 50 and 250 m.
We propose that this substantial increase in particle concentration may signal the presence of ice deposited near the end of the last glacial stage, the Wisconsin. Reference Thompson and Mosley-ThompsonThompson and Mosley-Thompson (1981) report that such increases in microparticle concentrations were found to characterize late glacial ice in three deep cores: the Byrd station and Dome C cores in Antarctica, and the Camp Century core in Greenland.
The analyses of the remaining sections of the J-9 core will include particle concentrations, size distributions, and microscopic examination. These microparticle data, coupled with the oxygen isotopic ratios, will indicate whether the ice between 250 and 350 m at J-9 was deposited in West Antarctica during the last glacial stage.
Conclusions
Microparticle analyses have been conducted for only three sites on Ross Ice Shelf: Q-13, base camp, and J-9. The data from Q-13 and base camp indicate a cycle in microparticle deposition which appears to be annual. Assuming these particle concentration peaks are annual, the estimated average annual accumulation near base camp is 94 mm water, consistent with radiometric dating estimates, but less than the results of pit strati graphic studies. Using the same assumptions for the upper 5 m (water equivalent) of the Q-13 core, average annual accumulation was estimated to be 167 mm water, intermediate between radiometric dating estimates and pit stratigraphic measurement.
The microparticle analysis of the 100 m Q-13 core entailed 2 611 samples. A general trend of increasing particle concentration since 1800 is suggested to reflect gradual northward movement of the drill site closer to the Ross Sea. The bulk of the particulates are thought to be deposited in assocation with the dissipating cyclonic storms which move onto the Ross Ice Shelf. These storms can transport small particles from mid-latitudes as well as larger fragments from exposed areas along the eastern coast of the Ross embayment. The period between 1920 and 1940 in the core contains an order of magnitude increase in particle concentration in association with numerous very broad spikes in the particle profile. It is speculated that either deeper penetration or a greater frequency, of dissipating cyclones in the Ross Sea could account for the high particle concentrations and large fragments characterizing this 20 a period.
The preliminary analysis of small portions of 39 sections of the 416 m core from J-9 reveals a very substantial increase in particle concentration between 290 and 350 m. Analyses are continuing to determine whether this increase in particulate content signals the presence of late Wisconsin ice deposited in West Antarctica or a drastic change in the microparticle depositional regime.
Acknowledgements
The authors wish to express appreciation to D Bromwich, A Carleton, J Rogers, P Kyle, and J Palais for valuable discussions. We thank J Palais for providing unpublished data, R Tope for illustrating the manuscript, and J Cothran for typing it. This work was supported by US National Science Foundation grant DPP-7719371A02. The microparticle data from the Q-13 core will be furnished to World Data Center A for Glaciology, where they will be available upon request.


