


An increasing number of countries are developing mandatory front-of-package (FOP) nutrition labels( Reference Kanter, Vanderlee and Vandevijvere 1 ). In 2016, Chile mandated nutrient-specific ‘high in’ symbols, which are displayed as ‘stop signs’ on food and beverage products that exceed limits for sugar, sodium, saturated fat and total energy( Reference Corvalán, Reyes and Garmendia 2 ). Canada is one of several countries that are developing similar regulatory requirements for ‘high in’ FOP systems( Reference Kanter, Vanderlee and Vandevijvere 1 , 3 ).
To date, evidence from experimental studies, qualitative investigations and real-world evaluations suggests that nutrient-specific FOP warnings can be easier to understand( Reference Corvalán, Reyes and Garmendia 2 , Reference Arrúa, Machín and Curutchet 4 ), effective at reducing consumer preference and purchase intention( Reference Corvalán, Reyes and Garmendia 2 , Reference Arrúa, Machín and Curutchet 4 – Reference David, Krutman and Fernández-Santaella 12 ), and can affect actual purchasing and consumption of targeted foods( Reference Neal, Crino and Dunford 13 – Reference Ministerio de and Gobierno de 15 ). Research from various countries also shows strong consumer support for the labelling systems( Reference Ministerio de and Gobierno de 15 – 18 ). In addition to influencing consumer perceptions and behaviour, FOP warning regulations may also act as strong incentives for product reformulation. In Chile, 18 % of products on the market had been reformulated six months following implementation of the mandatory FOP ‘high in’ warnings( Reference Ministerio de and Gobierno de 15 ).
As FOP labelling policies become more widely implemented, there is a need to understand how the mandated nutrition information interacts with the rest of the package. Voluntary nutrition and health claims – those displayed by the manufacturer to highlight positive nutrients, attributes or health benefits of a particular product – are commonly displayed on the front of packaged foods and beverages. In Canada, up to half of all pre-packaged products feature a voluntary health or nutrient claim( Reference Schermel, Emrich and Arcand 19 , Reference Christoforou, Dachner and Mendelson 20 ), and similarly high prevalence of nutrition and health claims has been observed in other countries( Reference Hieke, Kuljanic and Pravst 21 – Reference Taillie, Ng and Xue 23 ). Previous research has demonstrated that voluntary nutrition and health claims increase the appeal and perceived healthiness of foods( Reference Arrúa, Curutchet and Rey 7 , Reference Kim, Kang and Kwon 24 – Reference Abrams, Evans and Duff 33 ) and that this effect persists even when the actual nutritional quality of the food is low( Reference Dixon, Scully and Niven 34 ). This phenomenon, often referred to as a ‘health halo’ effect, can be explained by the Chaiken’s heuristic-systematic model of information processing, in which individuals are more likely to use highly available cues rather than detailed information processing when they have limited time or energy to judge the validity of a message( Reference Chaiken 35 ). The average consumer spends less than 10 s viewing and assessing a food product label on any given shopping trip, therefore salient FOP information features most prominently in their decision making( Reference Cowburn and Stockley 36 , Reference Campos, Doxey and Hammond 37 ). It is well established that nutrient claims increase consumers’ perceptions of the healthiness of food and beverage products; however, it is less clear how voluntary nutrition and health claims may interact with mandatory FOP labels.
This issue is particularly salient for nutrient-specific FOP systems. For example, in Canada, current regulations permit manufacturers to include ‘reduced’ claims on food and beverage packages if a product contains at least 25 % less of a specific nutrient compared with a similar reference food( 38 ). The claim can be made regardless of the absolute level of the nutrient. Therefore, it is possible that a food product would qualify for a reduced claim for a nutrient, such as sodium, at the same time as it triggers a ‘high in’ sodium FOP warning under Canada’s proposed regulations.
The current short communication presents results from two experimental tasks aimed at testing the influence of nutrient claims on consumers’ ability to correctly interpret FOP ‘high in’ nutrient warnings.
Methods
Data were collected via self-completed web-based surveys as part of Wave 2 of the Canada Food Study in 2017. Respondents from Wave 1 were sent an email invitation to complete two online surveys, as well as email reminders. In Wave 1, respondents were recruited by trained research assistants for a study on food choices using in-person intercept sampling in five cities (Edmonton, Halifax, Montreal, Toronto and Vancouver) from a sample of sites stratified by region/neighbourhood and site type (mall, transit hub, park, other shopping district). Eligible respondents were 16–30 years of age at recruitment in 2016 (16–32 years of age in Wave 2). The Canada Food Study specifically targeted youth and young adults due to their tendency to engage in poorer dietary habits compared with other age groups and their increased likelihood of being targeted by food and beverage marketing efforts. Respondents were discouraged from attempting to complete the survey via smartphone.
Surveys were completed between October and December 2017 and were conducted in English or French. Respondents received a $CAN 20 Interac e-transfer after completing the study. Respondents provided consent prior to completing the survey. The study was reviewed by and received ethics clearance from the University of Waterloo Research Ethics Committee (ORE# 21631). A full description of the study methods can be found in the Canada Food Study Technical Report( Reference Hammond 39 ).
Experimental tasks
Respondents completed two between-group experimental tasks. First, participants viewed a package of multigrain crackers labelled with a ‘high in sodium’ symbol in the top right corner. Respondents were randomized to see this package as is (control), with a ‘reduced sodium’ claim directly beneath the ‘high in’ symbol, or with a ‘reduced sodium’ claim positioned away from the ‘high in’ symbol (see Fig. 1(a)–(c)). Respondents were asked, ‘Is this product high in sodium?’, with response options ‘yes’, ‘no’, ‘not sure’ or ‘refuse to answer’.

Fig. 1 (colour online) Labelling condition images: (a) ‘high in sodium’ warning+no claim; (b) ‘high in sodium’ warning+‘reduced sodium’ claim next to the warning; (c) ‘high in sodium’ warning+‘reduced sodium’ claim away from the warning; (d) ‘high in sugar’ warning+no claim; (e) ‘high in sugar’ warning+‘reduced fat’ claim next to the warning; (f) ‘high in sugar’ warning+‘reduced fat’ claim away from the warning
In the second experimental task, participants viewed a package of multigrain granola bars labelled with a ‘high in sugar’ symbol in the top right corner. A different food product image and target nutrient were used in this task to ensure that respondents’ experiences in the first experimental task did not influence their answers in the second task. Again, respondents were randomized to see this package as is (control), with a ‘reduced fat’ claim directly beneath the ‘high in’ symbol, or with a ‘reduced fat’ claim positioned away from the ‘high in’ symbol (see Fig. 1(d)–(f)). Respondents were asked, ‘Is this product high in sugar?’, with response options ‘yes’, ‘no’, ‘not sure’ or ‘refuse to answer’.
Analysis
A total of 1000 respondents were included in the current analysis after excluding participants with missing data. The χ 2 test was used to test for sociodemographic differences between experimental conditions. Separate binomial logistic regression models were used to model the effect of the labelling condition on respondents’ ability to correctly interpret the cracker and granola bar products as ‘high in sodium’ and ‘high in sugar’, respectively. ‘Yes’ responses were coded as ‘correct’. ‘No’ and ‘not sure’ responses were coded as ‘incorrect’. ‘Refuse to answer’ responses were coded as missing. Analyses were conducted using the statistical software package IBM SPSS Statistics version 24.0 (2016). The significance threshold was set at 0·05 for all tests.
Results
Sample characteristics can be found in Table 1.
Table 1 Characteristics of the sample of Canadian young adults aged 16–32 years (n 1000) participating in an online survey as part of Wave 2 of the Canada Food Study, 2017

The χ 2 tests between experimental conditions indicated that, following randomization, the proportion of males and females differed across the experimental conditions in the ‘high in sugar warning+reduced fat claim’ experiment (χ 2=6·634, P=0·036); therefore, sex was included in the model for this experiment. No other significant differences in sociodemographic measures were observed across experimental conditions (see Table 1).
High in sodium warning + reduced sodium claim
Figure 2(a) shows the proportion of participants who correctly identified the cracker products as being high in sodium across each of the three labelling conditions. Respondents who viewed the control package with no nutrient claims were significantly more likely to correctly identify the product as being high in sodium than those who viewed a package with a nutrient claim next to the ‘high in’ label (OR=2·39; 95 % CI 1·54, 3·72; P<0·0001) and away from the label (OR=4·88; 95 % CI 3·18, 7·47; P<0·0001). In addition, respondents who viewed the package with a health claim positioned next to the ‘high in’ label were significantly more likely to correctly identify the product as being high in sodium than those who viewed a package with the health claim away from the ‘high in’ label (OR=2·04; 95 % CI 1·45, 2·87; P<0·0001).
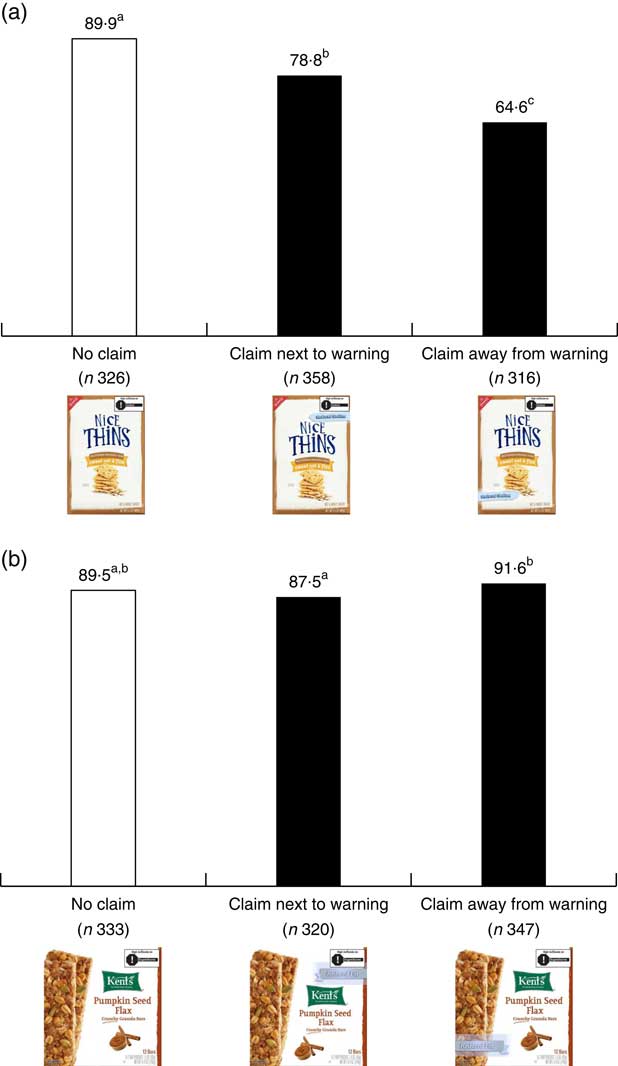
Fig. 2 (colour online) Percentage of respondents who correctly identified the cracker and granola bar products as being (a) ‘high in sodium’ and (b) ‘high in sugar’, respectively, across each labelling condition. Bars show the percentage who answered ‘yes’ to the question ‘Is this product high in sodium?’ (a) and ‘Is this product high in sugar?’ (b) in the sample of Canadian young adults aged 16–32 years (n 1000) participating in an online survey as part of Wave 2 of the Canada Food Study, 2017. a,bValues with unlike superscript letters were significantly different (P<0·05)
High in sugar warning + reduced fat claim
Figure 2(b) shows the proportion of participants who correctly identified the granola bar product as being high in sugar across each of the three labelling conditions. There were no significant differences in correct responses between respondents who viewed the control condition with no nutrient claim and those who viewed a package with a nutrient claim next to the ‘high in’ label (P=0·293) or those who viewed a package with the claim positioned away from the label (P=0·337). Respondents who viewed the package with the nutrient claim positioned away from the ‘high in’ label were more likely to correctly identify the granola bar product as being high in sugar than those who viewed the package with the nutrient claim next to the label (OR=1·68; 95 % CI 1·01, 2·79; P=0·047).
Discussion
The current short communication demonstrates that voluntary nutrient claims can influence consumers’ interpretation of FOP ‘high in’ warnings. When a product label featured a ‘reduced’ claim for the same nutrient that is labelled as ‘high’, consumers were significantly less likely to correctly identify that product as high in the nutrient of concern. The presence of a contrasting nutrient claim reduced correct responses regardless of the claim’s placement on the package; however, when the claim was located further from the warning, respondents had even more trouble identifying that the product was high in sodium. It is unclear why claims further away were more likely to undermine the FOP symbol; possibly it is because they diverted visual attention away from the FOP symbol.
The negative impact of nutrient claims on FOP warnings was observed only when the same nutrient was featured in the claim and FOP symbol. Although a statistically significant difference was identified between the two conditions with a ‘reduced fat’ claim present, all three package images produced similarly high rates of correct responses among respondents. The effect of a ‘reduced fat’ claim did not appear to impact consumers’ perceptions of the ‘high in sugar’ warning.
Although the current study is one of the first to explore the specific influence of voluntary nutrient claims on consumer interpretation of ‘high in’ FOP warning labels, its results reflect the overall theme in the literature that FOP labels and voluntary claims interact. Previous studies suggest that when both attributes are displayed together on a package, the presence of a FOP nutrition label often depresses the ‘health halo’ effect of the nutrient or health claim and leads to healthier product choices than when only a nutrient or health claim is present( Reference Maubach, Hoek and Mather 40 , Reference McLean, Hoek and Hedderley 41 ). Again, Chaiken’s heuristic-systematic model of information processing helps to explain the strong influence that FOP attributes have on consumers’ food and beverage choices. The average shopper uses the most readily available information when evaluating a food product; when multiple claims and interpretive labels are present, individuals may base their decision on the information that they judge to be most trustworthy, or most applicable to them.
Future research should examine how nutrient-specific claims might influence consumer perceptions of ‘summary’ FOP systems, such as Health Star Ratings or the Nutriscore system, as well as how other types of claims, such as broader health or disease reduction claims, might influence perceptions of FOP labelling systems. The use of government attributions (e.g. a reference to ‘Health Canada’) on FOP labels is also becoming increasingly commonplace, as they have been shown to increase the credibility of labelling systems( Reference Acton, Vanderlee and Roberto 42 – Reference Vyth, Steenhuis and Mallant 44 ). The current study did not display a government attribution on the FOP ‘high in’ warnings; further research would be useful to examine whether the inclusion of a government attribution on FOP labels may reduce the influence of voluntary health or nutrient claims.
Several potential limitations should be noted. Respondents were limited to ages 16–32 years and data were collected from major cities in Canada; therefore, these results may not be generalizable to older age groups or those living in more rural areas. The Canada Food Study sample is non-representative; however, the randomized nature of the experiment resulted in comparable sociodemographic characteristics across labelling conditions.
Conclusion
These findings provide important evidence to inform nutrient-specific FOP regulations, particularly considering the prevalence of voluntary nutrient claims on food products. In Canada, studies have found that up to half of all pre-packaged food and beverage products display at least one health or nutrition claim( Reference Schermel, Emrich and Arcand 19 , Reference Christoforou, Dachner and Mendelson 20 ) and nutrient claims are more likely to be displayed on more highly processed foods( Reference Christoforou, Dachner and Mendelson 20 ). The current findings suggest that FOP regulations should consider prohibiting nutrient claims for the same nutrients that trigger a ‘high’ FOP symbol.
Acknowledgements
Financial support: This project has been made possible through funding from the Public Health Agency of Canada (PHAC) and a Canadian Institutes of Health Research (CIHR) Population Intervention Grant. R.B.A. is supported by a doctoral Ontario Graduate Scholarship. Additional funding for this project has been provided by a PHAC–CIHR Chair in Applied Public Health, which supports D.H., staff and students at the University of Waterloo. PHAC and CIHR had no role in the design, analysis or writing of this article. The views expressed herein do not necessarily represent the view of PHAC or CIHR. Conflict of interest: D.H. has provided paid expert testimony on behalf of public health authorities in response to legal challenges from the food and beverage industry. Authorship: D.H. led the design and administration of the study. R.B.A. led data analysis and writing of the manuscript. Both authors formulated the research questions and edited and reviewed the manuscript. Ethics of human subject participation: This study was conducted according to the guidelines laid down in the Declaration of Helsinki and all procedures involving human participants were approved by the University of Waterloo Ethics Committee. Written informed consent was obtained from all participants.


