

The Chairman (Mr N. J. B. Reilly, F.I.A.): Good afternoon, everyone. Welcome to the health and care hot topics event.
Our first speaker is Louise Pryor from Callund Consulting. She will be discussing the impact of climate change on health. Louise has had a varied career as an actuary, a software engineer and an academic. She currently works as a consultant specialising in climate change in insurance and social security and pensions in developing markets. She is a member of Council and is just about to take over as chair of the Resource and Environment Board.
Dr L. M. Pryor, F.I.A.: The environment is a really important factor in our health. The World Health Organisation (WHO) says that 23% of worldwide deaths and 22% of the worldwide disease burden can be attributed to the environment.
Climate change, of course, is a major force acting on the environment. Thus climate change is bound to affect health. The question is: “how will this happen?”
I only have time to give a summary of the issues. There is rather more detail in my paper, which is available on the website, but that itself is only about a 20-page summary of three or four major reports, each of which is 300–400 pages long.
However, my paper does provide signposts to these other major reports. So, if you want more detail, go first to my paper and then follow up the references from there.
Figure 1 shows some of the effects of climate change on health that have been identified. You can see that there is a huge range here. These vary from things that you would automatically think of, such as temperature-related deaths, to some other ones that might not have necessarily have come to mind.
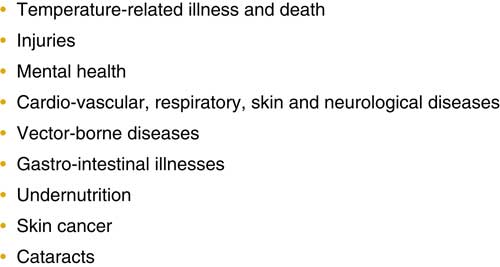
Figure 1 Health effects of climate change
There are also indirect effects that are not listed in Figure 1 and that I will be talking about later. These are related to the possible situation where climate change might cause large-scale alterations to the earth’s natural systems, with effects on food and water security, population displacement, and so on, which themselves can have knock-on effects on health.
One of the themes of my talk is that all these issues are very complex. There are a lot of different things going on that affect each other in a variety of ways.
The effects of climate change on the environment are themselves pretty complex. Figure 2 shows changes in temperature, across the top row and precipitation across the bottom row. Down the columns, the left-hand side is a scenario where there is a 2°C increase in average global temperature. Keeping the increase down to 2°C is going to require a lot of action from governments and from society as a whole. The column on the right shows a scenario which is pretty much business as usual, what will happen if no real changes are made.
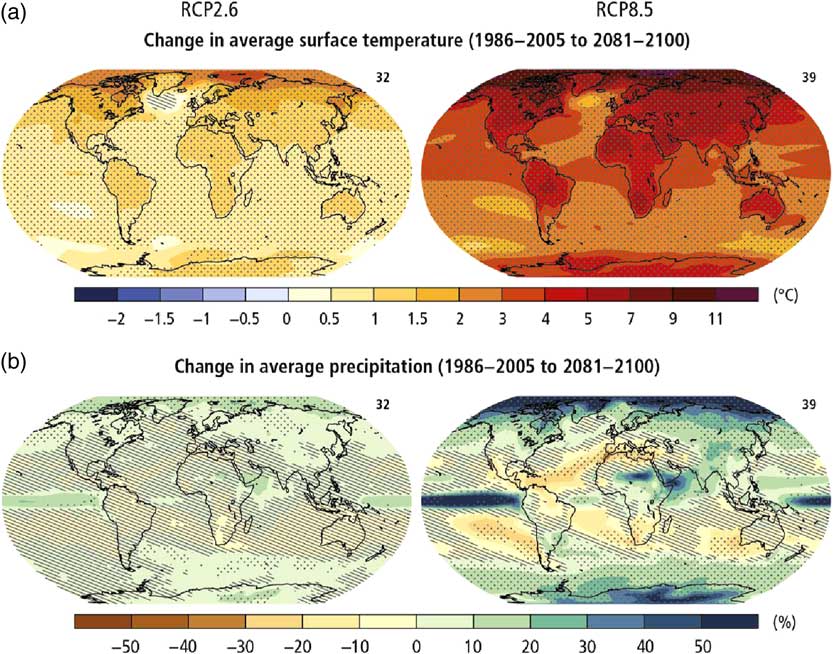
Figure 2 Climate change impacts are complex
We can see here that the effects vary quite a lot not only between the scenarios but also by location. The actual effects are going to depend very much on where you live. The effects are even more varied at a scale below that seen on these pictures. There will be huge differences between individual local micro climates.
It is, of course, weather, as a whole, rather than just temperature or precipitation, that really affects our day-to-day lives and health.
One way of looking at this is through the actuaries’ climate index that has been developed by the North American Actuarial Associations. This has six components for different aspects of the weather: high temperatures, low temperatures, high precipitation, drought, high winds and sea level. The index at the moment just covers North America but we are looking to see whether it can be extended to cover the United Kingdom and Europe (Figure 3).
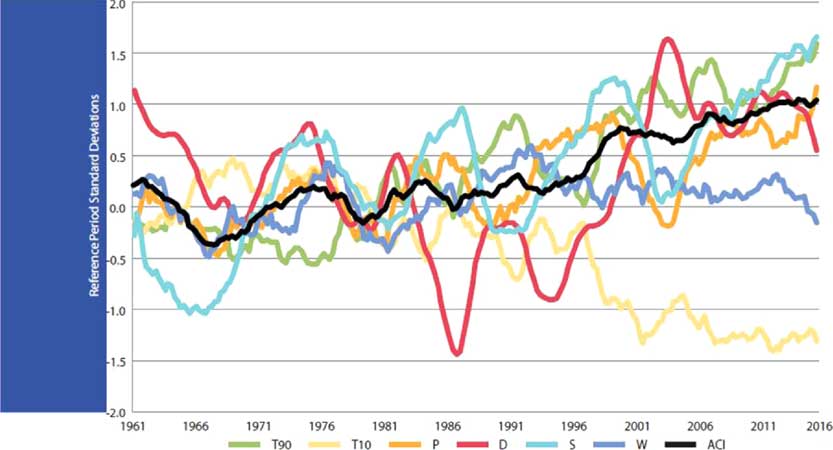
Figure 3 Actuaries climate index
You can see that, on the whole, extremes of weather and sea level have been becoming more frequent over the past 20–30 years.
Looking at the climate and weather is all very well, but how does this then feed through to health? It feeds through in some very complex ways indeed. First, of course, it feeds in through environmental conditions. For example, high temperatures have a direct effect on health. But also high temperatures can also affect, say, the breeding conditions for disease vectors such as mosquitoes. Precipitation, and other factors, can also affect those things.
However, these direct environmental effects are mediated by social and political conditions. So the outcomes depend on factors such as what the healthcare system is like and whether the politicians put disease control measures, such as mosquito controls, in place. These factors, of course, are affected by economics and what can be afforded. Changes in demographics also have an influence.
All these things interact in extremely complex ways. Economic conditions can depend on what the social and political conditions are, which themselves are then affected by the economic conditions and the demographics, so you have complex interactions and a lot of feedback mechanisms.
It is very difficult to predict what might actually happen, especially given the uncertainty of the underlying detailed effects of climate change.
There are going to be both direct and indirect effects of climate change on health. Also, of course, some effects are going to be beneficial. So, for example, in the United Kingdom, it is entirely possible, although there is some argument about the exact size of the effect, that the number of cold-related deaths might decrease. That, of course, actually depends on other factors such as changing demographics, because it is older people who are more susceptible to cold-related deaths. On the other hand, there will certainly be more heat-related deaths that might outweigh the beneficial effects of reduced cold-related deaths.
In temperate climates, such as Britain, people may become more active as it becomes more pleasant to be outside, so they may also have better vitamin D uptake. This clearly could have beneficial effects.
The other thing is that actions that are taken in order to adapt to climate change, and to mitigate climate change, might have effects. For example, one of the chief mitigation mechanisms is to try to cut back on emissions of various gases, and that could improve the air we breathe, which will have knock-on effects on health.
On the other hand, some of the adaptation mechanisms may have negative effects. In Britain, for example, efforts have been made to cut fuel consumption by providing better insulation, both domestically and in hospitals and care homes. The aim is to make buildings warmer in the winter to reduce spending on heating and hence carbon emissions. Unfortunately, buildings may then overheat more in the summer so that you have more heat-related deaths and illness.
The complexity of the issue means that, just because it is on average getting warmer, you cannot tell what the detailed effects are going to be on all the different types of health conditions.
In the United Kingdom, every 5 years there is what is called the climate change risk assessment. The Government has to produce that by law. There is a large, evidenced, report, underlying the risk assessments.
In one substantial volume, the report covers health and other factors relating to human society. This is where I have obtained most of the information in my paper on the potential impacts in the United Kingdom.
Flooding turns out to be one of the major climate-change-related risks in the United Kingdom. It is fairly obvious that flooding may result directly in deaths and injuries. It also has less obvious indirect effects. The operational risks of flooding can be quite severe.
Many health facilities, such as hospitals and GP surgeries are themselves subject to flooding so that will reduce the availability of health care. The chaos caused by flooding, as well as possibly making it more difficult for patients to reach health care facilities, also makes it more difficult for the health care staff to reach the facilities. So that also reduces the level of health care available.
You have to think not only of the direct effect on peoples’ health but also what the operational effects are on the health care system and how that can affect the overall picture.
In the United States, you will see a somewhat similar list to the United Kingdom although they do not classify things in the same way. So, for example, they classify mental health and well-being as a separate item.
In the United Kingdom, these effects are taken into account but are included in the effects of particular events such as flooding which is known to have bad effects on people’s mental health and well-being. Although the United Kingdom and United States lists look somewhat different, some of that difference is just down to difference in classification.
However, I think some of the other differences are because the United States is a much larger and more geographically diverse country than the United Kingdom. As we saw, the effects of climate change on local conditions can vary quite widely. Because the United States covers such a large geographic range, there is going to be more variation in the local effects of climate change.
The southern United States, in particular, is verging towards the sub-tropical regions, where there are going to be a lot more significant effects on disease vectors than there are in our chilly Northern climes.
Overall, world-wide, it is difficult to draw generalisations. What we can say is that the effects are likely to be more severe in the tropics and in the polar regions. This is because the direct climate impacts tend to be more significant in those regions. Some of the poorer countries tend to be in these areas, especially in the tropics, and they have less-developed health care systems and are likely to be less able to put disease control mechanisms in place.
We also see in both those regions more communities depending directly on the environment for their sustenance. Those types of communities, as well as being poorer, will also feel the impact of environment change much more severely.
In summary, the indirect effects that we were talking about: the effects on food security, water security, population displacement, and so on, are likely to be much more severe in the less well-off countries, which are going to be less able to handle the effects.
Overall, my feeling is that we in Britain are comparatively lucky. We will see some effects but they are not likely to be to the extent and depth that are going to happen in other parts of the world.
In terms of activities for actuaries: more structural modelling, trying to tease out the effects of all the pathways, and so on, would be helpful, but it is really difficult to do.
It is particularly difficult to handle all the social and economic conditions in the models. My main theme is that, as actuaries, we have to be very aware of the limitations of our models. I suspect many of the models that we are seeing have a lot of implicit assumptions. Because the area is so complex, you really have to think carefully about these implicit assumptions, which tend to assume no change in some important dimensions, such as the availability of health care. Are those assumptions likely to be warranted? It is likely that the economic transition to a low carbon economy is going to have quite significant economic impacts which will affect the availability of health care and the willingness of politicians to provide health care. These knock-on effects will, I suspect, prove to be pretty important. I also suspect that most of the models do not account for them.
So, “be very, very wary” is my advice. Thank you very much.
The Chairman: We will do a question and answer session following each presentation.
Mr N. Aspinall, F.I.A.: I am really struck by how some of the reports you were discussing may be less about actuarial topics than about guidance for policymakers as to how to mitigate some of these effects. I wonder whether you could comment on how well you see this has integrated into government policy, either in the United Kingdom or the United States.
Dr Pryor: I think in some parts of government in the UK people are very aware of the effects. In others, they are not.
For example, the climate change risk assessment does point out an increase in temperature-related deaths due to overheating is really quite likely. However, the local planning regulations come from different local governments and the pressure on them is to build more housing. Thus they are very unwilling to put more constraints on the housing that can be built because their targets are basically expressed in terms of the number of houses built rather than whether those houses drown or roast people to death.
World-wide, there is a very interesting report which has just been issued. If anyone wants to Google “emerging markets symposium environment health”, they will find a major report on the environmental effects on health in emerging markets. They have a very long list of recommendations for governments about what can be done. The fact that the list is so long tells you something about what governments are currently doing about it.
Mr S. K. Reid, F.F.A.: Just picking up the point about the relevance of this for practicing actuaries. For some business lines, motor or home, it is an immediate issue, e.g. flooding can have an immediate impact today.
What timescales are we talking about for health care and mortality and morbidity rates?
Dr Pryor: The timescales vary by the type of effect. I am not good on the detail on this. I am afraid you need to go back to the original report and look at it. Rabia (Navqi) is going to have something to say on this issue.
The Chairman: I noticed that you said we have been lucky compared to others.
How lucky would the United States be compared to the United Kingdom for example?
Dr Pryor: I do not know. Quite a lot depends on the political outlook. I suspect that they will have more problems just because they have more extreme climatic weather conditions than the United Kingdom.
For example, they already suffer more from wind storms. Unlike us they have hurricanes. With those sorts of things any change is going to affect them much more than it affects us.
Whether the politicians are going to be prepared to put disease control measures in place, or indeed, whether they have the mechanisms that can do that with some of the vector-borne diseases I do not know.
The Chairman: Thank you very much to Louise (Pryor).
Our second speaker is Rabia Naqvi. She graduated in 2001 with a first-class degree in Mathematics from Trinity College. Since then she has been in actuarial consultancies, in particular, she has been a Senior Actuarial Consultant with Willis Towers Watson and worked for several other related companies.
She is currently pursuing a PhD in actuarial science at the School of Mathematics and Statistics at University College, Dublin.
Ms R. Naqvi: The topic of this presentation concerns an exploratory analysis governed primarily by the topic: “Climate Change: reshaping mortality differences within the United Kingdom”.
Being an exploratory analysis, it uses a simple model. Simplicity should always precede complexity to my mind to try to uncover some general trends and features.
Whilst this is a health and care issue, there is no more unambiguous measure of health than mortality. Accordingly, we can consider some of the assertions that can be made with respect to mortality, particularly in the context of climate change.
Age matters, with the older age groups tending to be those that are most severely impacted by climate change.
Geography matters; in the United Kingdom, Scottish mortality is significantly higher than mortality in England and Wales. The usual way to explain this disparity would be socioeconomic factors. Of course, that is substantially true but increasingly it is becoming less able to explain the regional mortality differences such that consideration of environmental influences is necessary.
The climate in England and Wales, like Dublin, Ireland, is much akin to an assault course with many ups and downs. In fact, it can be worse in Scotland which is generally wetter, windier and colder. Allied with this is empirical evidence from studies dating as far back as the 1970s, more recent findings from the Eurowinter group and various other epidemiological studies suggest a U-shaped temperature mortality relationship in the United Kingdom. That is to say that there is an optimal temperature range in which mortality is reasonably low with higher mortality being found on either side of that range. That relationship also is noted in other countries although they have different optimal temperature ranges. That speaks to man’s ability to adapt. Overall, temperature, being a thermal measurement of climate change, also matters.
The elderly population in the United Kingdom as of mid-2015 represented 18% of the population. This group, which is the over 65s, is also most severely impacted by weather and by climate, and is also the primary group of interest when it comes to life policies, pension policies and so on.
The contract periods for such policies are such that climate change can have a potentially material impact on the outcomes and therefore the liabilities. So here we see that the temperature differences between England and Wales and Scotland are changing. In fact, they are increasing (Figure 4).
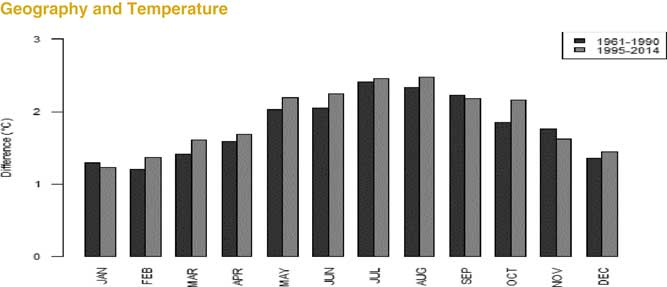
Figure 4 Temperature increases in the UK
It is true to say that in both regions temperatures are increasing. However, the range of temperature change in central England far exceeds that in Scotland. That gives rise to the very natural question of what it means for regional mortality disparities pertaining to our group of interest? To tackle this question, that is to model age and mortality with temperature data, we made use of population estimates sourced from the human mortality database and monthly death data provided by the ONS and National Records of Scotland in respect to the period 1995–2014. Additionally, temperature data were sourced from the Meteorological Office Hadleigh Centre in respect of central England in order to represent the climate of England and Wales. Data from selected Scottish weather stations were used to represent the climate of Scotland and to facilitate comparability. Moreover, UK climate projections, UK CPO9, was a source of climate change information that underlay the scenario analysis. Using the data, modelling was conducted using a generalised additive model (GAM) framework which is representationally not too different from a generalised linear model (GLM) framework although they do not come with the complexity or the implicit assumptions of GLMs. It allows more flexibility to relate multiple variables to the response without having to predefine those relationships or make those assumptions. In other words, I work non-parametrically.
That brings us to the model which is a Poisson model with a log link, so we are modelling the number of deaths with a population estimate. The model is shown in Figure 5.
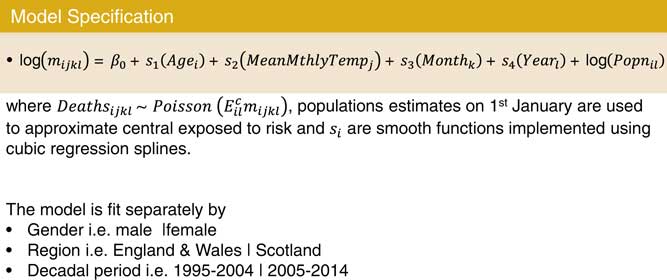
Figure 5 Mortality model
We are looking at the relationship between temperature and mortality. The inclusion of the additional factors is to prevent compounding. One might wonder why have both month and mean temperature. Surely, they are picking up the same thing. In fact, they are slightly different insofar as month is more of a proxy for seasonality than temperature as such.
By seasonality I mean seasonality which might arise if mortality has been higher in winter months due to the prevalence of certain diseases such as a flu epidemic or cardiovascular disease. The year term captures general improvements in mortality over time, for example, due to lifestyle changes. We pick up that relationship between mortality rate and temperature so that in temperature it is not being confused with everything else.
You can see the results in Figure 6. I am going to focus on males although I also did this exercise for females. You see the same general trend arising in the females although the magnitude of the differences is slightly different.
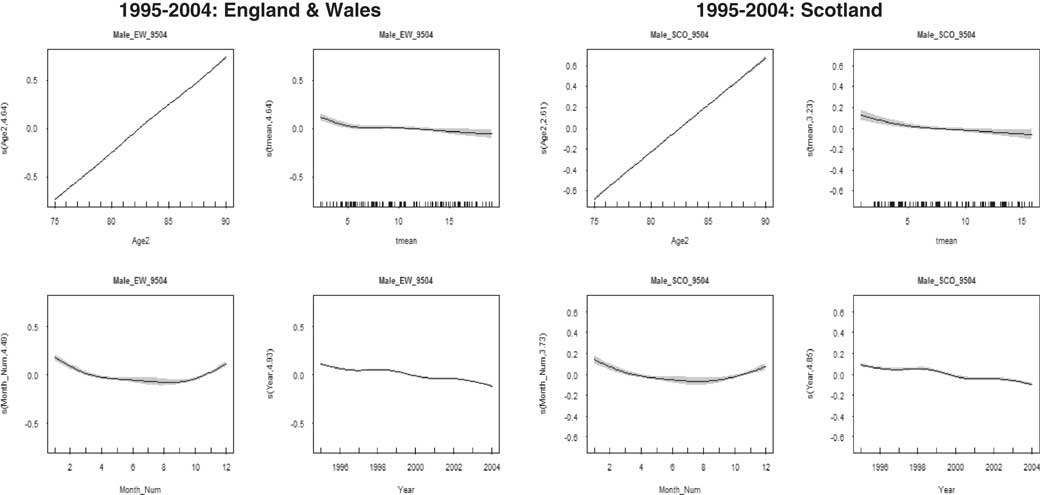
Figure 6 Males 1995–2004
We have graphs for England, Wales and Scotland for 1995–2004. In the upper left-hand corners, we have the effect of age on mortality. For both England and Wales and Scotland in both the first decade and the second decade, as you would expect, it increases linearly.
Looking at the year, the graphs at the bottom right corners for England and Wales and Scotland, it is decreasing although the effect is more pronounced for England and Wales.
It is interesting to look at month. The graph for month is in the bottom left. In both cases in this decade it is curved. You see a curved relationship indicating high winter mortality.
In the next decade, 2005–2014, shown in Figure 7 the monthly curve has flattened. This shows some de-seasonalisation and an effective response to cardiovascular disease with better health care being provided to tackle that particular problem.
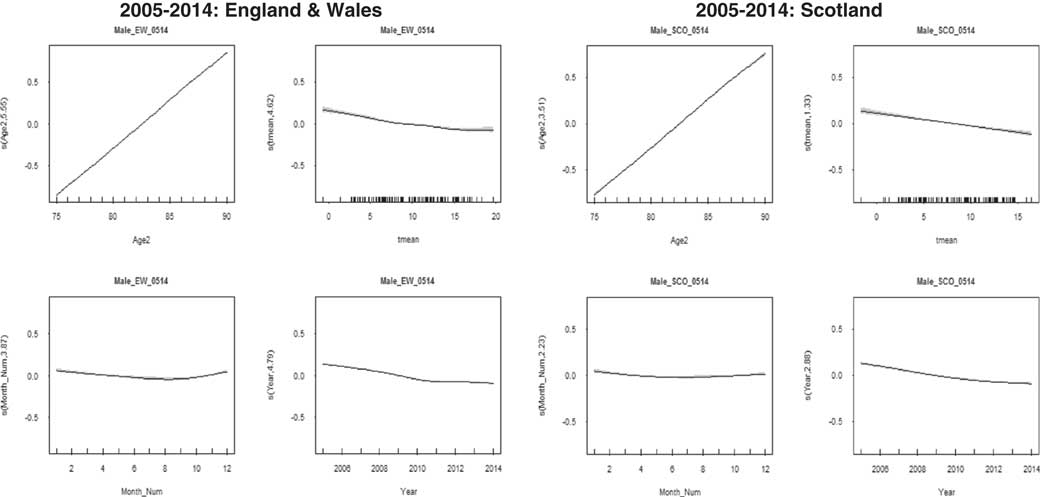
Figure 7 Males 2005–2014
We are interested in temperature which is top right in both cases. In the first decade (1995–2004), you see this curving, particularly for England and Wales. The error bands are quite pronounced because there is insufficient data at higher temperatures.
Moving on to the next decade (2005–2014), we see the temperature data available at higher temperatures in respect of England and Wales has increased. That curve does not have error bands that are as wide as in the previous decade.
The model seems to be suggesting that that U-shaped relationship is persistent in England and Wales but not in Scotland. Scotland has not reached the higher temperatures that England and Wales is reaching in the second decade. It is lagging behind.
We used information from the UK climate change projection to investigate what this means for mortality disparity.
It predicts by 2050 the temperature range in respect of winter and summer would be as shown in Figure 8.
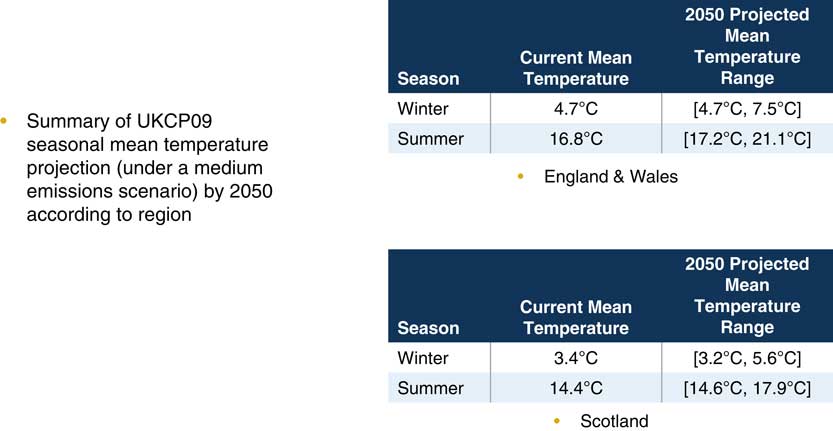
Figure 8 Future temperature scenarios
The figures are under a medium emissions scenario. In fact, if you look at the climate change projections, they tend to be the same temperature whether it is a low, medium or high emissions scenario.
What really becomes interesting is what is happening at the higher end of that temperature range and what that means for the relationship between England, Wales and Scotland.
I am using January as a proxy month for winter to put into my model.
Figure 9 shows the current situation where the difference in winter temperature is 1.3°C giving a 15% relative difference in mortality. That is Scottish mortality is 15% higher in winter.
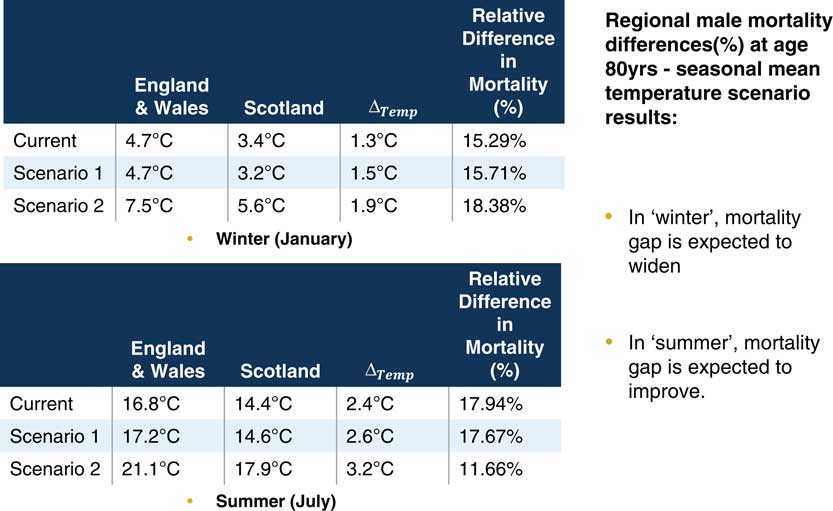
Figure 9 Future temperature scenarios – Males
In scenario 1, there is little change. Relative mortality has only moved slightly. It is scenario 2 that is interesting. It suggests that in winter the mortality gap is expected to widen.
In some ways that is not so unexpected. Warming temperatures do augur well for mortality. So if England is getting warmer at a faster rate than Scotland, then the disparity should increase. It is in the summer that we see something interesting.
If you recall, I said central England was warming at a faster rate than Scotland. So when you think of that in terms of the U-shaped relationship between temperature and mortality, it is going into the zone where mortality is accelerating. The optimal range is about 15–20°C. In scenario 2, when the temperature has increased significantly, Scotland remains in that optimal range but England and Wales move out of it. Thus mortality in England and Wales accelerates but in Scotland it does not.
I need to make a few qualifications. This is a simple model. A more complex model introducing interactions between age and temperature might be an improvement. We are looking ahead to do that.
I am not a general insurance person but I am interested in the risk management implications. Does this herald a change in how general insurance products are designed?
The Chairman: We now have questions from the floor.
Dr C. N. Reynolds, F.I.A.: You talked about potentially making a more sophisticated model. I was wondering whether you have thought about including socio-economic factors?
Ms Naqvi: Absolutely. There were a number of variables that you could include in there because, for example, the year variable is taking up a lot of things that are going on and including other variables might be helpful. The GAM framework is supposed, theoretically, not to require interactions but including higher order terms and getting a handle on some of the interactions, and including other variables would also be useful.
Mrs A. N. Groyer, F.I.A.: I noticed on one of the slides the downward sloping trend by increasing temperature. You also mentioned lack of data. Could you perhaps expand on the confidence that you have in projecting further increases in temperature given the lack of available data?
My second question is you have worked with monthly averages. Is there any research about sudden spikes within a month followed by sudden drops?
Ms Naqvi: Because it is monthly mean temperature as opposed to, say, daily temperature you are not going to see spikes in the data. It is questionable as to when more data will be available.
However, when looking at the data we have in the 5-year period from 2010 to 2014 that the number of acute temperature events had increased dramatically from the expected number.
In fact, those acute events, both heat and cold, occur throughout the year. They are not occurring solely in winter or solely in summer. You see a “de-seasonalisation”, and you see higher temperatures. Some recent reports make probabilistic climate change projections and look very much at the tails. Temperatures of 40°C are possible. That is an acute summer event but that could become the norm.
Miss M. S. Chan, F.I.A.: You showed us mortality improvement results in the model. I was wondering if you compared that to the normal mortality improvement rates for those countries, and if there is something that you can say about the degree to which mean monthly temperature accounts for model improvements.
Ms Naqvi: It only accounts for the deviance in explaining the mortality or the rate of mortality change to a small extent but it is a significant amount.
I would qualify that even further by mentioning that it is a simple model and does not include those interaction terms which I think would be very helpful in teasing out the real impact of temperature.
There is a temperature–disease relationship. De-seasonalisation has occurred not because the temperature has increased, but because of improvements in the health care system. These improvements have particularly been in respect of cardiovascular disease which was the biggest killer. In previous years, high winter mortality was not because of low temperatures, it was because cardiovascular disease was very prevalent. You have to qualify those things.
Miss Chan: Is that something you could incorporate in a future model?
Ms Naqvi: Sure. I would love to.
Dr Pryor: Talking about considering not just monthly average temperatures, but episodes of high temperatures, that is exactly the sort of thing with which the actuaries climate index will help. If we can make that available, that might enable people to have an easy way of building in these sorts of things.
Ms Naqvi: In the middle section, I alluded to possible temperatures that could occur. I am looking to model those acute events. The fact is that data suggest that those acute events are increasing in frequency and intensity.
The Chairman: Thank you very much.
Our third session is from Lisa Altmann-Richer. She currently works in the Pricing and Actuarial Department for BUPA in the United Kingdom. She is a student member of the IFoA. Prior to her work in the actuarial profession, she studied for an MSc in International Health Policy at the LSE. Her Master’s thesis focused on the role of physical activity tracking in private insurance. This has formed the foundation for her current research for the IFoA.
Miss L. K. A. Altmann-Richer: Before I start, I should also like to thank my mentor, Ian Collier, who has helped guide me for my short research paper for this evening, and also Anna Spender for her additional input as well as all the IFoA staff, Mairi, Chantal and Amanda, in particular, who have helped to facilitate the event this evening.
I should just like to see a quick show of hands for who in the room has ever used physical activity tracking devices – that is any wearable device that tracks your steps.
That is probably about half of you. I can see a few of you who have raised your hand wearing your devices today, which is even better. But for the other half of you who did not put your hand up, that might well be set to change because the wearables market is a growing market that is forecast to more than double in size by 2020. A large part of the growth in this market is going to be in the physical activity tracker industry which is predicted to have a market value of US$6 billion by 2020. This provides us with a real opportunity to use wearables, such as physical activity trackers, as tools to improve health.
It is really important that we, as actuaries, start to think about how we want this technology to become embedded in the insurance industry.
So, motivated by this, I undertook some research into the policy implications and opportunities of the use of physical activity trackers by insurers. It is these that I should like to share with you over the next 15 minutes. I am going to discuss the short term, the medium term and the long-term potential policy implications of this technology.
As a starting point for my research, I wanted to gain more insight into our current understanding of the long-term relationship between physical activity and non-communicable disease. When I say “non-communicable disease”, I mean chronic diseases. I carried out a systematic literature review and looked in particular at the relationship between physical activity and the five chronic diseases that are the most prevalent and expensive for insurers to treat. These are cardiovascular disease, chronic respiratory disease, cancer, diabetes and mental illness.
Based on a keyword search, I retrieved more than 1,000 articles for screening. I narrowed these down to 77 studies based on a number of inclusion criteria, the most important of which is that the studies have to look at the longitudinal relationship between physical activity and the risk of developing a chronic disease. The studies I looked at have to be at least 1 year in length so we could really start to focus on this long-term relationship between physical activity and health.
The 77 studies revealed a number of limitations in our current understanding of the relationship between physical activity and disease that I think will have to be overcome in the short term if insurers are going to be able to use physical activity trackers as tools to either set premiums or improve the health of their customers.
The most crucial of these limitations is the fact that all 77 studies used self-reported measures of physical activity rather than objectively measured physical activity that you obtain from a physical activity tracker.
This is a problem because although when people fill out their activity questionnaires, they might not intentionally mean to mis-report, none of us are great at objectively judging our own performance. Research has shown that correlations between objective measures of physical activity and self-reported measures are only of the order of around 0.6. This means it will be really important that over the short-term insurers start to incentivise the uptake of physical activity trackers so that they can collect more objectively measured physical activity data on their insurance population of interest.
In fact, we are already seeing insurers starting to do this by handing out free activity trackers to their customers, or providing them with discounted premiums or other rewards like free cinema tickets, if they engage actively with the technology.
However, simply encouraging uptake of the most popular devices, as they are at present, is unlikely to be sufficient to build up a very reliable picture of the relationship between physical activity and the risk of developing a chronic disease. This is because at present the accuracy of the devices that are available is questionable.
Research has shown that measurements between devices can differ by up to 20%. In fact, these devices are not great at capturing all forms of physical activity. I am a keen swimmer. On days I go swimming, although my activity tracker might record 3,000 steps, I have actually done another hour’s worth of physical activity in the pool.
In addition to improving the accuracy of these devices, it will also be important to improve the validity of the data from these devices.
If you do a quick search on YouTube for how you can build up 10,000 steps on your activity tracker without even leaving the sofa, you will see a number of suggestions. My favourite is to simply give your activity tracker to your dog who can take it for a walk on your behalf. So this points to a real need for insurers to start to build in validation systems that help prevent fraudulent use of these devices, particularly if lower insurance premium is going to be offered to those customers that achieve the most physical activity.
Fortunately, there does appear to be a short-term solution emerging for this problem. Medical grade wearable devices are starting to come to market. These medical grade devices are much more accurate at recording levels of physical activity, and this improved accuracy can even serve as a biometric fingerprint that helps to stamp down on fraudulent use of these devices.
So encouraging uptake of medical grade wearables in the short term is really important.
Although I mentioned the limitations to our current understanding between physical activity and risk of developing a non-communicable disease, the research that I undertook with the systematic literature review did find that 84% of studies showed that increased levels of physical activity are associated with decreased levels of developing a chronic disease. This is even when controlling for other factors such as body mass index, weight, blood pressure and socio-economic status.
This means in the medium term, once medical grade wearables have been used in order to gather more objectively measured physical activity data that can refine our understanding of the links between physical activity and risk of developing disease, there is a real opportunity for insurers to use the data from activity trackers in order to class policyholders according to their health risks.
By this I mean charging a higher premium for the less physically active, and a lower premium to the more physically active based upon an individual’s corresponding risk of developing chronic disease.
In fact, physical activity may just be the starting point because we are starting to see a number of medical grade wearables being developed that not only record physical activity but also track a wider range of health-related variables as well. For example, the company Biotricity is developing a bio life medical grade wearable that can not only track physical activity, but it can also track body temperature, respiration rate and ECG as well. So the way that insurers start to use physical activity data to class policyholders could set a precedent for the way that the data from these more sophisticated wearable devices are used by the industry over the medium term.
However, although insurers may be really keen to class policyholders according to their health risk, policymakers, on the other hand, may look to implement risk smoothing policies in order to help prevent customers from being priced out of the insurance market. Policymakers may be keen to ensure that the less physically active, or the otherwise less healthy, those people who cannot afford a wearable device, or those people that choose, for personal reasons, not to share their data with their insurer, are not discriminated against by being offered prohibitively high insurance premiums that prevent them from accessing the market. This tension between classing on the one hand and risk smoothing on the other is already evident in the insurance industry.
I am sure many of you were directly impacted in your day-to-day work by the ban on gender segregation of premiums that the EU implemented. This is an example of a risk smoothing policy. By contrast black box technology, and its use by the motor insurance industry in order to charge premiums to motorists according to the time of the day and the routes that they drive, is an example of how insurers are using more sophisticated forms of classing to help circumvent some of these risk smoothing policies.
In fact, the policy response to the use of physical activity trackers by insurers could set a really important precedent for the way that the data from more sophisticated wearable health technology is able to be used by the industry in the future.
So far we have taken a rather static view of physical activity. We have said that because I walk, let us say, 6,000 steps a day on average, my risk of developing a chronic disease is greater, let us say, than Nick’s risk, because he walks 11,000 steps a day, on average, and so I will have a more expensive health insurance premium than Nick.
But over the long-term, there is an opportunity to move away from the fatalistic approach and towards the behavioural change approach. The behavioural change approach sees health risk as amendable to intervention. So just because I walk 6,000 steps a day on average today, does not mean that, over time, I cannot be encouraged to increase my levels of physical activity, and thus reduce my corresponding risk of developing a chronic disease.
However, it is really important that behavioural change is brought about in the most effective and sustainable way.
Ryan & Deci (2000) self-determination theory discusses two different mechanisms by which people can be motivated to change their behaviours. The first of these is extrinsic motivation. Extrinsic motivation uses external stimuli to encourage people to undertake particular activities.
If I were to offer each of you £20 for every day over the next month that you walk 10,000 steps, that is surely going to motivate a lot of you to increase your levels of physical activity. This is because you will be motivated by the external motivator of the £20. However, what Deci & Ryan theorise is that external motivation is unable to bring about long-term sustained changes in behaviour. This is because, returning to our example, the incentive to earn your £20 a day is likely to seem less and less attractive as time progresses. In addition, when the month ends and there is no longer any monetary incentive for you to walk your 10,000 steps a day, most of you will just lapse back to your original patterns of physical activity.
We can see this empirically as well. If you think back to last summer’s craze of Pokémon GO, many people, myself included, were encouraged to increase their levels of physical activity by the extrinsic motivator of catching Pokémon. However, research published in the British Medical Journal (BMJ) by researchers at Harvard University has shown that although initially players of the game did increase their levels of physical activity by about 1,000 steps a day on average, over time the motivator of catching Pokémon was not strong enough to sustain these increased levels of physical activity. Consequently by week 6, the levels of physical activity had reduced back to their baseline levels.
Findings like these are particularly problematic because at the moment the ways that we are using physical activity trackers to encourage people to do more activity appeal predominantly to extrinsic motivation. If any of you have ever joined a Fitbit challenge, or some other activity tracker challenge, where you are competing with friends to increase your number of daily steps, that competition is an extrinsic motivator. Speaking personally, there is nothing more demotivating than never being able to top that person who has 25,000 steps on the leader board.
The incentives being employed by insurers at the moment also appeals to extrinsic motivation. Some insurers are offering discounted premiums or other rewards like free coffee for those policyholders that reach certain set goals such as 10,000 steps a day. These are external motivators, which means that they are not going to be very effective at causing long-term sustained increases in physical activity that could reduce the disease burden over the long-term.
Fortunately, though, the other side of self-determination theory focuses on intrinsically motivating stimuli. Deci & Ryan theorise that these are more effective at sustaining long-term changes in behaviour. Over the long-term, there is a real opportunity for insurers to pioneer intrinsically motivating strategies by collaborating with other stakeholders in the wearables eco-system, such as health professionals, policymakers and IT developers.
Intrinsic motivation works by communicating to the individual the reasons why they would want to change their behaviour. With the example of physical activity, it will be about communicating to people all the health benefits that increased levels of physical activity can bring them, and also helping to support them through the process of incrementally increasing their physical activity by helping set realistic goals that they can achieve gradually over time.
I would be happy to talk about my vision for the role of each of the stakeholders in the eco-system in the question and answer session.
For now, I would just like to say that I hope you can see that, as actuaries we have a potentially really important role to play in all of this. We need to bring about data-driven behavioural change. It will be really important that we analyse the data that we are getting from wearable devices in order to deduce which methods of motivation are most effective for different population subgroups, helping them to improve their behaviour, and ultimately to bring about an improvement in the health of society. Thank you.
The Chairman: Any questions from the floor?
Mr Reid: This is something I am interested in personally as I do quite a lot of running. I have two questions. First, did you come across any research published by the Fitbit trackers, and other brands, regarding what they are doing with the data?
My second question is whether you have any thoughts on how insurers and healthcare professionals can work together?
Miss Altmann-Richer: On your first point, there are some studies from 2016, and from the beginning of 2017, that have looked directly at the physical activity data coming from the likes of Fitbit, to see if these can improve health. But most of them refer to investigation periods that are not greater than 1 year in length, so there is really no indication of any long-term benefits.
The ones that I have come across do not appear to demonstrate that there is a link between increased levels of physical activity and reduced risk of disease. Obviously, it is in a very short timeframe, but so far I have seen no evidence that simply giving someone a Fitbit to track their physical activity will improve their health. That may be because people are not being motivated in the right way while they are using these devices.
This comes to your second point: it may be they are not receiving support from health professionals. There was one study in particular which seemed to show that giving someone a Fitbit could actually be detrimental to their ability to lose weight. This was because when they had the Fitbit they did less physical activity than those people who did not have a Fitbit but went to regular sessions with a health professional to guide them to be healthier. The people with the Fitbit people did also attend sessions with the health professionals. But the researchers found that there was the feeling that they were doing enough simply by wearing the Fitbit.
There is a real need for policies to encourage people or insurers to collaborate with health professionals. At present, people can switch insurers pretty easily. There is not a strong enough incentive for insurers to invest in the long-term health of their customers because a customer might not develop a chronic disease until 30 years down the line. But meanwhile they could have gone off to another rival insurer.
A stronger policy incentive could be a big help in that area.
Ms R. Naqvi: Can I suggest that those studies based on Fitbits may be slightly biased. Half the people in the room have used it, half have not used it. Does that speak of the type of people who go for those devices?
Miss Altmann-Richer: That is definitely a point to consider. One of the studies involved giving wearable devices to corporate customers who had self-selected. In the particular study I mentioned about the weight loss trials, these were people that were not physically very active but were selected randomly in order to take part in the study.
I have come across one finding that physical activity could potentially long-term reduce risk of disease based on objectively measured physical activity. That finding, however, was from an insurer that was in partnership with a wearable provider so you have to be a bit sceptical about it.
Ms H. Y. A. Hung, F.I.A.: From a health insurance perspective, I was wondering what the short-term impact is on acute conditions like musculoskeletal disorders (MSK). Do you think improving physical activity could increase MSK claims, for example?
Miss Altmann-Richer: I think that is a really interesting point. It will be definitely something that insurers need to be aware of when they are going out and encouraging people to walk 10,000 steps a day, which is a great arbitrary target. These targets are not going to be suitable for everyone.
An overweight 50-year-old would need a very different exercise program to a 20-year-old who does quite a lot of exercise. I think the current focus of the market on simply encouraging everyone to achieve the same target of physical activity is a bit misguided. It will be interesting to see more data collected about how this impacts on injuries to clients within the corporate world, and, more generally other customers. But by collaborating with health professionals, and others in the ecosystem, there could be a real opportunity to help prevent some potential injuries caused by the use of these devices.
Mr A. L. Jinks, F.I.A.: In the United Kingdom, most people do not have private health insurance and rely on the NHS. Was there anything in the study that talked about or looked at the interaction between Fitbits and reliance on a public health service? Do you have any views on where that might be of use in the future?
Miss Altmann-Richer: The studies I looked at were not just UK-specific. They were very general. But in terms of the ecosystem I presented to you, policymakers are going to be key stakeholders. This is because there is a huge risk that only those people that can afford private medical insurance will be encouraged to improve their behaviour through these devices.
I think a more general approach, where policymakers collaborate with the NHS in addition to private insurers, could help to prevent social inequity arising.
Mr M. R. M. Elsheemy: I just want to comment on the NHS. I know that the NHS is trying to use some of the health technology. They have already commissioned use of health apps in some neighbourhoods in London.
It is a vision that, in the future, in the next 10 years or so, everything will be improved. There will not be wearable technology any more. Bots will be telling us what is healthy. Personalised apps will measure your heart beat and every other factor. It will tell you exactly what will be suitable for yourself.
Miss Altmann-Richer: One of the key stakeholders are IT developers who are going to play a really important role in ensuring that this technology can be centralised so that all the different players in the ecosystem, such as the health professionals, the insurers, the NHS, can collaborate together.
There is definitely the opportunity for people to have their own personalised medical records available that they can share with their doctors and track a long history of their variables like heart rate and blood pressure.
The Chairman: Thank you very much, Lisa. Our last speaker is Nay Wynn. He is a research actuary at Hannover Re UK life branch. His responsibilities include reviewing and updating the central basis for the major product lines. He has a strong interest in critical illness trends and is keen on developing a number of possible scenarios and considering their potential impacts on the insurance industry. He recently published a front cover article in The Actuary magazine entitled “Cancer-Free What If?”.
Mr N. L. A. Wynn, F.I.A.: Thank you very much for the opportunity to make this presentation. The subject is “What if artificial organs were sufficient enough to replace the need for donors?”.
I will, initially, go through a brief history of organ transplants. We will look at why the waiting list exists by looking at the demand side and the supply side of organs.
Finally, there will be a section on the impact on critical illness (CI) and term assurance products. That will be split by short-term, medium-term and long-term.
In terms of history, the first documented case of an organ transplant was 3,000 years ago. I was quite surprised it was so long ago. In fact, it is a very well documented case of a skin transplant in India. The Indian surgeon created a compendium of all the surgery and surgical procedures. It was very detailed and covered about 184 chapters and over 1,000 diseases.
It was a skin transplant to help deal with damage to the nose. Skin was taken from somewhere else. There was not much of an issue with rejection because the skin was from the same person. Organ rejection issues are something which we will come to.
In the 16th century, the skin transplant techniques were revised in Italy.
In terms of organ transplants, history becomes a little fuzzy. It depends on whether you are talking about an animal to animal transplantation, animal to human or human to human. It also depends on what the reason for transplant is. I decided to look at transplants to treat organ failure.
The first documented case was in 1906 in France. There were two patients. One was a transplanted case of a pig’s kidney, the other was a goat’s kidney. Survival times were very poor. One survived 3 days, the other 8 days.
The main issue with transplanting from animals to humans was organ rejection. They did not really have dialysis machines then so there was not any real alternative.
The first successful transplant using human donors was in Poland. This was successful in the sense that the transplanted organ functioned in terms of producing urine but it was not successful because the patient survived for only 2 days.
A number of reasons were cited. The donor kidney was not well preserved. There was a mismatch of blood groups. The patient was a lady who tried to commit suicide by injecting mercury. The conclusion from the autopsy was that the mercury had done too much damage.
We had to wait until 1954 for a truly successful kidney transplant. It was successful because it involved two brothers who were identical twins. The transplanted patient survived for 8 years afterwards. The reason for the success was that there was no issue with organ rejection.
The first successful case of a liver transplant where the person lived for more than a year was in 1967. There is a bit of history with trial and error prior to those years. The main way that it evolved to be successful is that they managed to use immune-suppressants to suppress that patient’s immune system which meant it did not reject the organ.
The first successful human heart transplant was performed in South Africa by Dr Christiaan Barnard, the brother of Marius Barnard who introduced the critical illness product.
The outcome was successful in that the heart performed its function. However, the survival time was poor. The patient survived 18 days. It was not until the 1980s that the survival times started improving because of improvements in technology.
That takes us to where we are now. In terms of survival rates, the improvement is quite astonishing, really. We are talking about 1-year survival rates in 2011–2014 of around 93% for kidneys. That is remarkable. When you need a kidney transplant, you are really close to death as both organs have failed.
If you look at the graph on the right of the Figure 10 the 5-year transplant survival rate for kidneys is 90%. There have been improvements in 1-year survival rates and even higher improvements in 5-year survival rates.
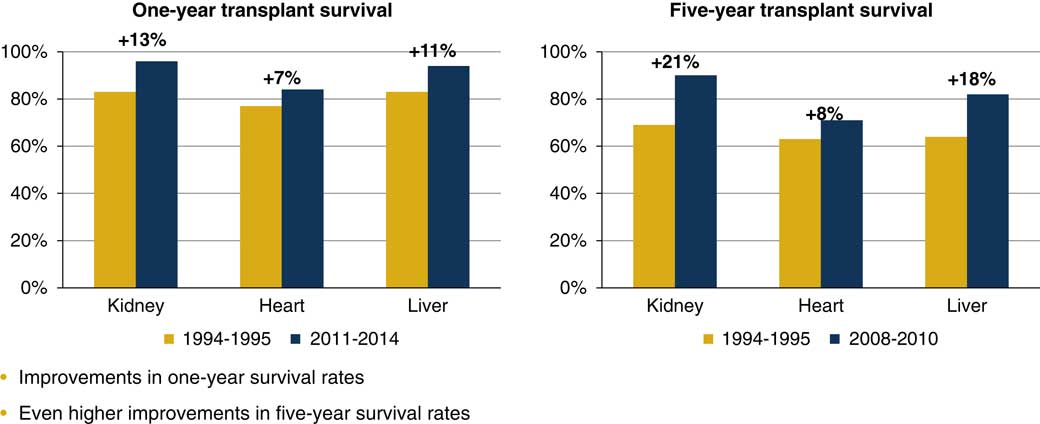
Figure 10 Survival rates
If we turn our attention to the waiting list, you can see in Figure 11 the graph that summarises the situation in the United Kingdom. The line corresponds to the vertical axis on the right. We have around 6,500 people on the waiting list. The gold bars that you can see are the number of donors. The blue bars are the number of transplants.
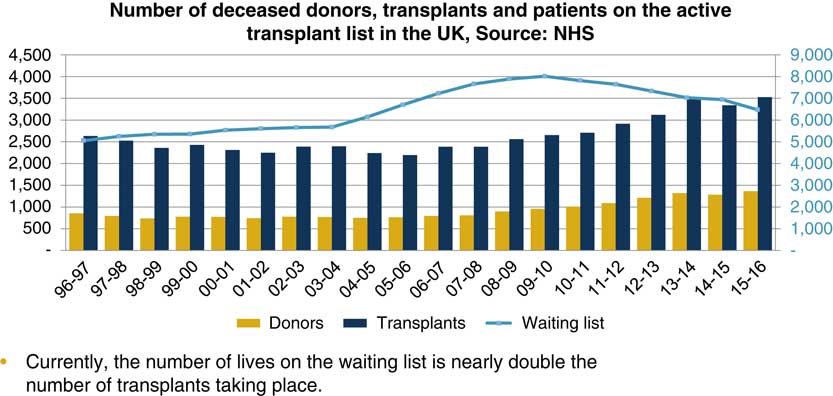
Figure 11 The waiting list
I read somewhere that one human donor can save up to eight lives, one with the heart, one with the lungs, et cetera. That is in perfect circumstances, when we find perfect matches and everything goes accordingly to plan. In reality, you are looking at one donor, saving about three lives.
The number of lives on the waiting list is nearly double the number of transplants taking place. The issue is that the demand is so much higher than the supply. That is quite a sad thing because in 2015–2016, 479 people on the waiting list died because they had not found a match. That is around 7.5% of those on the waiting list.
The waiting list exists because there is more demand than supply. The demand-side factors are lifestyle habits, diseases, accidents and senescence which is the general ageing process. You can accumulate wear and tear on your organs and that means you eventually need an organ replacement.
In terms of the supply, you have human donors, xeno-transplantation, from animal sources, and artificial organs. The national organ donation consent stance can also have an impact on the overall supply.
Another factor is the NHS budget that is more of a political thing. That has an impact because it will affect the number of surgeons, nurses and other resources available.
We can consider the detailed reasons for the demand. If you take excessive drugs or alcohol it will increase your risk of liver disease or kidney disease. If you smoke a lot then you will need new lungs eventually because the lungs fail. Poor diet and obesity can lead to you requiring a heart transplant. It can also lead you to develop diabetes which in turn will require you to have a kidney transplant.
The magnitude of accidents is very low in the United Kingdom relative to what they were over 50 years ago. Poisoning and physical trauma, however, still do happen. In those cases you might need an urgent organ transplant. Senescence is also a factor.
Just to give a brief overview, in terms of the 6,500 cases on the waiting list, around 78% of them are for kidneys, 9% for livers, 6% for lungs and 4% for heart transplants.
In terms of the supply, 100% of the organ transplants are from human donors. An important issue is the availability of these organs. Another issue is organ rejection. You need to match everything up perfectly.
We mentioned before that immuno-suppressants can be used to reduce that risk of organ rejection, but there has to be a careful balance. If you start suppressing the immune system, you then open the patient to the risk of viral and bacterial infection.
Xeno-transplantation has not been a strong contender for organ transplantation in the past. The main issue was transferring. A pig’s heart is fairly similar to a human’s heart. But it is not perfect. There are also issues with passing on viruses from animal sources.
There has been a recent advance in gene editing tools, using Clustered Regularly Interspaced Short Palindromic Repeats (CRISPR) which has caused a revived interest in this area.
An article in the Daily Telegraph, published in January this year, spoke about scientists inserting human stem cells into pig embryos and then letting the embryos mature for 3–4 weeks to check the state of the heart. Essentially, the aim is to breed pigs to grow hearts of human cell origin in which case you would sort out the transplant problem. There are various ethical challenges associated with this procedure. We need to go through those first, perhaps.
The impact is that the organ will be 100% human so that chance of rejection is reduced and also you can mass produce organs.
I will briefly discuss organ donation stance. Back in 2008, the default stance was an opt-in stance. If you wanted to donate an organ, you had to sign to a register to say that you were happy to donate in case you die.
In 2008, a review was carried out by the Organ Donation Task Force. They said that the opt-out stance should not be introduced in the United Kingdom at the present time. The reason for that is that it is too costly, and it may not increase organ donation rates. You could spend that money on something else and perhaps obtain a better return on your money.
Currently, England, Scotland and Northern Ireland have an opt-in stance. If you want to donate, you have to opt in. Wales has developed a soft opt-out system as of December 2015, which is essentially presumed consent. If you were to die, then they can harvest your organs. You can, however, opt out of this. Obviously, this system changes the supply of organs. The pool of organs that is available is massively increased.
I have seen a few articles on this topic. It has increased the number of transplants taking place. Perhaps we will have another review in the rest of the United Kingdom.
In terms of artificial organs, the technology has become quite advanced. In terms of kidneys, the University of California, San Francisco have created an artificial kidney which is the size of a coffee cup and it functions well.
They are raising money, they have raised $7 million out of the $8 million that they need. Once they have raised enough, they are hoping to start full human trials this year and then publish the results probably around 2020.
As I mentioned, 78% of people on the waiting list are waiting for kidneys, so that could be a huge valuable source and wipe out that waiting list.
The Wake Forest Baptist Medical Centre has been growing kidney cells and placing them into renal devices and implanting them in animals. That was quite successful so they extended it to produce a kidney using bio printing.
You can actually print a kidney. They have not done tests on this, but it does look very promising.
Bio printing, which is a form of 3D printing, is very advanced now which is very exciting. You can print capillaries and put in human cells which can take the shape of the organ and function well.
The same organisation has been trying to set up human cells to create a liver, but that is quite challenging.
In terms of creating liver cells, we are currently stuck with large dialysis machines such as the molecular adsorbent recirculating system and bio-artificial liver device systems. I have not really come across anyone that has successfully created a small liver for artificial transplantation.
I think that that the most exciting developments concern the heart. The SynCardia totally artificial heart is currently used as a stopgap between those needing a heart transplant and those on the waiting list. Eventually get rid of the artificial heart and give people a real human heart when one is available. Their marketing brochure mentions that over 32 years of use, the valves in the artificial heart have never failed, and they have done at least 1,700 implants which accounted for more than 580 patient years of support. So the technology really is out there.
You can see a picture of the heart in Figure 12. The wires continue down from the heart and you have a pack which you carry with you. The heart works in a very similar way to the real heart. It just mimics the pipes and the tubes in the correct way so that it is easy to transplant.
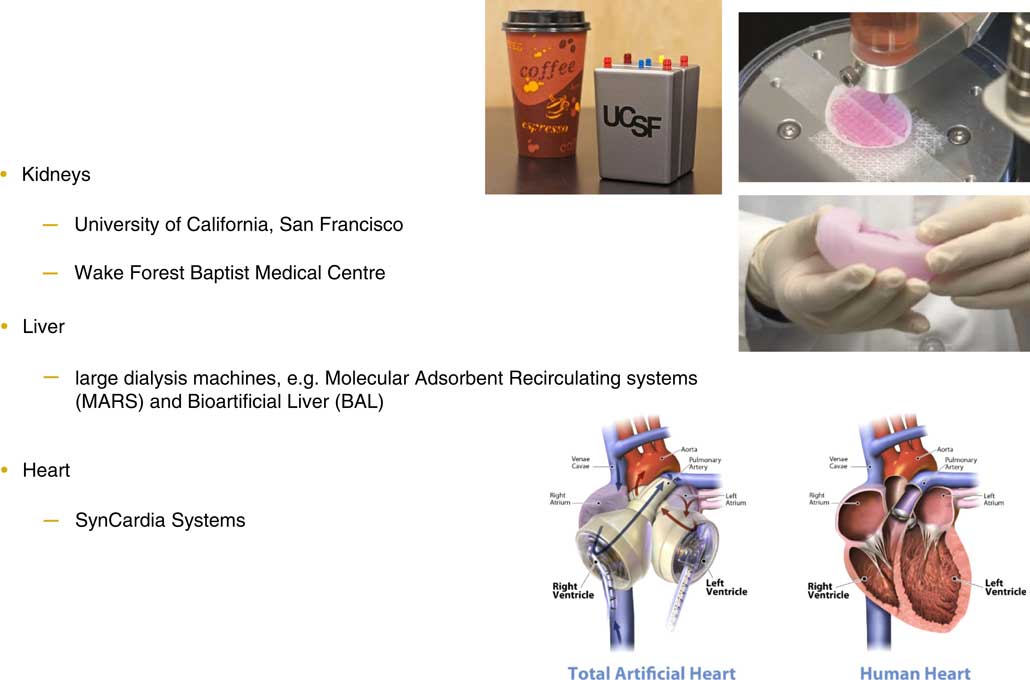
Figure 12 Artificial organs
Now we come to the impact on critical illness. In the short term, I would argue that artificial organs, great as they are, probably will not have any impact on critical illness pricing. The main reason is because of the wording on the relevant condition, which is major organ transplant. It says that a pay-out will be made if you are included on the official UK waiting list. It really does not matter whether you get an artificial heart or a human heart, you will have the pay-out regardless. Even if you had a number of artificial hearts, it would not affect the price.
In 2014, the statement of best practice added a phrase: “from another person”. That could have an impact in the medium or the long-term. In the medium term, which I would say is probably around 5–25 years, the impact varies. The availability and reduced risk of organ rejection are the two main advantages for artificial organs. Given this, they could become the preferred choice for organ transplants.
The main argument for the impact to occur is that artificial organs will essentially wipe out the waiting list. In that case, it matters whether your transplant is from a human source or an artificial source, based on the current wording.
I did some modelling about this. The magnitude of the effect is fairly small. The reason is that major organ transplant rates themselves are very small compared to those of heart attacks, cancer and strokes.
In the long term, I would argue that the impact may be much more significant.
There are a few relevant issues to consider. Bio artificial organs are organs grown in the laboratory using human cells. Technically these are not from another donor and perhaps the insurer should not pay out. On the other hand, they come from human cells so the exact interpretation of the wording is important.
Other critical illness conditions could also be impacted. The rates of liver failure and lung failure according to the CI definitions could be reduced just by applying artificial organ transplants.
Potentially, in the long term, artificial organ transplants could become quite a routine procedure. You could reach the stage where you start to replace organs before the patient becomes very ill. It could also then start having an impact on cancer rates. If you had a localised cancer in the liver you would just replace your liver. It would not be necessary to go through radiotherapy or chemotherapy. The rates of other diseases could start reducing. The magnitude of this is very uncertain. There would be social and cultural impacts to take into account. Potentially, the price of critical illness may start to reduce.
The impact on term assurance is quite straightforward. The main argument is that instead of the person dying right then, they could die maybe 4 years later, because they would have an artificial heart in place.
A person using the SynCardia artificial heart system lived for 4 years before they received a human heart. Effectively, death is delayed. So you could have mortality improvements in the short term. Again, the impact will be small because very few people need organ transplants. In the medium-term broadly the same arguments applies.
In the long term, if you start reducing the chances of death from cancers by having, say, artificial livers or lungs, you could start seeing mortality improvements.
In conclusion, there are substantial advances in organ transplantation technology. Artificial organs could be the key to solving the shortage of organs. The impacts on critical illness and term assurance products could vary massively.
I think we have to address two main questions. First, should we review the current organ transplant definition? This is actually currently taking place. The last review was in 2014. Second, could advances in transplant technology help us create better insurance products? Thank you.
The Chairman: We have a couple of minutes for questions.
Mr Reid: Since we are talking about scenarios, it is a good idea to look at scenarios of what may happen in the future.
On the demand side, for example, if artificial organ transplantation became very common and very successful, do you think that will drive up demand for it which could lead to a greater impact on critical illness and other products?
Mr Wynn: It is quite hard to know because there are ethical concerns which are hard to judge. It really depends on how far people in general take it.
There are also questions regarding sport. For example, should people with better artificial hearts be allowed to compete?
The Chairman: Given some of the incidents that we have seen recently with the hearts of footballers, theoretically better screening and review could lead to fewer incidents. If hearts were plastic, then everyone in sport who had a possible issue could have one, I suppose.
Mr Wynn: Yes, I guess so. The governance around it will depend on how advanced artificial organs become. I did not mention it in my presentation, but there are other ways of treating organ failure in general medicine.
You could have better advances in immunotherapy so you could treat cancer by that rather than replacing organs.
Maybe in the very long term, beyond 25 years in the future, you could start seeing part machine/part man constructs walking about.
Dr Pryor: I can imagine artificial organs having activity trackers built into them!
Mr Wynn: We can work together on this!
Miss N. J. Edwards: On the point that Louise (Pryor) raised, there are some technologies starting to do that. From a personal stance, I have something called a spinal cord stimulator implanted because I have a nerve damage pain condition. There is a geospatial tracker in it that can tell the position of my body.
There will be very major advances in the future in the medical world of which are just seeing the beginning.
Mr Wynn: That is really good to know. I guess the issue on the governance side is what information insurers will ethically be allowed to use. That is the big question.
I think an important challenge is to address the point made by Lisa (Altmann-Richer) about whether you should classify people at a personal level and offer the premium that matches the risk or whether you should have combined risk.
The Chairman: It was mentioned that every 3 years definitions change. Could that be quicker if needed? Could we be a little bit swifter if an issue came up or will we miss the boat?
Mr Wynn: That is a good question, but it is outside my ability to answer.
The Chairman: Perhaps everyone could think about that one when they go back. Thank you very much to Nay (Wynn).
To give a brief summary, we have had four excellent but very different speakers. The main thing that I took from Louise (Pryor)’s talk was that there is a lot of uncertainty in this area. The one thing that I definitely took from this is that the United Kingdom is luckier than the United States although perhaps we should not be too certain even about this.
To discuss Rabia (Navqi)’s presentation, it was clear that the difference between Scotland and the rest of the United Kingdom is very pronounced. In the figures, we saw the potential differences in the improvement of the two mortality rates in the future. What I took away was to beat England, Scotland need to burn a lot more coal.
I would like to thank Lisa (Altmann-Richer) for her presentation. It is not a surprise to realise that catching Pokémon and Pokémon Go lasted only 6 weeks. We needed a little bit of external stimuli in that case. Lisa will always be disheartened by the fact that I do 11,000 steps and she does only 6,000.
Nay (Wynn) was slightly depressing in that instead of opting in for organ transplants, we are all going to rely on pigs’ hearts.
The last thing that I would like to say is thank you very much to all four of our speakers. Thank you to the people they referenced in the papers and also thanks to all of you for your questions coming on this very hot evening.


 Open access