


Introduction
The methodological problems of ground and remotely sensed data handling are as important as the technical challenges of the field. Whilst most large-scale operational systems for monitoring snow, ice or water make sophisticated use of ground data and specify techniques through which they are integrated with remotely sensed data, the same is not always true of small-scale research applications. Simple procedures are required to incorporate ground data within the research design. For operational purposes, it is also necessary to specify precisely the processing of the remotely sensed data and its influence on the radiometric purity of the resulting data set.
Basic techniques in three interlinked contexts of relevance to glaciologists or alpine hydrologists are considered here. First, the use of ground radiometry in image interpretation and to provide a quantitative basis for classification. Secondly, the recognition of atmospheric and shadow effects. Thirdly, the comparison of geometric correction and re-sampling routines which are used to provide cartographic fit, but which may have an influence on the radiometric quality of the data. The techniques are evaluated using Landsat Thematic Mapper data for southwest Switzerland from a scene dated 7 July 1984, path 195/row 028. Ground radiometry was undertaken from 5 to 9 September 1985.
Ground Radiometric Data
Ground radiometry provides an insight into the radiometric response of specific surface types, and thus supports the interpretation of satellite data by providing a basis for selecting appropriate image indices (e.g. choice of bands, ratios, or other mathematical routines) and for guiding the quantitative calibration of supervised classifications. This assumes that the technique provides robust data, that the conditions of sensing are equivalent for ground and satellite data, that ground radiometric response is physically and environmentally interpretable, and that a meaningful relationship can be established between ground and satellite data.
Ground-data quality depends on the instrumentation and the radiometric stability of the terrain surfaces. The present study employed a field-portable Milton Multiband radiometer (Reference MiltonMilton 1980). Reflected radiation was recorded in four bands, using a Kodak grey card reference to calculate an approximation to the bidirectional reflectance factor (BRF) (Reference Robinson and BiehlRobinson and Biehl 1979), and the conditions at times of survey were noted since the ground and satellite data were collected on different dates. The technique used a 2m mast with a single sensor head which sequentially accessed the target (1 m diameter instantaneous field of view) and reference. The four bands represented Thematic Mapper bands 2–5.
Radiometry yields a coherent ground-data set but its relationship to satellite data requires discussion. Ideally, the two data sets should be acquired simultaneously. If this is not possible, the radiometric consequence of any differences must be appreciated. In the present investigation the distinction between the July satellite image and the September ground radiometry raises several concerns, even though weather conditions were similar on both dates. In the pro-glacial context, the difference introduces contrasts between river-flow and sediment transport conditions, and for vegetation in the growth and senescent phases. On the glaciers, major distinctions are the reduced snow cover and increased supraglacial water of the ground survey.
However, much can be gained from an analysis of the ground data (Table I). Pro-glacial vegetation represents significant catchment characteristics. Complex patterning of vegetation related to topoclimatic factors is superimposed on a regional altitudinally related zonation. In a similar field context, Reference Frank and IsardFrank and Isard (1986) found that a combination of remotely sensed data and ground-derived topoclimatic indices yields improved Alpine tundra vegetation discrimination. In the absence of such integrated data, the ground data suggest that a reasonable vegetation classification can be obtained from TM equivalent band 4/3 ratios.
Table I Ground Radiometric Attributes of Glacial and Pro-Glacial Terrain in South-West Switzerland
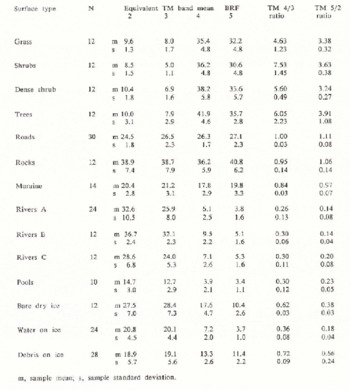
The dry surfaces of roads, rock spreads, and continuous moraine cover on ice provide data that are radiometrically moderately stable and can to an extent be discriminated both by the pattern of the four-band reflectance values (which have similar form, but distinct absolute levels), and by their TM band 4/3 ratios, although there is partial overlap of the samples.
The water samples are clearly differentiated from other surfaces by high absorption in bands 4 and 5, but they display considerable variability associated with water shallowness, flow turbulence and suspended sediment concentration. Thus the radiometric performance of pro-glacial water is likely to be very sensitive to seasonal and diurnal flow and sediment variations, reinforcing the importance of synchronizing ground- and satellite-data collection.
Three sub-sets of glacier terrain were assessed: bare and generally dry ice, supraglacial water, and varying cover of rock debris on the ice. Ice yields a dual radiometric population differentiated by presence or absence of water. The potential for quantitative radiometric evaluation of debris cover on ice also justifies comment. Aggregate values indicate less differentiation from bare ice than might have been expected, but this can be explained by the influence of varying percentage debris cover. Debris cover was assessed in 5% classes and compared with BRF. Band 2 provided the strongest (but non-linear) single-band relationship between reflectance and percentage debris cover, with increases of debris cover beyond about 30% inducing little further ground radiometric change. A stronger and linear relationship was found between the band 5/2 ratio and percentage debris cover. The ability of this ratio to discriminate water, ice, and debris-related terrain classes complements the band 4/3 ratio which is more useful in discriminating other terrain types (Table I).
This discussion has identified two areas of potential difference between ground and satellite data induced by the differences in the timing of data collection. First, some surfaces on the satellite image may not be represented in the ground data because of changes in their areal extent or radiometric characteristics (e.g. fresh and melting snow cover, lush meadow vegetation). Secondly, some surface types may have similar radiometric characteristics but their areal extent may have changed (e.g. water of given depth, turbulence, and suspended sediment concentration).
Relating Ground and Satellite Data: Atmospheric and Shadow Effects
Physically rigorous techniques for estimating atmospheric corrections to satellite data are notoriously complex but the use of band ratios in the present study meant that it was important to assess the variable atmospheric effects on different bands. A simple alternative to physically rigorous atmospheric correction uses base values from very strongly absorbing surfaces such as deep clear water bodies and areas of deep shadow, although it is stressed that this only tackles the additive component of the atmospheric influence, the path radiance (Reference Kriegler, Malila, Nalepka and RichardsonKriegler and others 1969). Areas of deep shadow and a clear lake were employed to determine an atmospheric correction base value for each of the TM bands 2 to 5 and the following discussion of band ratios relates to data for which base value correction has been applied.
An additional problem in relating ground to satellite data arises from shadow effects, particularly in areas of strong relief. Algorithms for the removal of shadow effects are not yet well developed for TM data, but the use of band ratios can be quite effective. This discussion will concentrate upon their use when relating ground to satellite data, but it should be noted that, although much of the shadow effect was removed by this means, there were still clear shadow influences remaining in the ratio data in areas of very steep relief.
Relating Ground and Satellite Data: The Influence of Geometric Correction and Re-Sampling
The ground and satellite data were related in two 40 × 60 pixel extracts centred, respectively, on the tongue of Lower Arolla glacier and on the down-stream valley bottom. These extracts incorporate the field areas in which the ground data were collected, and thus the range of terrain types to be studied. Plots of band 4 against band 3 digital numbers for all the pixels in these two areas show the marked contrasts between the predominantly ice- and rock-covered terrain of the glacier extract and the increasing vegetational influence in the extract of the down-stream valley bottom (Fig.1).
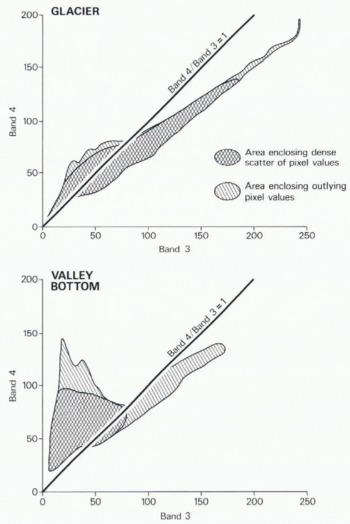
Fig. 1 Digital numbers for bands 3 and 4 for pixels in extracts covering the tongue of Lower Arolla glacier and the valley bottom near Arolla village.
Before classification, satellite data are frequently geometrically corrected to a map base. The ground data were, therefore, related to both uncorrected satellite data and geometrically corrected and re-sampled data. An extract of the TM scene, including the entire Arolla Valley, was geometrically corrected by fitting both linear and quadratic trend surfaces to ground-control points on the image and their map coordinates on the 1 : 25 000 scale map. Geometrically corrected images with a 20 m pixel size were created using nearest-neighbour and cubic-convolution resampling algorithms. Identical 42 × 80 pixel extracts were selected from each of the four re-sampled scenes to overlap the glacier and valley-bottom extracts from the uncorrected satellite data. Fig.2 shows the uncorrected 40 × 60 pixel (pixel size 30 m) glacier extract and the geometrically correct, quadratic, nearest-neighbour re-sampled 42 × 80 pixel (20 m pixel size) extract photographed at the same scale.
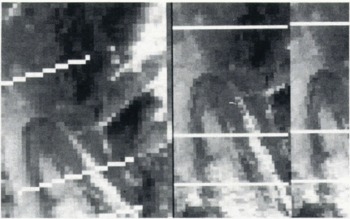
Fig. 2 Extract of Lower Arolla glacier showing a composite of bands 4, 3, and 2 for the raw data (left) and linear, nearest-neighbour geometrical correction and re-sampling (right). (Both photographs are presented at the same ground scale and locate glacier profiles 1—3 from top to bottom of the photographs.)
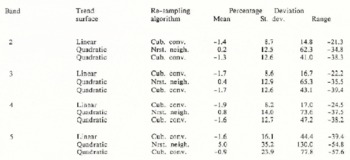
Because of the different pixel size and orientation of the uncorrected and corrected, re-sampled data, it is difficult to draw quantitative comparisons, Nevertheless, the influence of the order of trend surface and re-sampling technique on the data was assessed by comparing pixel values for six identical profiles (three across the glacier and three across the valley bottom) on each of the four geometrically corrected images. Table II expresses the percentage deviation of the digital numbers for the same pixels on the central profiles shown in Fig.2 for the linear, cubic convolution; quadratic, nearest-neighbour; and quadratic, cubic convolution re-sampled data in comparison with the linear, nearest-neighbour re-sampled data. It was clear from these comparisons for all six profiles that substantial differences in digital number can arise for the same pixel according to the trend surface and re-sampling algorithm employed, and that these differences will affect band ratios with consequences for classification.
Table II Percentage Deviation of Pixel Values for Various Geometric Correction and Re-Sampling Procedures for the Same 42 Pixel Profile Across Lower Arolla Glacier (all percentages are calculated as deviations from the pixel values for the linear, nearest-neighbour re-sampling)
Tables III and IV indicate the implications of linking ground data to raw and re-sampled satellite data in terrain classification. Table III lists the class boundaries used to density-slice the band 4/3 and 5/2 ratios to classify terrain in the uncorrected valley bottom and glacier extracts. The correspondence between band ratios estimated from the ground-reflectance data and the satellite-radiance data for areas of known terrain type was found to be surprisingly good. Thus, the density-slice classes were estimated by starting with the ground data, inspecting the satellite data in the areas from which the ground data were derived, and creating class boundaries from these two sources to permit classification of all pixels in the extracts.
Table III A Comparison of the Class Boundaries for Different Glacial Terrain Types Based Upon Ground Data and A Density Slice of an Extract From A Thematic Mapper Scenetable IV. Comparison of the Percentage of A Profile Across Lower Arolla Glacier Classified Into Different Terrain Classes According to the Processing of the Data
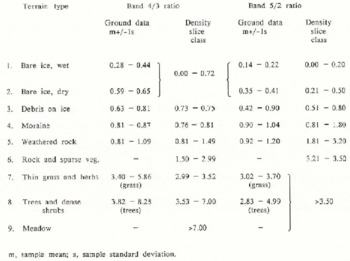
Table IV Comparison of the percentage of a profile across lower Arolla Glacier classified into different Terrain classes according to the processing of the data
The greatest difficulties in establishing class boundaries were found in areas of meadow (for which there were no ground data) and in coarse rocky terrain with sparse vegetation (where the ground data related only to components of the terrain). A small amount of vegetation across rocky terrain appears to have a large effect on the 4/3 and 5/2 ratios. Problems in classifying water, which had been anticipated from the ground data, arose more from the spatial scale than from the nature of the water surfaces. In the glacial extract, the high July suspended sediment concentration and small width (4–8 m) of the pro-glacial stream caused it to be absorbed into the moraine/bare-rock class of the surrounding flood plain. Fig.3 presents bandratio values prior to geometric correction for the six profiles from the glacier and valley-bottom extracts. The ice- and water-covered surface of Lower Arolla glacier is clearly identifiable in the very low band 5/2 ratios, whereas the high band 4/3 ratios of profiles 1 and 3 of the valley bottom correspond to areas of forest and meadow.
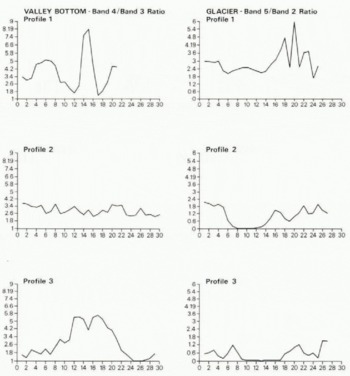
Fig. 3 Raw-data pixel profiles of band ratios for extracts across Lower Arolla glacier (band 5/2) and the valley bottom near Arolla village (band 4/3). (The vertical axis represents the band ratio and the horizontal axis represents the pixel location on the profile.)
The influence of data processing was assessed by considering the percentage of the six profiles on the valley bottom and glacier extracts that would be classified into different terrain types after different types of processing. Table IV shows the results of this analysis for profile 2 on the glacier extract. On ice and rock, the classification of the band 5/2 is slightly more stable than that of the 4/3 profile, but differences in both occur according to different processing techniques. On more vegetated terrain, comparison of the ratios is precluded by the poor definition of vegetation categories by the band 5/2 ratio.
Ground Data in Perspective
A methodology for terrain classification in Alpine areas has been described which begins with the collection of ground data and proceeds to use these data as the primary input to the interpretation and classification of satellite data. In spite of the differences in the timing of ground- and satellite-data collection, the ground data proved surprisingly useful. It appears that there is great potential for building up a data base of well-documented ground reflectance data on different dates and under different environmental conditions to aid in future image processing for the same field area. Ground data are both qualitatively and quantitatively useful. In the present study they not only provided a quantitative basis for classifying the satellite data but their analysis also indicated profitable approaches to the processing of the satellite data. The usefulness of a band 4/3 ratio in separating terrain categories might have been anticipated from the results of other studies, but the potential applicability of the band 5/2 ratio to terrain separation in areas of variable ice, rock and water cover was discovered from ground data analysis. In addition to stressing the great potential of ground data in increasing the rigour of glacial and pro-glacial remote sensing, the results of this study underline the need to adopt caution when interpreting re-sampled data.
Acknowledgements
The authors acknowledge the invaluable technical advice of Dr E J Milton, University of Southampton. Field radiometry was funded by the University of Southampton and assisted by undergraduates from the Department of Geography. Image data were provided by the Natural Environment Research Council.


