1. Introduction
About two years ago one of us (Rice, 1975) reviewed the information available concerning the properties of amorphous solid water (H20(as)) and speculated on the relationship between the structures of the amorphous solid and the liquid phases. Since the preparation and publication of that paper we have completed several experimental and theoretical studies of H20(as) and polycrystalline ice 1h (Sivakumar and others, 1977, in press; McGraw and others, 1977, in press; Bergren and others, in press; Madden and others, in press). This paper summarizes the old and new data and combines them with the results of model calculations to generate a consistent interpretation of the properties of H20(as) and ice 1h.
The amorphous solid state occupies an unusual, and poorly defined, position in the lexicon of categories of condensed phases because it is only metastable. Although usually very long lived, the fact that it is metastable immediately raises three questions:
(i) How are the structures of the amorphous solid and the stable crystal phases related? Can one be obtained from the other by physically realizable processes?
(ii) Does the amorphous solid represent a configuration to which a liquid would evolve if crystallization could be suppressed, or are there intrinsic differences between the amorphous solid and liquid phases ?
(iii) Are the properties of the amorphous solid merely intermediate between those of the crystalline and liquid phases, or are there some that are unique to it?
Presently available information provides partial answers to each of these questions, but in no case complete answers.
In summary form, our analysis of the properties of H20(as) and of polycrystalline ice 1h, buttressed by model calculations, leads to the following conclusions. First, there is a low density form of H20(as) that is derived from ice 1h in the same way as are amorphous Si and Ge from their crystalline parents (Paul and others, 1973). In each of the cited cases, both the amorphous-solid and crystalline phases have local tetrahedral coordination with nearly the same nearest-neighbour separation. Although there is some dispersion in the nearest-neighbor distance in the amorphous solid, the source of disorder is to be found in the deviations of the angles, e.g. O—O—O, from 109.5°. A distribution of angles with width of the order of 8° is inferred from experimental data (Narten and others, 1976), and this is sufficient to destroy correlation between the orientations of molecules in H20(as) separated by more than 7 A. Second, the OH stretching regions of the vibrational spectra of H20(as) and poly-crystalline ice 1h are very similar (Sivakumar and others, 1977, in press; Bergren and others, in press), and can be interpreted in terms of the effects of strong intermolecular coupling between OH oscillators (McGraw and others, 1977, in press; Madden and others, in press). Because of proton disorder, the vibrational modes of polycrystalline ice 1h do not have simple representations in terms of the symmetric and antisymmetric OH stretching modes of an isolated water molecule. The detailed shape of the spectrum derives from the variation in properties of crystal vibrations. By virtue of the interactions between proton disorder, the O—O separation distribution, and the O—O—O angle distribution in H20(as), its vibrations are even more mixed in character than in ice 1h (Madden and others, in press). There remains, however, a one-to-one correlation between features in the spectra of the two condensed phases and the temperature dependences of those features. The suggested interpretations of the spectra of H20(as) and ice lh are consistent with the known structures of the solids. Third, the general similarities between the local structural and the spectroscopic properties of H20(as) and liquid H20 suggest that the considerations used to analyze the nature of the amorphous solid have a place in the description of the liquid.
II. Preparation of H20(as)
The only known method of preparation of H20(as) is by slow deposition of water vapor onto a cold substrate. An analysis of this process by Gurtzow and Avramov (1974), identifies the following important parameters: The temperature of the substrate, the deposition rate and the consequent surface temperature, the thermal conductivity of the substrate, the angle of incidence of vapor on the substrate, the absence or presence of a surface film on the substrate, and the existence of single crystal orientations of the substrate (or crystallite orientations of a polycrystalline substrate) that favor the growth via epitaxy or nucleation of one or the other crystalline modifications of the substance being deposited. In the course of preparation of the many samples we have studied, a modest range of variation in these parameters has been explored. For example, since sapphire has almost the same thermal conductivity at 10 K and 80 K, if all other parameters are held fixed the influence of substrate temperature on the nature of the H20(as) formed can be probed. The results of this and related experiments require a re-evaluation of a previous suggestion concerning the influence of temperature and rate of deposition on the nature of the H20(as) deposit (Venkatesh and others, 1975). X-ray diffraction studies of H2O(as) formed on an oriented single crystal of Cu reveal the existence of two modifications, a low-density form deposited at 77 K, and a high-density form deposited at 10 K (Narten and others, 1976). We have found that if deposition is onto fused sapphire or a polycrystalline metal neither the temperature of the substrate nor the deposition rate can be used to induce at will the desired high- or low-density form of H20(as). At present the most plausible explanation of the difference in nature of H20(as) samples prepared for the X-ray diffraction studies and for spectroscopic studies is that an oriented single crystal of Cu can, at very low temperature, either by epitaxy or nucleation, promote the growth of the high-density form.
This paper is concerned exclusively with low-density H20(as) and its relationship with ice 1h. Details of our preparation procedure are presented elsewhere (Sivakumar and others, 1978; Bergren and others, 1978). We find that with our deposition technique, using sapphire, an alkali halide, or polycrystalline Cu as the substrate, the spectra of samples of low density H2O(as) are the same independent of the temperature of deposition. With sufficient care, amorphous solid water can be prepared up to a substrate temperature as high as 110 K, but the samples formed at that temperature fracture very easily under the influence of even mild thermal stresses.
III. Structural Studies
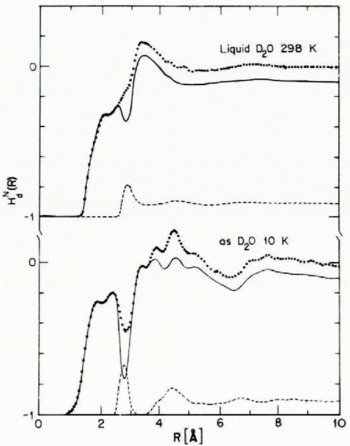
Low-density H20(as) has been studied by both X-ray and neutron diffraction (Narten and others, 1976; Wenzel and others, 1975; Wenzel, unpublished). Figure 1 displays the O—O pair correlation functions of polycrystalline ice and low-density H20(as); the pertinent separations between molecules, number of neighbors, etc., are listed in Table I. Figure 2 displays a combination of X-ray and neutron diffraction data designed to determine the distance over which angular correlation between water molecules is important.
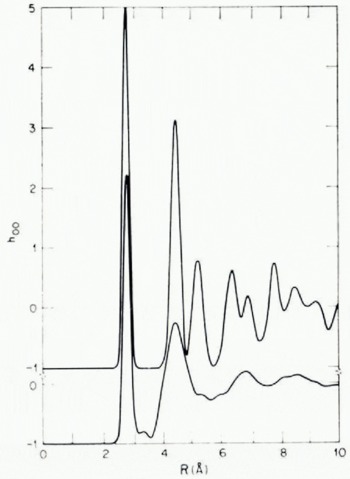
Fig. 1. Oxygen-atom pair correlation function for polycrystalline ice 1h (top) and for low-density H2O(as) bottom at 77 K.


Fig. 2. Atom pair correlation functions for D20(as) and liquid D2O. The dolled curves are weighted sums of contributions from OO, OD, and DD interactions, while the broken curves show the OO contributions only (derived from X-ray diffraction data). The solid curves, obtained by difference, represent nearly evenly weighted sums of OD and DD atom pair correlation functions. Note the loss of orientational ordering for R > 7 A in D20(as) and 4 A for liquid D20.
From the data cited it is seen that local ordering in ice Ih and low-density H20(as) is very nearly the same. Both condensed phases have essentially four neighbors at 2.76 A, the difference in near-neighbor distances and in bulk densities between them being of the order of 1%. As expected, the width of the nearest neighbor O—O distribution in H2O(as) is somewhat greater than that in ice Ih. Furthermore, from Figure 2 we infer that in H20(as) angular correlation between water molecules is lost for R > 7 A, and from the width of the second-neighbor peak in Figure 1 that there is a distribution of O—O—O angles with width of the order of 8°. Finally, comparison of intramolecular and intermolecular distances inferred from the combined X-ray and neutron diffraction data suggests that an average the hydrogen bonds in low-density H2(as) are linear to within 5°.
A comparison of these observations with information about amorphous Si and Ge is revealing. For those materials it is also found that the parent crystal and amorphous solid have densities and nearest-neighbor separations the same to within about 1%, and that disorder is generated by distortion of the Si—Si—Si angle, the width of the angle distribution being of the order of 7° to 8°. It is very likely that low-density H20(as) bears the same relationship to ice Ih that amorphous Si and Ge do to their parent diamond lattices (Alben and Boutron, 1975). We adopt and expand upon this point of view in the remainder of this paper.
Unlike Si and Ge, H2O(as) is composed of triatomic molecules with an internal structure. It is of interest to determine if the intramolecular bond length and bond angle are the same in the amorphous solid and the free molecule (and other phases of water as well). The available neutron diffraction data for D2O(as) extend only to 12 A-1 in wave-vector transfer, so intramolecular structural parameters cannot be obtained with great accuracy. We note that within experimental precision there appear to be no differences between the OD bond lengths and DOD angle of D2O molecules in the vapor and the amorphous solid.
IV. Spectroscopic Studies
Details of recently completed extensive studies of the OH stretching region of the Raman and infrared spectra of polycrystalline ice Ih and of low-density H20(as) will ber eported elsewhere (Sivakumar and others, 1977, in press; Bergren and others, in press); only the results will be described herein.
We have found that the Raman and infrared spectra of low-density H2O(as) are the same independent of the temperature at which the deposit was formed. Therefore, for the purpose of describing the changes in the OH stretching spectrum as a function of temperature only the temperatures of observation need to be specified.
It has been known for a long time that the OH stretching region spectrum of water can be simplified by isotopic decoupling of the oscillators (Haas and Hornig, 1960). We show in Figures 3 and 4 the Raman spectra of dilute HDO/D2O and HDO/H2O mixtures in the polycrystalline and amorphous solid phases. The infrared spectra of these decoupled OH and OD oscillators are similar, as shown in Figure 5. The temperature dependences of the peak position and full width at half maximum (FWHM) of the uncoupled OH and OD stretching transitions are shown in Figure 6. Note that to a very good approximation the FWHM is independent of the temperature. The apparent decrease in FWHM in the amorphous solid for T > 100 K we believe to be an artifact, possibly caused by cracking of the samples.

Fig. 3. Raman spectra at several temperatures of a decoupled oscillator in polycrystalline ice Ih. (a) HDO|D2O, (b) HDO|H2O.

Fig. 4. Raman spectra at several temperatures of a decoupled oscillator in amorphous solid water: (a) HDO|D2O(as), (b) HDO|H2O(as).

Typical infrared spectrum of a decoupled oscillator in polycrystalline ice Ih: (a) HDO|D2O, (b) HDO|D2O(as), (c) HDO|H2O, (d) HD0|H2O(as).
If it is accepted that the FWHM of a decoupled OH oscillator in both the polycrystalline and amorphous solid phases is independent of temperature, we must attribute the observed width to some static structural property. We suggest, in agreement with Whalley (1968), that in the polycrystalline ice phase there is an O—O nearest-neighbor distance distribution which has a small width by virtue of proton disorder. That is, we suggest that proton disorder creates local environments in which the O—O separations are slightly different. An estimate of the width of this distribution can be obtained from the known correlation of OH stretching frequency and average O—O separation, which is dΩOH/dRoo = 1843 cm-1 A–1 and dΩOH/dRoo = 1362 cm–1 A–1 for RQO = 2.76 A (Falk, [C1975]).The implied FWHM of the O—O distance distribution in polycrystalline ice is then 0.014 A, much smaller than the width of the first peak of the OO pair correlation function (see Table I). However, the peak width in the pair correlation function contains contributions from the limited coherence length in a polycrystalline sample and the limited resolution of the experimental apparatus. At present our interpretation cannot be directly tested.

Fig. 6. Temperature dependences of the peak position and the FWHM of the decoupled oscillator transition in polycrystalline ice Ih and amorphous solid water.
Application of the same argument to the data for the amorphous solid implies that the distribution of O—O separations has a FWHM of 0.046 A, again smaller than the width of the nearest-neighbor distribution inferred from the X-ray data. That the O—O separation distribution in H2O(as) is broader than that in ice Ih is clearly plausible. Indeed, several models representative of the kind of amorphous solid derived from a diamond lattice, e.g. Si and Ge, have about 1 % dispersion in the bond lengths. In addition, some contribution to the spectral width from the distribution in O—O—O angles is to be expected, although this dependence is likely to be much weaker than the dependence on average O—O separation.
Figure 6 reveals that the frequencies of the uncoupled OH and OD oscillators increase slowly as T increases. We attribute the observed behavior of Ω?η (T) to thermal expansion. As shown in Figure 7 there is quite reasonable agreement between the expected and observed frequency shifts given the value of dΩOH/dRoo quoted above and the known change in lattice parameters with temperature (Brill and Tippe, 1967). It is obvious from examination of Figure 6 that the explanation of the thermal effects on the decoupled oscillator transition in the amorphous solid must be the same as for polycrystalline ice Ih.

Fig. 7. Observed and predicted shift of the position of the 3 100 cm-1 peak of polycrystalline ice Ih as a function of temperature.
Finally, we note that the limiting values of the frequency differences between amorphous (a) and crystalline (x) ice, (Ω?η A— Ω?η X)uncoupled and (Ω?D A– Ω?D A)uncoupled are 34 cm–1 and 27 cm-1, respectively. Again using the correlation between Ω?η and R OO we infer that the average O—O separation in the amorphous solid is about 0.02 A larger than in ice Ih. This value is in agreement, within experimental precision, with that found from X-ray diffraction data.

Fig. 8. Raman spectra at several temperatures of polycrystalline ice Ih: (a) H2O, (b) D2O).

Fig. 9. Raman spectra at several temperatures of low-density amorphous solid water: (a) H2O, (b) D2O.
We turn now to examination of the properties of pure polycrystalline ice and amorphous solid water. Typical Raman spectra are displayed in Figures 8 and 9. The similarities and differences in these spectra are easily seen in the superposition displayed in Figure 10. Typical infrared spectra are displayed in Figure II.

Fig. 10. Direct comparison of the Raman spectra of H2O(as) and polycrystalline ice Ih.

Fig. 11. Typical infrared spectra of (a) H2O(as) and (b)D2O(as).
Interpretation of broad and relatively featureless spectra is always difficult. We have been guided by the results of detailed model calculations described in the next section. These show that at the low-frequency end of the OH region of the irrational spectrum there is one mode which is dominantly of symmetric character, whereas in the middle of the density of OH stretching states there is a maximum in the amount of antisymmetric character mixed into the modes. We expect, then, that Raman scattering will be dominated by the contribution of the lowest-frequency mode and infrared absorption by the modes in the middle of the band of states. With this in mind we examine the observed Raman spectrum with respect to the change with temperature of the properties of the prominent low-frequency peak. As shown in Figures 12 and 13, this peak shifts and broadens as T increases. Note that to a very good approximation the temperature dependences of the peak shift and peak width are the same for polycrystalline ice Ih and the amorphous solid. We also note the existence of spectral intensity that is temperature-dependent on the low-frequency side of the peak under discussion.
The observed shift with increasing temperature of the low-frequency peak in the coupled oscillator spectrum is slightly greater than that of the uncoupled oscillator for both the polycrystalline and amorphous solid phases. Experimental uncertainties in the peak positions are large enough that within the combined error of ±4 cm-1 the difference in temperature shifts is zero for T < 120 K, but the systematic trends in the data suggest that the computed difference is real. At 150 K the excess change (ΔΩOH x)coupled-(ΔΩOH x)uncoupled is (6.3±4) cm-1; it is (4.5±4) cm–1 for the OD oscillator. We attribute this residual shift to weak coupling of the delocalized OH stretching vibrations and delocalized lattice vibrations. Our model calculations show that despite proton disorder the low-frequency peak in the Raman spectrum is delocalized, and the work of Bellows and Prasad (1976) shows that delocalized lattice phonons exist even in heavily doped proton/deuteron-disordered H2O/D2O poly-crystalline ice Ih. Weak coupling of these vibrations will lead to a temperature dependence of the width of the OH stretching transition and to a very weak shift of peak frequency with temperature.

Fig. 12. Temperature dependence of the low-frequency peaks in the Raman spectra of amorphous solid water and polycrystalline ice Ih.

Fig. 13. Temperature dependence of the FWHM of the low-frequency peak in the Raman spectra of amorphous solid water and polycrystalline ice Ih.
The observation that the widths of the decoupled OH and OD oscillator transitions are sensibly independent of the temperature, whereas those of the coupled OH and OD oscillators increase dramatically as temperature increases, suggests that the dominant contribution to the coupling arises from modulation of the interaction between those OH stretching modes which are near resonance. Now, our data show that the residual width of the coupled OH oscillator transition is smaller than that of the decoupled OH oscillator transition, the values being 19 cm–1 and 26 cm–1, respectively. As mentioned earlier, we expect that proton disorder will create local environments with slightly different O—O separations. By virtue of the correlation between Ω?η and R OO there will be a distribution of OH stretching force constants. Model calculations show that this distribution of force constants is directly reflected in the width of the decoupled oscillator transition, but that, in the case of the coupled oscillator transition, the mixing of vibrations corresponding to force constants with positive and negative deviations from the mean leads to a frequency distribution with smaller width than would be expected just from consideration of the force-constant distribution without mixing of vibrations (McGraw and others, in press). We attribute the above-cited narrowing of the coupled-oscillator OH stretching transition to this effect.
We now examine the temperature dependence of the FWHM of the low-frequency symmetric OH stretching mode of ice Ih. We have already indicated that model calculations show this mode to have delocalized character, so we treat the interaction between it and a phonon as a scattering event. The proton disorder in the ice Ih lattice prevents the development of a systematic phase relationship between individual OH stretching motions, hence we suppress what would be the wave vector of this vibrational exciton in a perfect crystal. Furthermore, we assume, for simplicity, that only one dispersionless optical phonon dominates the scattering. The scattering described leads to a Lorentzian profile for each OH stretching transition of the crystal. We do not know the form of the distribution of frequencies generated by the induced local variations in OO separation induced by proton disorder. If that distribution is Gaussian, the observed line shape should be a Voigt profile. If it can be approximated by a Lorentzian, the residual width and thermally-induced width are additive. In our interpretation the width (Sivakumar and others, 1977) of the a priori distribution is independent of temperature. In our original interpretation of the temperature dependence of the line width, we took it to have the form
with ? the frequency of the optical phonon responsible for the scattering. Aside from the approximations of neglecting dispersion of the phonon frequency and assuming that only one phonon branch is effective in scattering, Equation (1) is valid only if there are states of the system at Ω0H ± ?. Our model calculations show that the density of states at Ω0H + ? is high for all ? of interest. In contrast, the model predicts there are no states with Ω0H — ?. If we take the model seriously, scattering events that lead to Ω0H — ? must be excluded, and the scattering time becomes
where |F|2 measures the OH-vibration optical-phonon coupling and we have again assumed that only one branch of dispersionless phonons is effective in scattering. The line width is then
where Δ0 is the residual width at T = 0. Equation (3) fits our data, as shown in Figure 14, with an effective optical phonon frequency of about 200 cm-1. The spectrum of ice Ih shows a large density of translational modes near 200 cm-1, hence the effective optical phonon frequency inferred from the fit to the FWHM data is consistent with other properties of the spectrum of vibrations (Hobbs, 1974). It is necessary to repeat that this description of the line-broadening mechanism is grossly oversimplified. We believe that the coupling of OH stretching and lattice modes to be much more complicated than can be described by a single effective optical-mode interaction, but the model is useful for providing physical insight.

Fig. 14. Observed and predicted FWHM for the 3 100 cm–1 peak in the Raman spectrum of polycrystalline ice Ih.
For ? = 200 cm–1 we predict that the line widths at T= 173 K. and 269 K are 68 cm–1 and 128 cm–1, respectively, these values to be compared with those reported by Scherer and Snyder (1977), namely 62 cm-1 and 154 cm-1. Where our data overlap, their FWHM exceed ours because they measure the full asymmetric line width whereas we double the low-frequency side half width, attributing the asymmetry to non-scattering processes. Considering the crudity of the model the agreement is reasonably good.
Whether our original or our present interpretation of the line width is to be preferred depends on the weight one puts on the results of the model calculations. If it is accepted that these accurately predict the general span and character of the density of OH stretching modes, so that there are no modes below about 3 100 cm-1 in ice Ih, scattering to ΩOH—? cannot occur and Equations (2) and (3) must be used in place of Equation (1). If the model is inaccurate with respect to this question, the interpretation of the line width must be considered uncertain since, within the experimental error, both Equations (1) and (3) fit our data (but Equation (1) predicts much smaller widths at 173 K and 269 K than does Equation (3)).
We now note that there is a shoulder in the spectra of both polycrystalline ice Ih and the amorphous solid at about Ω?η—ωL, and this shoulder has the temperature dependence expected of a hot-band transition. It is, however, rather broad. The sum band transition, at ΩOH+ωL, which is less sensitive to temperature than is the difference band, might be part of the spectral intensity near 3 200 cm-1 where the density of OH stretching stales is predicted to be very large. At present we have no evidence for the existence of a sum-band transition. There is no need for the lattice phonon which dominates the scattering and that which generates the hot band to be the same.
As seen in Figures 12 and 13, the behavior of amorphous solid water is very much like that of polycrystalline ice Ih, so we interpret the observed temperature dependence of the peak position and FWHM in the same way. Of course, the residual width of the transition is increased by virtue of increased dispersion of the O—O distance and by the presence of a distribution of O—O—O angles.
The location of the low-frequency peak of H2O(as) is 22 cm-1 to the blue of that of polycrystalline ice Ih; the shift is essentially the same for all temperatures studied. Note that the difference in peak positions between the coupled oscillators of pure H2O(as) and ice Ih is less than the corresponding difference for decoupled oscillators (34 cm-1). At least two interpretations for this reduction can be given. First, it is possible that it is due to small differences in the values of the intramolecular and intermolecular coupling constants (see next section). Second, it is possible that the variation in the OH stretching force constant in the amorphous solid gives rise to a redistribution of Raman intensity such that the peaks in the spectra of ice Ih and H2O(as) do not correspond to the same mode, and hence are shifted differently relative to the peaks in the spectra of the decoupled oscillators in the corresponding condensed phases (see next section). Model calculations show that both effects can occur. We do not yet know enough about the microscopic structure of H2O(as) to assign definitely the mechanism responsible for the reduction in peak frequency shift described; probably the effect arises from a combination of mechanisms.
V. Theory of the Vibrational Spectrum
As is evident from the phenomenological analysis of Section IV, the similarities between the infrared and Raman spectra of amorphous solid water and those of ice Ih suggest that a full understanding of the ice I vibrational spectrum at the microscopic level must precede any interpretation of the corresponding spectrum of the amorphous solid. Historically, the features of the OH stretching region of the vibrational spectrum of ice Ih have been variously attributed to Fermi resonance, coupling to the lower-frequency modes of the oxygen lattice, inhomogeneities in the molecular environments, and strong intermolecular couplings of the OH stretching motions. Nearly a decade ago Whalley (1968) argued that only the last of these could account for all the major features of both the infrared and Raman spectra, and that the remaining effects mentioned could only be expected to alter the spectra slightly.
Perhaps the strongest evidence for Whalley's point of view comes from the decoupled oscillator studies of Haas and Hornig (1960). In that work, a series of isotopic mixtures of ice Ih were examined. At the lowest concentrations the vibrational spectrum has only a single peak (see Fig. 5) corresponding to isolated guest oscillators. As the guest isotope concentration is increased, so is the probability that one HDO molecule will be hydrogen bonded to another. Indeed, as isotope concentration is increased two distinct side bands are observed to develop in the vibrational spectrum, indicating that the motions of neighboring guest oscillators arc coupled and split into in-phase and out-of-phase components. Using the positions of these side bands, Haas and Hornig (1960) calculated an intermolecular coupling constant of —o.123 mdyn/A (-12.3)N/m).
Whalley gave an intuitive description of how the intermolecular coupling might give rise to the structure observed in the Raman spectrum of ice I and other condensed phases of water. Unfortunately, this and other more recent interpretations rely too heavily on the spectra of the free H2O and D2O molecules. The intermolecular coupling constant calculated by Haas and Hornig is larger than the intramolecular coupling in the free molecule. In addition, the effect of the intermolecular interactions is further enhanced because each oscillator is coupled to four other oscillators through the force constant determined by Haas and Hornig, while it interacts with only one other oscillator via intramolecular coupling. Thus, there is no reason to believe that any features of the free-molecule spectrum persist in the vibrational spectrum of the crystalline phase.
It is somewhat surprising that no quantitative test of these ideas has been attempted. Only a few calculations of the vibrational properties of ice-like clusters have been reported (Shawyer and Dean, 1972[a], [b]; Plummer, 1973; Hale and Plummer, 1974), but these were directed primarily toward understanding the nature of the low-frequency modes of the oxygen lattice and have not included the strong intermolecular couplings required to reproduce the spectrum in the OH stretching region.
The calculation of the vibrational properties of ice Ih poses an unusual problem because, in a sense, it is not truly crystalline. Though the oxygens lie in a reasonably well-defined four-molecule unit cell, the hydrogen positions arc restricted only by the Pauling ice rules and exhibit no special symmetry.
In the course of the studies summarized in this paper we have examined a variety of models of differing size and complexity. We believe that a model consisting of a large periodic cell extracted from the oxygen network and decorated with protons can give an excellent representation of the vibrational density of states provided that the cell is sufficiently large. "Free" (non-periodic) clusters are not adequate in this application because a large number of OH oscillators near the surface of the cluster are not tetrahedrally coordinated and introduce anomalies into the vibrational density of states. It is possible, however, to eliminate these surface anomalies by applying ad hoc boundary conditions which associate (couple) surface oscillators with conjugate oscillators in a distant part of the surface in such a way that each surface oscillator is coupled to other oscillators as if it were tetrahedrally coordinated. Since it is always easy to define an oxygen lattice for the proton-disordered ices, there is no need to resort to these "knotted" clusters, but, as we will show later, there is no completely adequate periodic model for the structure of the amorphous solid. Thus, the use of large clusters with ad hoc boundary conditions may prove useful when applied to amorphous solids.
Though we examined models of various sizes, the only results we shall discuss herein were obtained from a 64 molecule cell with orthogonal edges (8.98 Å × 15.56 Å × 14.67 Å) and with protons distributed so that the cell has a vanishing dipole moment. For convenience, the intramolecular bond angle is assumed to be tctrahcdral. Any other reasonable bond angle can be accommodated by a minor adjustment of the force constants. A 64 molecule unit cell contains 10,2 atoms and each calculation of its density of stales would require the diagonalization of a 576 × 576 dimensional matrix, a tedious and costly task. Since our attention is focused mainly on the OH stretching motions, we have invoked a separation of high- and low-frequency motions and have employed a reduced vibrational model (RVM) in which all bending, librational, and low-frequency translational motions are discarded. Thus, the nine degrees of freedom per molecule are reduced to two: the stretching motions of the two OH bonds.
We have employed a modified valence force field of the form

where k1 is a bond-stretching force constant, k2 is an intramolecular coupling constant, and qiα is the bond displacement coordinate for the αth oscillator on the ith molecule. The inter-molecular coupling constant k3 describes an interaction between those oscillators on nearest-neighbor molecules. The singly primed summation sign indicates that only those oscillators topologically connected through a hydrogen bond:

are to be included in the sum. The configuration specified by Equation (5) is unique and includes half of the oscillators on the four nearest neighbors of the molecule containing oscillator α The doubly primed summation sign indicates that the remaining oscillators in the system are coupled to α through a weak orientation-dependent force which is assumed to arise from the interaction of two oscillating point dipoles. These coupling constants are taken to be
where r iα and r iβ are unit vectors along the appropriate OH bonds, r ij is a similar unit vector in the direction of the O i -O j segment, R is the separation between O i and O j , and μ ’ is the derivative of the dipole moment of the OH bond with respect to a change in the bond length. In this section, the bond-stretching force constant k1 is assumed to be identical for each OH oscillator and may be obtained from the experimental infrared and Raman spectra of the dilute HDO/D2O and HDO/H2O ices. Test calculations on the 64 molecule cell indicate that, when reasonable values are employed for k1 k2, k3, and k4, the isotopic guest oscillator is not completely isolated from the neighboring host oscillators. A series of calculations with HDO impurities randomly inserted into a D2O lattice gave frequencies in the OH stretching region approximately 10 cm-1 higher than would be expected if the isolation of the guest oscillator were completely effective. A similar set of calculations in an ?2? lattice yielded frequencies in the OD stretching region which were about 5 cm-1 lower than predicted for a perfectly isolated guest molecule. Because of proton disorder, there was a small variation of these frequencies when the oscillator was moved from site to site within the cell. After correction for this residual coupling, the experimental HDO/D2O and HDO/H2O spectra at 150 K yielded the bond-stretching force constants shown in Table II. The discrepancy between the constant obtained for an OH oscillator and that obtained for an OD oscillator is undoubtedly due to anharmonicities in the potential energy,
Table II. Parameters used to Calculate Spectra

In the free molecule the intramolecular coupling constant k2 is —0.101 mdyn/A (—10.1 N/m). In our earlier work (McGraw and others, 1977) we assumed that this value could be applied to the intramolecular coupling in the crystal. In that work, however, we were unable accurately to reproduce the infrared spectrum, nor were we able to obtain the 3231 cm–1 peak in the Raman spectrum H2O ice (2437 cm–1 in the D2O ice). However, it is known that the intramolecular force constant in symmetrically hydrogen-bonded hydrates is strongly correlated to the value of the stretching force constant kl and becomes more positive as k1 decreases (Fifer and Schiffer, 1970). We therefore now regard 2 as an adjustable parameter which we employ to improve agreement with the experimental spectra. The value of k2 shown in Table II is required to give optimum agreement with experiment at 150 K. Note that the sign of this interaction constant is altered in the condensed phase. Similar results were obtained by Bertie and Bates (1977) who find that a positive value of k2 is required to lit the infrared spectra of ices II and III.*
The intermolecular interaction constant k4 is given by Equation (6) and differs according to the separation and orientation of the oscillators involved. Ikawa and Maeda (1968) have estimated from absolute infrared intensity measurements that the bond dipole derivative μ’ is
4.0 D/A in ice Ih. Formally, this interaction is of infinite range, but proton disorder leads to an orientation averaging that makes the range of the interaction finite. In our model, we must avoid spurious couplings of an oscillator to its own image in another cell, so we have truncated the interaction after three near-neighbor shells.
The side bands observed in the isotope studies of Haas and Hornig ( 1960) are largely due to intermolecular coupling via k3. In our previous work, we assumed that k3 was given by their calculated value of —o. 123 mdyn/A. We now believe that this value represents a lower limit to the actual coupling constant k3, because the sidebands observed by Haas and Hornig are not completely resolved and must include intensity due to the weaker k3 couplings which will tend to enhance the intensity of the sidebands nearer to the central peak. The value of k3 that we use here (Table II), is approximately 20% more negative than that calculated by Haas and Hornig, but requires that the origin of each side band be placed only 5 cm–1 further from the central peak.
The eigenfrequencies and eigenvectors for the coupled 128 oscillator system are calculated using Wilson's FG formalism (Wilson and others, 1955). In the RVM, the G matrix assumes a simple 2x2 block diagonal form in which Gii = μo-μH and Gi+1,i = GI,i+1= μ? cos θ where θ is the intramolecular H-O-H bond angle and μ? and μH are the reciprocals of the oxygen and hydrogen masses. The F matrix is built from the force constants described earlier and the topology of the cell. The Raman intensities are calculated from a bond polarizability model similar to those of Volkenstayn (1941) and of Long (1953), and the infrared intensity from an analogous bond-dipole model. The only parameter required in these intensity calculations is the ratio of the parallel to perpendicular components of the bond polarizability tensor, which Scherer and Snyder (1977) have estimated at 5.6.
The results of these calculations using the force constants in Table II are presented in Figures 15 through 19. We note the following:
(i) Neither the Raman nor the infrared spectra mirrors the density of states. In each case the nature of the modes at each frequency plays an important role in determining the intensity.
(ii) The major features of the Raman and infrared spectra are reproduced.
(iii) An examination of the eigenvectors reveals that, in general, they cannot be readily described in terms of the symmetric and antisymmetric stretching motions of the free molecule. The major exception to this observation is the single mode responsible for the intense, lowest-frequency feature of the Raman spectrum which, to a good approximation, consists of all molecules executing symmetric stretches in phase.

Fig. 15. The calculated density of states for a proton-disordered 64 molecule cell using the parameters of Table II.
(iv) The intensity of the first peak of the Raman spectrum is excessively large. Nearly all of the intensity of the polarized part of the Raman spectrum is confined to this peak, and the calculated ratio of the polarized to depolarized integrated intensities appears to be much too large.
(v) The width of the calculated infrared spectrum is smaller than that of the observed spectrum and the shoulder at high frequencies is not well represented. We believe that much of the intensity in this region may be enhanced by the presence of combination bands of the entire density of states with the lattice modes.
(vi) The first mode in the density of states is separated from the dense distribution of the remaining modes by about 10 cm-1. Because the separation of this mode from the body of the density of states appears to decrease with increasing cell size, we believe it is an artifact of the boundary conditions and the finite size of the cell.
(vii) The intensity of the calculated infrared spectrum is peaked too sharply at 3265 cm-1 (H2O) and 2445 cm-1 (D2O). Though not arising from a single mode this is, in a milder form, an analogue of the excess intensity in the first peak of the Raman spectra.
In a preliminary report of our calculations (McGraw and others, 1977), we were not able to reproduce the infrared intensity and the second feature of the Raman spectrum. This failure was a direct consequence of our insistence that the intramolecular coupling constant k2 be

Fig. 16. The calculated mid observed Raman spectra of polycrystalline H2O. The smooth curie is obtained from the histogram by replacing the delta function intensities with Gaussions of width ΔΩOH.
fixed at its gas-phase value. It is impossible to fit the observed spectra unless this force constant is permitted to change sign. In addition, we argued then that the features of the ?2? and D2O Raman spectra should scale everywhere just as the low-frequency peaks scale. This argument was based on an earlier version of the RVM in which the G matrix was assumed to be diagonal. As the results presented here demonstrate, the scaling argument does not hold and is an artifact of the earlier model.
We may synthesize a continuous spectrum from the histograms of Figures 16b to 19b by replacing each delta function intensity by a Gaussian of equal area. If this Gaussian is regarded as arising from interactions with the lattice modes (via, for instance, the scattering process discussed earlier) then the width of the broadening function may be determined from the first peak of the Raman spectrum. In order to prevent the anomalous intensity in this peak from swamping the other features of the spectrum, we have arbitrarily attenuated the intensity in the first peak of the calculated spectrum by a factor of three. The results of this procedure arc displayed in Figures 16b to 19b. The spectral contours thus produced eliminate the noise in the calculated histograms and are in good agreement with experiment.

Fig. 17. The calculated (a) and observed (b) infrared spectra of polycrystalline ?2?.
In essence, our calculations support Whalley's contention that the features of the vibrational spectrum of ice Ih arise from strong intermolecular coupling, but the consequences of that coupling are quite complex. Simple interpretations in terms of the molecular modes of the free molecule are not viable. The extent of breakdown of the perturbed-molecule picture (which identifies features of the solid spectrum with molecular vibrations) has not been fully appreciated in the past. Given the resolution of the histograms obtained from calculations based on the 64 molecule cell, it is impossible to state unequivocally that no other mechanism, e.g. Fermi resonance with the bending mode, contributes to the OH stretching spectrum. However our calculations strongly suggest that any effects of these other mechanisms on the observed Raman and infrared spectra are minor.
VI. Comments on Structural Models for the Amorphous Solid
Amorphous solid water is only one of a family of similar substances having approximately tetrahedral coordination and no long range order. Alben and Boutron (1975) recognized the similarity between the radial distribution function (RDF) of the low-density form of amorphous solid water and that of amorphous germanium. They were able to show that, with a suitable rescaling of intermolecular distances, Polk's hand-built computer-refined random network (Polk, 1971) reproduced the available X-ray and neutron scattering data reasonably accurately, but not perfectly. Polk's model is a large free cluster assembled using hall and stick models. The coordinates were measured by hand, then refined on a computer by minimizing the energy with respect to a tetrahedral potential devised by Keating (1966).

Fig. 18. The calculated (a) and observed (b) Raman spectra of polycrystalline D2O.
Most of the other models suggested for the low-density form of amorphous solid Si or Ge are similar to Folk's and need not concern us here. One, however, due to Henderson and Herman (1972) differs considerably from Folk's in that it is rather small—only 61 atoms—and incorporates periodic boundary conditions. Weaire and Alben (1972), Alben and others (1973), and Steinhardt and others (1974) have employed this model to explain the vibrational spectra of amorphous Ge and Si. Despite its successes, we feel that the Henderson model has a serious drawback. Unlike the free clusters discussed earlier, the distribution of bond lengths in the Henderson model reproduces the first peak of the RDF of amorphous Ge. Most of the width of that first peak, however, arises from a vibrational contribution to the X-ray scattering and should not be present in a static model. This excessively wide distribution of near-neighbor separations apparently had little effect on the low-frequency vibrational spectra calculated by Alben and others, but it should have serious consequences for the spectrum of H2O(as) in the OH stretching region.

Fig. 19. The calculated (a) and observed (b) infrared spectra of polycrystalline D2O.
The success of hand-built models in predicting the structural, vibrational, and electronic properties of the tetrahedral amorphous semiconductors and the structural properties of low-density H2O(as) led us to consider a similar approach in modeling the high-density form of H2O(as). The density and short-range behavior of the RDF of the high-density amorphous solid suggest that a random network based on one or more of the high-pressure polymorphs of ice—most likely ices II and III—could provide a suitable model. R. McGraw and S. A. Rice constructed a ball and stick model of the oxygen network of ice II as a preparatory step in the generation of a high-density random network. They found, however, that the ball and stick model did not assume the spatial symmetry of the ice II lattice (S6 2), but rather relaxed to the higher symmetry structure D3d 6 In ice II, there are two types of oxygen sites characterized by the local symmetry. Each oxygen is surrounded by four bonded nearest neighbors between 2.75 A and 2.84 A and a fifth non-bonded near neighbour at 3.25 A. In the model, on the other hand, all oxygens become equivalent, and the non-bonded near neighbor of each oxygen is closer than the hydrogen-bonded neighbors. The striking differences between the hand-built model and the observed structure of ice II result from the exclusion of proton influence in the model. Indeed, it is the subtlety and complexity of the intermolecular forces in the condensed phases of water which yield the startling variety of structures in the several forms of crystalline and amorphous solid water. Thus, the observed ordering of the protons in ice II is essential in producing a minimum in the free energy and cannot be represented by any model, whether hand-built or constructed on a computer, which ignores the nature of the water molecule and hence those features of the intermolecular potential which distinguish the ice networks from the simpler crystal structures of germanium and silicon.
The deficiencies discussed above do not imply that the construction of continuous random-network models for the high-density amorphous solid is a futile effort. Indeed, such simple structures can serve as a useful starting point from which more sophisticated models may be developed. In order to improve on these simple models, however, it is necessary to determine whether any existing parameterization of the water pair potential is sufficiently accurate to generate the structural properties of the high-pressure ices which may also be present in the high-density amorphous solid.
VII. Theoretical Modeling of Vibrational Spectrum of H2O(as)
It is useful to distinguish between two types of disorder in an amorphous material. The first is global in character and consists of an irregular connectivity which cannot be identified with that of any crystal structure. It is this global disorder that is most apparent in the various random-network models of amorphous solids. The second type of disorder can be characterized as a local spatial inhomogeneity; it leads to continuous distributions of the bond lengths, bond angles, and molecular orientations, with non-zero widths. This local disorder can be quite subtle and is difficult to predict and sometimes cannot be measured accurately. Clearly, in the amorphous solid the two types of disorder are interdependent. However, it is possible when modeling the various properties of the amorphous solid to ignore or minimize one form in favor of the other.
For example, polycrystalline ice Ih, though not an amorphous solid in the sense of the preceding section, exhibits both global and local disorder by virtue of the irregularity in the positions of the protons. Whalley (1968) has suggested that this global disorder must yield locally different molecular environments which lead to a narrow distribution of O—O separations (and perhaps of O-H-O bond angles). In Whalley's and our interpretation of the band shape of the dilute HDO/D2O and HDO/H2O spectra, the global disorder (which defines the F matrix of the 64 molecule cell) is ignored and the band shape is assumed to arise from the existence of an ensemble of independent slightly different OH or OD oscillators.
In contrast, our calculations of the vibrational spectrum described in Section V supressed the local in homogeneities by using an identical bond stretching force constant at each site. The dilute isotopic mixture calculations sketched earlier, where guest oscillators were inserted in the 64 molecule cell, also did not include any local disorder. The failure to predict accurately the peak frequency of the independent oscillator in these calculations suggests that the neglect of the global disorder leads to some error, though it should be adequate for calculation of the band shape since the dispersion of the frequencies as the oscillator was moved from site to site in the cell, was found to be quite small. In applying the model developed in Section V to the amorphous solid we find that both the local and global disorder must be considered.

Fig. 20. (a)The experimental Raman spectrum for H2O(as) at 130 K.
(b) The calculated Raman spectrum obtained from the Henderson cell with no dispersion of, force constants.
(c) The calculated spectrum obtained using the 64. molecule ice cell with no dispersion of k1, force constants.
(d) The calculated spectrum obtained using the Henderson cell and the distribution of k1, force constants described in the text.
(e) The calculated spectrum obtained using the 64-molecule ice cell and the distribution of k1, force constants described in the text.
Earlier, we remarked that the Henderson model for amorphous solid germanium contains an excessively wide distribution of interatomic near-neighbor distances. As a result, when the model is rescaled to give the average near-neighbor distance in amorphous solid water, it predicts a distribution of frequencies (via the correlation discussed in Section IV) which has a breadth of over 500 cm-1, to be compared with the observed FWHM of 85 cm-1 in HDO/ D2O(as). Despite this rather spectacular failure, the Henderson cell remains a useful model for H2O(as) because its small size (61 atoms) and periodic boundary conditions permit an easy calculation of the vibrational spectrum. However, when we decorate the Henderson cell with protons and calculate the vibrational properties, we must ignore the actual distribution of bond distances in assigning the force constants.
As in polycrystalline ice Ih, the stretching force constant k1 is assigned from the (corrected) peak frequency of the Raman spectra of the HDO/D2O and HDO/H2O amorphous solids. The inter- and intramolecular force constants we used are identical to those employed in the calculations on polycrystallinc ice Ih (see Table II). The predicted spectra of H2O(as) are shown in Figures 20 and 21. Also shown are the results of a calculation using the force constants for the amorphous solid in the 64 molecule cell employed in the studies of poly-crystalline ice Ih. Note that there is little difference between the results of the two calculations, and that the position of the first peak is predicted to be some 30 cm–1 higher than that observed. This discrepancy could probably be rectified by increasing the strength of the intermolecular coupling. It is difficult to justify such an increase, however, because the average O—O distance is greater in the amorphous solid than in ice Ih and if anything we would expect the intermolecular coupling to decrease.
Suppose the contours observed in the spectra of the dilute isotropic mixtures are indeed due to a variation of the force constant kl from bond to bond; it is not difficult to incorporate that distribution into our model. Assuming that the observed intensity at any frequency is proportional to the number of guest oscillators with that frequency, we constructed a histogram of N frequencies which reproduced the observed band shape, Here, N is the number of oscillators in the cell (128 for the ice Ih cell; 122 for the Henderson cell). These N frequencies are then converted to bond-stretching force constants and assigned randomly to the individual oscillators of the cell. The resulting distribution of force constants is centered about the value of*, obtained from the peak frequency; it has a half width Δk1 related to that of the appropriate HDO/D2O or HDO/?2? spectrum.
The FWHM of the HDO/D2O isolated oscillator peak is 26 cm-1 in polycrystalline ice Ih. This leads to a distribution of OH force constants with the FWHM shown in Table II. The FWHM of the distribution of OD force constants obtained from the HDO/?2? spectrum is also shown. The resulting frequencies for pure H20 ice Ih are only slightly different from those obtained from our calculations without any distribution in k1. Indeed, the only major change in an 8 cm–1 downward displacement of the lowest frequency modes, a change which improves agreement with experiment.
The FWHM of the peaks in HDO/H2O(as) and HDO/D2O(as) are considerably larger than the corresponding values for the polycrystalline ices. These then lead to a substantial distribution in the diagonal elements of the F matrix. The pure H2O spectra obtained from these force constants arc shown in Figures 20 and 21. These spectra differ markedly from those calculated without any distribution of force constants. The lowest-frequency peaks are shifted downward by nearly 50 cm–1, the density of states and both the Raman and infrared spectra are substantially broadened, and the major features of both predicted spectra become poorly defined. In addition, the nature of the modes at the lowest frequencies is changed. No longer is there a single mode in which all molecules are stretching in phase, and the intensity in the Raman spectrum is now shared among several modes separated by as much as 20 cm–1. Again we find that, if the same distribution of force constants is used in the 64 molecule ice Ih cell, nearly identical predictions are obtained. Similar results are obtained, but not shown, for D2O(as).

Fig. 21. (a) The calculated infrared spectrum for H2O(as) obtained using the Henderson cell and no dispersion of k1 force constants.
(b) The calculated infrared spectrum for H2O(as) obtained using the 64 molecule ice cell and no dispersion of k1 force constants.
(c) The calculated infrared spectrum obtained using the Henderson cell and the distribution of k1 force constants described in the text.
(d) The calculated infrared spectrum obtained using the 64 molecule ice cell and the distribution of kl force constants described in the text.
(e) The experimental infrared spectrum of H2(as) at 70 K.
As a result of these studies we conclude that the vibrational spectra in the OH stretching region are not sensitive to the global disorder in the system provided that a four-connected, unbroken network is maintained. Indeed, the spatially regular 64 molecule cell obtained from the oxygen lattice of poly crystalline ice Ih seems to serve as well as the Henderson cell in modeling the vibrational properties of the amorphous solid. We note, however, that the global irregularity of the proton positions is essential in dispersing the vibrational states over the region of interest. We also conclude that a modest amount of local disorder, as in ice Ih, has little effect on the OH stretching vibrational spectrum. On the other hand, the relatively large local disorder in the amorphous solid has considerable importance and appears to be responsible for the major differences between the vibrational spectra of the amorphous solid and that of ice Ih.
Acknowledgements
Our research on amorphous solid water has been funded by grants from the United States Public Health Service (DHEW/PHS/NIH 5-R01 GH-22728-02) and National Science Foundation (NSF CHE74-08377). W.G.M. thanks the United States Public Health Service for a postdoctoral fellowship award (PHS NRSA No. 5 F32 GM 05350-02). We have benefitted from the use of facilities provided by NSF for materials research at the University of Chicago.
Discussion
W. B. KAMB: From your diffraction and spectroscopic data, can you say anything about the fraction of broken (or dangling) H-bonds present in amorphous water?
S. A. RICE: Using the fact that the densities of ice Ih and low-density amorphous solid water are very nearly the same, I believe there must be very few or no broken hydrogen bonds in the low-density amorphous solid. Less is known about the high-density amorphous solid but if the conjecture that it is related to a higher ice type is correct, I again conclude there are very few or no broken hydrogen bonds.
G. P. JOHARI: It might be of interest to you to know that your vibrational frequencies for polycrystalline ice near 3100 cm,–1 increase linearly with the square of temperature The slope is approximately 1 X 10⁻³cm-3K–2. I am not certain at the moment as to what theoretical implications such a relation has.
RICE: I do not know whether your suggested fit is merely a representation of the temperature dependence of the thermal expansion of ice or something else. The fit to the thermal expansion model is at least physically motivated, so I prefer it until a better physical model is proposed.
E. WHALLEY: From a different approach to the interpretation of the OH stretching region of both crystalline and amorphous ice, a somewhat more physical picture of the origin of the bands can be obtained. The basis is first to predict the spectrum of ordered cubic ice and to argue that the observed bands of disordered ice are what are left where the cubic ice is disordered. The observed Raman bands can then be described as follows (Whalley, 1977):
3 083 cm-1, v1 with all molecules vibrating nearly in phase;
3 209 cm–1, v3 transversely dipolarized;
3 323 cm–1, v3 longitudinally dipolarized;
3 402 cm –1, v1 with adjacent molecules vibrating nearly out of phase.
The v3 vibrations are probably little coupled, and the width of the band is determined largely by the v1 vibrations. Although the symmetry of the hypothetical ordered ice Ic forbids coupling of the v1 and v3 motions at the zone centre, it is allowed at a general point in the Brillouin zone, and will of course occur in disordered ice. To learn about the extent of the coupling it is of course, necessary to do detailed dynamical calculations, as reported by Rice.