


1. Introduction
The determination of trace chemical species (notably the major ions) in ice cores is becoming increasingly important as an indicator of past atmospheric conditions and is an important tool for palaeoclimatology. With environmental change, on both a local and a global scale, the levels of dissolved ions can change, resulting in a disturbance of the chemical record in the ice sheet. Defining the seasonal cycle for each chemical species gives information on changes m air-mass origin, transport pathways and source strength, over an annual cycle. This information is necessary for palaeoclimatic reconstruction from ice-core records.
The Dome Summit South (DSS) ice core provides high-resolution climatic and environmental information through the Holocenc and Last Glaciol Maximum. The DSS site, situated 4.6 km south-southwest of the Law Dome summit in East Antarctica, provides an ideal location for investigation of chemical and other signals in fine detail. The DSS site is characterised by very high accumulation (which is relatively uniform throughout the year (Van Ommen and Morgan, 1997)), minimal disturbance by wind of the surface snow, and relatively low temperatures (Morgan and others, 1997). Specific site characteristics are shown in Table 1. DSS is one of the most northerly Antarctic deep drilling sites (apart from the peninsula region), and is potentially sensitive to climate signals over the Southern Ocean. Also at present, there is no evidence to suggest that katabatic winds significantly influence the air mass over the summit of Law Dome. These winds are believed to flow north, off the East Antarctic ice sheet and around the dome. The dome mainly experiences easterly airflow caused by the low-pressure cyclonic systems which frequently centre around 65°S (Reference BromwichBromwich, 1988).
Table. 1. DSS site characteristics

Seasonal signals of oxygen isotopes (δ18O), electrical conductivity and peroxide are well defined in the core, and accurate ice-dating (back to AD 1304) has been achieved using these signals (Morgan and others, 1997). Seasonal cycles in δ18O have been detected as far back as 4000 BP. in this paper, we present some preliminary chemical measurements on ice cores from the DSS site and perform a seasonal synthesis on these initial results. Composite seasonal signals were obtained by stacking 28 years of data, thus allowing a more robust interpretation of the chemical variations and reducing the effect of interannual variation.
2. Methods
The ice used in this study was taken from three cores drilled at the DSS site. The main DSS deep core was sampled between 125 and 138 m, corresponding to dates between 1809 and 1831 (16 years). The years 1815-21 were not used in the seasonal synthesis, due to a disturbance in the chemical record by the Tambora eruption (Morgan and others, 1997). Two shallow cores were hand-augcrcd in 1992 and 1986. Firn from the top section of these cores was sampled for chemistry, to give data from 1992-86 and 1986-80.
Samples of ice were analyzed for a suite of ionic species (Na+, K+, Mg2+, Ca2+, MSA− , Cl− , NO3 −, SO4 2-). The samples were prepared from inner core sections, using a band-saw, and were further cleaned in a laminar-flow clean-air cabinet by removing around 3 mm of ice with a microtome blade. Contiguous samples were taken at intervals, giving around 10-15 samples per year. Chemical measurements were carried out by the Australian Government Analytical Laboratory, using ion chromatography, as described in Reference Ivey, Davies, Morgan and AyersIvey and others (1986).
The data were resamplcd onto a uniform time-grid using linear interpolation, to give 24 points per year. Average seasonal cycles were obtained by averaging each point over the 28 years covered. Year beginnings were arbitrarily defined as the peak in the δ18O record. The summer δ18O peak occurs around 10 January (Van Ommen and Morgan, 1997), so the annual cycles were converted to a calendar year using a 10 day offset.
3. Results and Discussion
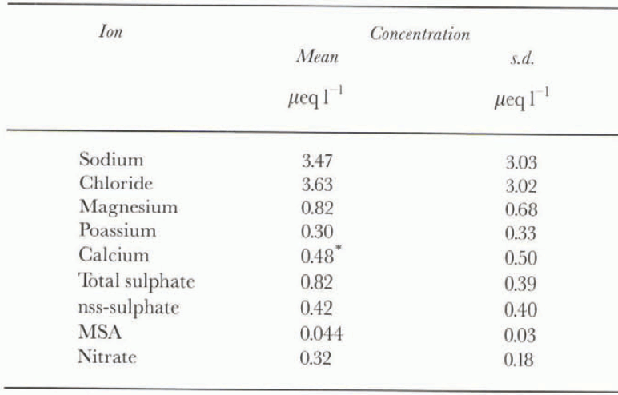
The average levels of each of the ionic species determined at DSS are shown in Table 2.. The concentrations of the dissolved ions are low compared with those at coastal Antarctic sites (Reference Mulvaney and WolffMulvaney and Wolff, 1994). However, while DSS lies only 120 km inland and can be considered a coastal Antarctic site, the site is 1370 m a.s.l. Levels of ions of marine origin were found to decrease with distance from the coast and altitude at Law Dome (B.Johnson and J. Chamberlain, unpublished data) and generally across Antarctica (Mulvaney and Wolff, 1994). Also, the accumulation rate at DSS is very high compared with other Antarctic sites, with an average of 0.70 m a−1 (ice equivalent). The low ion concentrations may be attributed to a combination of altitude and the high accumulation rate. The levels of sea salts were similar to concentrations measured at Gome?. Nunatak on the Palmer Land plateau, which is at a similar elevation and distance inland (Reference Mulvaney. and PeelMulvaney and Peel, 1988).
Table. 2. Mean concentrations and standard deviation of the ionic species at DSS
The major ions found at DSS can be grouped into two categories, based on their principal source:
-
1. Sea salts (Na+, Κ+, Mg2+, Ca2+, Cl− and SO4 2-)
-
2. Marine biogenic compounds (SO4 2- and methane sulphonie acid (MSA)).
The seasonal variation of each group is considered below. Nitrate does not fall into either of these main groups and is considered separately.
3.1. Sea salts
The concentrations of sodium, chloride and magnesium reflect sca-salt input, and the average equivalence ratios of chloride/sodium (1.18 ± 0.02) and magnesium/sodium (0.23 ± 0.01) in the ice agree well with average scawater ratios of 1.16 and 0.23, respectively. Sodium was used as a measure of sea-salt aerosol input, and the sea-salt fractions of sulphate, potassium and calcium were calculated from sodium based on their ratio in seawater. This sca-salt fraction was then subtracted from the total, to give the non-sca-salt (nss) component of the individual ionic species.

Fig. 1. Mean seasonal variations of chloride, sodium and magnesium.
The major sea-salt species of sodium, chloride and magnesium exhibit similar seasonal distributions (1. The average seasonal cycles were graphed over 2 years to illustrate the structure of both the winter and summer features. The error bars shown for the magnesium distribution represent the error of the mean for the 28 years of data used. The errors for sodium and chloride were of similar magnitude, and were omitted for clarity. The seasonal distributions of the sea-salt species were characterised by a broad winter peak and late-summer minimum. The levels of sea salts increase during March and have a small shoulder, before increasing again to peak in late August. The sea-salt level then drops steadily to a minimum injanuary. The seasonal variation of potassium was essentially similar to that of the other sea salts, as indicated by the median potassium distribution (2. This record was very noisy and contained large spikes. Other researchers have also found noisy potassium records (Reference Steffensen, Clausen, Christensen, Wolff and BalesSteffensen and others, 1996).
The timing of the sea-salt peak agrees well with the peak in aerosol sodium levels at Mawson (Reference SavoieSavoie and others, 1993), and is synchronous with a general increase in stormi-ness over the Southern Ocean during the winter months.

Fig. 2. Seasonal variation of potassium fractions.
The mean seasonal wind-speed distributions from Casey (110 km from DSS) and Macquarie Island (54°S in the Southern Ocean) are shown with the seasonal sodium cycle in figure 3a. The wind-speed records are monthly averages over 30years from 1960 to 1990 (Reference Russell-Head and SimmondsRussell-Head and Simmonds, 1993). The shape of the seasonal sodium curve shows some similarities to the wind-speed record from Casey, but the increase in sea salt slightly lags the increase-in wind speed, whereas both signals drop off at a similar time. The 30 year record of mean monthly wind speed over Macquarie Island shows a bimodal seasonal signal, with elevated wind speeds in March-April and September (fig. 3a). The seasonal maximum sea-salt level occurs between the wind-speed maxima observed at Casey and Macquarie

Fig. 3. Mean seasonal variation of (a) sodium with wind speed from Macquarie Island (MI) and Casey, and (b) sodium levels with sea-ice extent at 110°E. (The sodium, wind-speed and sea-ice records were reseated for ease of comparison to give their respective ranges between 0 and).
Island, suggesting perhaps that the shape of the sea-salt signal better represents the wind-speed distribution or some such measure ofstorminess at the source (i.e. between Casey and Macquarie Island, over the Southern Ocean where the marine aerosols are produced). Alternatively, the observed pattern may simply reflect the non-linear dependence of aerosol formation on wind speed, coupled with the delays caused by reservoir and transport effects.
The shoulder on the leading edge of the winter peak in sea-salt aerosol is mainly due to a small number of very high values, and is not as distinct in the median profile (not shown). These high values appear to occur at the same time of year (around April-May), but not every year. At the same time of year, a peak occurs in the Macquarie Island wind-speed distribution, and a shoulder occurs in the Casey wind-speed record (fig. 3a). This increased sea-salt flux may therefore be caused by a small number of large storm events which occasionally occur early in the year, lofting higher concentrations of sea-salt aerosol onto the summit of the dome. The seasonal variation of sodium found in aerosol at Mawson was not well defined (Savoie and others, 1993), but the general pattern reflects that found in the ice at DSS, including the “hump” around April-May.
The seasonal sea-salt signal was also compared to the average monthly sea-ice extent (fig. 3b). The sea-ice curve was taken from 10 years of data (1973-82) at 110° Ε (Reference JackaJacka, 1983). Sea-ice extent is at a minimum in January—February, and rises to a maximum in September-October, just after the sea-salt peak at DSS. The rise in both signals was essentially synchronous with the levels of marine aerosol increasing as the sea-ice cover increases. However, an increase in sea-ice cover might be expected to reduce the production of marine aerosols by reducing the amount of open water available. Mulvaney and Peel (1988) found that the seasonal cycle in chloride levels at a coastal site on the Antarctic Peninsula was dependent on the amount of open scawater. Also, as the sea ice extends further out to sea, this would have the effect of moving the source further from the core site, contributing to a reduction in sca-salt levels.
Law Dome, however, lies in the East Antarctic sector between 90° and 140°E, where the coast extends furthest from the South Pole and the Southern Ocean is at its warmest (Reference Gloersen., Campbell, Cavalieri, Comiso, Parkinson and ZwallyGloersen and others, 1992). The sea-ice cover in this region is the least extensive compared to other sectors, and seasonal changes in the sea-ice extent are not as pronounced

Fig. 4. Seasonal variation of calcium fractions.
(Gloersen and others, 1992). At maximum sea-ice extent the percentage cover is often less than 70%, and in some areas the sea-ice cover extends only 300 km off the coast. It is therefore reasonable to assume that the sea ice has a reduced impact on production of sea-salt aerosols in this region. It may also indicate that the source of the sea salts at DSS is further out in the Southern Ocean, in a region unaffected by sea ice.
Calcium is a minor component of sea-salt aerosol, and is an indicator of terrestrial dust (Mulvaney and Wolff, 1994). The seasonal distribution of total calcium is noisy, but generally follows that of the major sea salts (4. The total calcium signal is composed of a sea-salt signal atop a background nss-calcium signal. It would appear that for the epochs studied at DSS, there was no seasonal structure to nss-calcium, and hence the influence by continental air masses docs not appear to vary throughout an annual cycle.

Fig. 5. Average seasonal cycle of total sulphate and nss-sul-phate.
3.2. MSA and nssSO4
Sulphate has a number of sources in Antarctic ice cores, including sea salt, volcanic emissions, the oxidation of dimethyl sulphide (DMS) and a minor influence from anthropogenic activities. The only source of MSA, on the other hand, is the oxidation of DMS. DMS is a volatile sulphur gas produced by certain species of phvtoplankton, and can be considered a general indicator of biological activity (Reference Liss, Malin, Turner., Restelli and AngeletliLiss and others, 1993), particularly in the Southern Ocean (Curran and others, in press). It is therefore generally believed that the levels of MSA and biogenic nss-sulphate in ice cores at coastal Antarctic sites are controlled by biological activity in the nearby Southern Ocean, especially during summer (Wagcnbach, 1996). The influence of volcanic emissions is usually easy to detect, with a large increase in the background sulphate signal. The seasonal data presented here were specifically chosen from periods with no evidence of volcanic influence.
The composite seasonal cycle of total sulphate at DSS shows a broad spring/summer peak, with lowest levels around June and highest levels in January (5. The fraction of nss-sulphate remaining after sea-salt correction shows a “sawtooth” seasonal distribution (5. Minimum levels were found in August, with a steady rise to a sharp January peak.The concentration of MSA varies in a similar manner to nss-sulphate, with a well-defined summer maximum and a winter minimum (6. This agreement further confirms that biological activity is the main source of nss-sulphate, and that this signal is clearly recorded in the DSS ice core.
While there is agreement on the timing and shape of the average seasonal cycle with 28 years of data, there is significant interannual variability in the individual record of each species, notably MSA (7. Also, there appear to be anomalous years where the summer MSA peak is “missing” (e.g. 1985 in Fig. 7). Further measurements of MSA on specific core sections and other cores covering the same time periods will be repeated to attempt to reproduce these MSA anomalies.

Fig. 6. Average seasonal cycle of MSA and nss-sulphate.
The average seasonal cycle shows nss-sulphate levels close to zero tim ing winter, but in some years the concentrations were negative (e.g. either side of the 1980 summer peak (7). This has been recorded at a number of core sites, and is believed to be caused by sulphate depletion as a result of sca-salt fractionation (Reference Minikin, Wagenbach, Graf and KipfstuhlMinikin and others, 1994). Recently it has been postulated that this fractionation may occur as a result of rapid freezing of water from lead opening ( in the sea ice), resulting in a lowering of the sulphate/ sodium ratio (Reference Hall, Leonard., Jasper and BeerHall and Leonard, 1997). Subsequent suspension of the fractionated salt and transport to the site was suggested to account for the very low (to negative) concentrations of nss-sulphate found in winter. This has important implications for the ratio of MSA/nss-sulphate which is often used to assess changes in biological activity.
The form of the seasonal cycles at DSS is similar to that of atmospheric nss-SO4 and MSA determined at Neumayer station (Reference Wagenbach, Wolff and BalesWagenbach, 1996), Mawson station (Savoie and others, 1993) and Cape Grim (Reference Ayers, Ivey and GilletAyers and others, 1991). Also, at Dye 3, Greenland, there is agreement between the MSA seasonal signal in the atmospheric boundary layer and fresh snow (Reference Jaffrezo, Dibb, Bales, Netfl and DelmasJaffrezo and others, 1995).
While there is evidence to suggest that ice cores preserve the current atmospheric MSA signal, there is also evidence that the MSA can diffuse with in the firn and the ice (Wolff, 1996). This diffusion can result in an offset between the nss-sulphate and MSA records. This did not appear to be the case for the epochs studied at DSS, since there was good agreement in the general timing of the MSA and nss-sulphate distributions.

Fig. 7. Levels of MSA and nss-sulphate as a function of depth in the time period 1980—86.
3.3. Nitrate
The atmospheric nitrogen cycle is highly complex and there is a wide range of factors that can alfect the nitrate level in polar ice. Currently, there is debate on whether the long-term nitrate signal in ice is modulated by solar activity, and there is compelling evidence in the literature both for (Drcschholf and Zeller. 1990, 1994) and against (Reference Legrand and KirchnerLegrand and Kirchner, 1990) this modulation. Also, there is limited knowledge on deposition processes and the extent to which post-depositional changes alTcct the nitrate record (Wolff, 1995).
At DSS, the seasonal nitrate distribution exhibits a sharp peak in January, which decreases to a minimum in June (8. Nitrate levels slowly increase until November, when levels begin rising rapidly to theirjanuary maximum. The “hump” in the nitrate distribution from June to November shows interannual variation in its timing, but it is present in all the epochs studied. At this stage it is difficult to delermine the frequency with which and the extent to which this “hump” occurs, and whether it is a regular seasonal event. The occurrence of a summer nitrate peak is in agreement with other Antarctic ice-core studies (Legrand and Kirchner, 1990; Reference Whitlow, Mayewski and Dibb.Whitlow and others, 1992; Minikin and others, 1994; Wagcnbach and others, 1994; Reference YangYang and others, 1995).

Fig. 8. Average seasonal cycle of nitrate.
The shapes of the seasonal curves of nitrate in aerosols over Mawson station (Savoie and others, 1993) and Neumayer station (Minikin and others. 1997) are essentially similar to that found at DSS (8. The timing of the nitrate peaks in the aerosol is different to that found in the ice cores. The aerosol records both show an early-spring “hump”, followed by a late-spring peak (rather than a summer peak as seen in the ice cores). The exact reason for this difference in timing is uncertain at this stage (Minikin and others, 1997), and may be a function of nitrate loss from the ftrn. Post-depositional changes in the nitrate record have been observed at a number of Antarctic sites Minikin and others, 1994; Wolff, 1996), but these changes are believed to be less important at higher-accumulation sites (Reference Mayewski and M.Mayewski and Legrand, 1990; Wagcnbach and others, 1994).
The early spring “hump” may be due to long-range transport, and Savoie and others (1993) argued that the main source of nitrate at Mawson was continental, since they found that the seasonal nitrate profile was similar to 210Pb. However, this has not been confirmed at other Ant-ait tic coastal sites (Wagcnbach, 1996). It is now thought that the main sources of nitrate in Antarctica are production from lightning, and oxidation from nitrous oxide in the stratosphere (Legrand and Kirchner, 1990; Mayewski and Legrand, 1990; Whitlow and others, 1992). Nitrate from these sources enters the troposphere via air exchange or sedimentation of nitrate-rich polar stratospheric cloud particles (Mulvaney and Wolff, 1993). Loss of polar stratospheric-cloud particles from the stratosphere occurs in early spring, and may result in the early-spring “hump” in the nitrate record.
While the summer nitrate maximum in Antarctic ice is well documented, the exact mechanism responsible for the peak is currently poorly understood. The summer peak may be due to a combination of enhanced stratospheric transfer and seasonal variations in production from other sources. It is not clear to what extent seasonal changes in nitrate production from biological activity affect the nitrate signal, but biological activity is generally considered a minor source of nitrate Í Reference Clausen and DelmasClausen, 1995).
4. Conclusions
These preliminary trace-chemical patterns in DSS ice, in conjunction with the year-round accumulation, show that the DSS site is mainly affected by marine air. This is evident from the winter snow being dominated by sea salts, and the summer by marine biogenic compounds (nss-sulphate and MSA). The seasonal distribution of sea salt indicates that the sea-ice extent does not play an important role in controlling sea-salt levels over Law Dome. It would appear that storminess over the Southern Ocean is the main climate variable affecting sea-salt levels at DSS. The seasonality of MSA and nss-sulphate reflects that found in the atmosphere at other sites, and can be explained by the variation in source strength (i.e. biological activity).
The seasonal distribution of nitrate at DSS agrees with other polar ice-core studies showing a characteristic summer maximum. The complexity of the atmospheric nitrogen cycle, the numerous possible sources, the conflicting evidence in the literature and the lack of information on the extent and nature of post-depositional processes make it difficult to interpret the nitrate distribution at this stage. It is promising, however, that the shape of the seasonal nitrate signal recorded at DSS resembles the seasonal variations in atmospheric nitrate at other Antarctic sites, including secondary structure, albeit with different timing.
While depositional and post-depositional effects have been ignored, the results presented here show a distinct seasonality of most major ions at the DSS site, providing some information on the sources of these ions and the air masses allecting Law Dome. The preservation of sub-seasonal detail and the apparent connection with the Southern Ocean make this Law Dome site one of the most sensitive ice-core locations for the study of climate variability.
Acknowledgements
We would like to thank C. Wookey, J. Wilkinson, S. Woon and all participants in the DSS drilling programme (1986-93). Also, we thank the reviewers for helpful comments.


