


1. Introduction
Labor is a key input in animal agriculture, but there exists little research on how an increase in the cost of labor impacts dairy, egg, and meat industry output and profitability. Federal and state minimum wage laws are being debated in 2022. This paper sheds new light on the issue by analyzing the impacts of minimum wage legislation on eggs, an important animal agriculture sector.Footnote 1 Specifically, we use an equilibrium displacement model (EDM) to evaluate the impact of an increase to the federal or state minimum wage on the Iowa egg industry.
The paper begins with a brief discussion of the Fair Labor Standards Act (FLSA) and shows that state-level minimum wages are relatively low in egg-producing states and that actual wages paid are above the federal minimum. Thus, an analysis of the impact of raising the minimum wage requires a flexible model to handle scenarios where the FLSA may be binding or not binding. Then, we provide a detailed description of the Iowa egg supply chain and provide industry statistics. Subsequently, we introduce the model, and present results, which include a sensitivity analysis to check the robustness of results to assume model parameters. An online appendix provides a mathematical derivation of our EDM.Footnote 2
We examine two potential equilibrium outcomes that might occur in the Iowa egg industry after a minimum-wage increase: a binding minimum-wage equilibrium outcome and a nonbinding minimum-wage equilibrium outcome. The binding model is used when the equilibrium wage remains below the legal minimum prior to its implementation. Conversely, the nonbinding model applies when the egg industry wage is above the legal minimum. Both models use demand and supply elasticities to calculate percentage changes for quantities and prices. We apply these percentages to egg price and quantity data to compute absolute quantity losses and price increases. Our findings show that the overall effects of raising the minimum wage to $15.00 are economically small in the Iowa egg industry, decreasing the production by 0.86% while increasing retail prices by slightly over 1%. A primary reason for the economically small effects is the industry’s already relatively high wages which are needed to attract labor from other industries, such as the foodservice industry. Although our results do not change substantially, we conjecture that to stay competitive, egg industry employers likely would increase the wage to some level above the $15.00 minimum wage to draw labor into a rural area. Despite these seemingly small effects, egg producers may nonetheless struggle in the short run to respond to immediate labor expenses should the state or nation not phase in its minimum wage over the course of several years.
1.1. Overview of Federal and State Policies on Minimum Wages
In recent years, increases to the minimum wage and other aspects of overall wage compensation, including health insurance and retirement contributions, have been widely debated. Congress introduced the first successful federal minimum wage by passing the FLSA in 1938. The FLSA established that all workers involved in the production of goods for interstate commerce—commerce between and among different states—were to be paid no less than 25 cents an hour. The minimum wage does not rise with inflation, so it can only change through an act of Congress. Congress has raised the minimum wage 22 times, with the average gap between increases being about 3 years. In January 2022, the hourly wage set by the more than decade-old Fair Minimum Wage Act of 2007 has not changed, and the United States maintains a federal minimum wage of $7.25.
Many states currently have minimum wages exceeding the federal minimum wage. Figure 1 shows the minimum wages for each state beginning January 1, 2021. Several states have passed legislation for a $15.00 minimum wage and are incrementally increasing the wage over multiple years until a target wage is reached.Footnote 3 It is likely that if a significant increase to the federal minimum wage is passed, Congress will phase in the increase over several years. Figure 2 shows egg production by state. A comparison of Figures 1 and 2 shows that most of the major egg-producing states currently have a relatively low minimum wage. This suggests that a new federal minimum wage, or state-level minimum wage increases in some or all major egg-producing states, could be especially impactful to the egg industry. Many individual states continue to increase their minimum wages periodically.
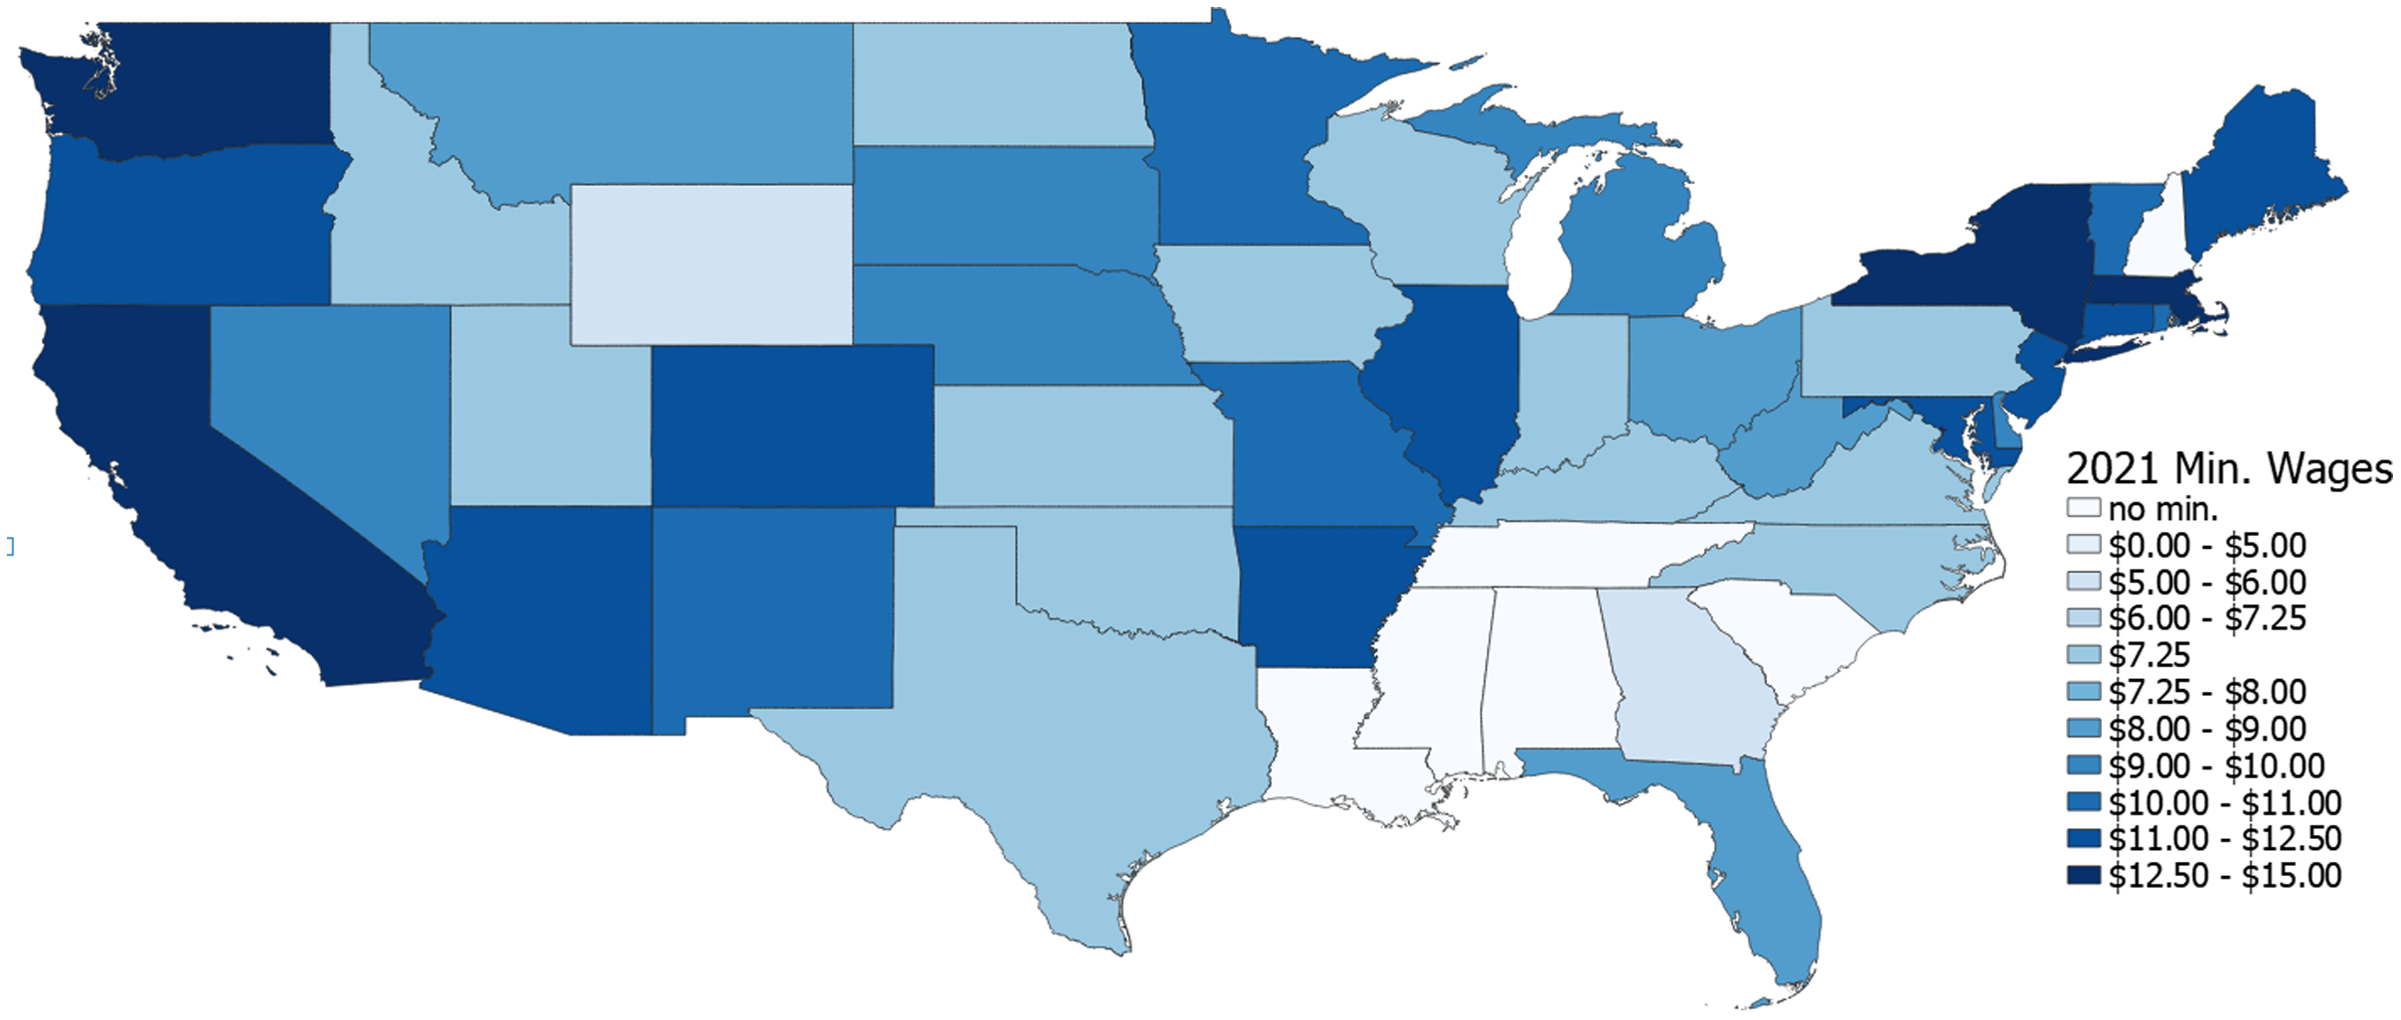
Figure 1. State minimum wages as legislated for January 1, 2021.
Source: Authors’ depiction using National Conference of State Legislatures (NCSL) 2020 data.
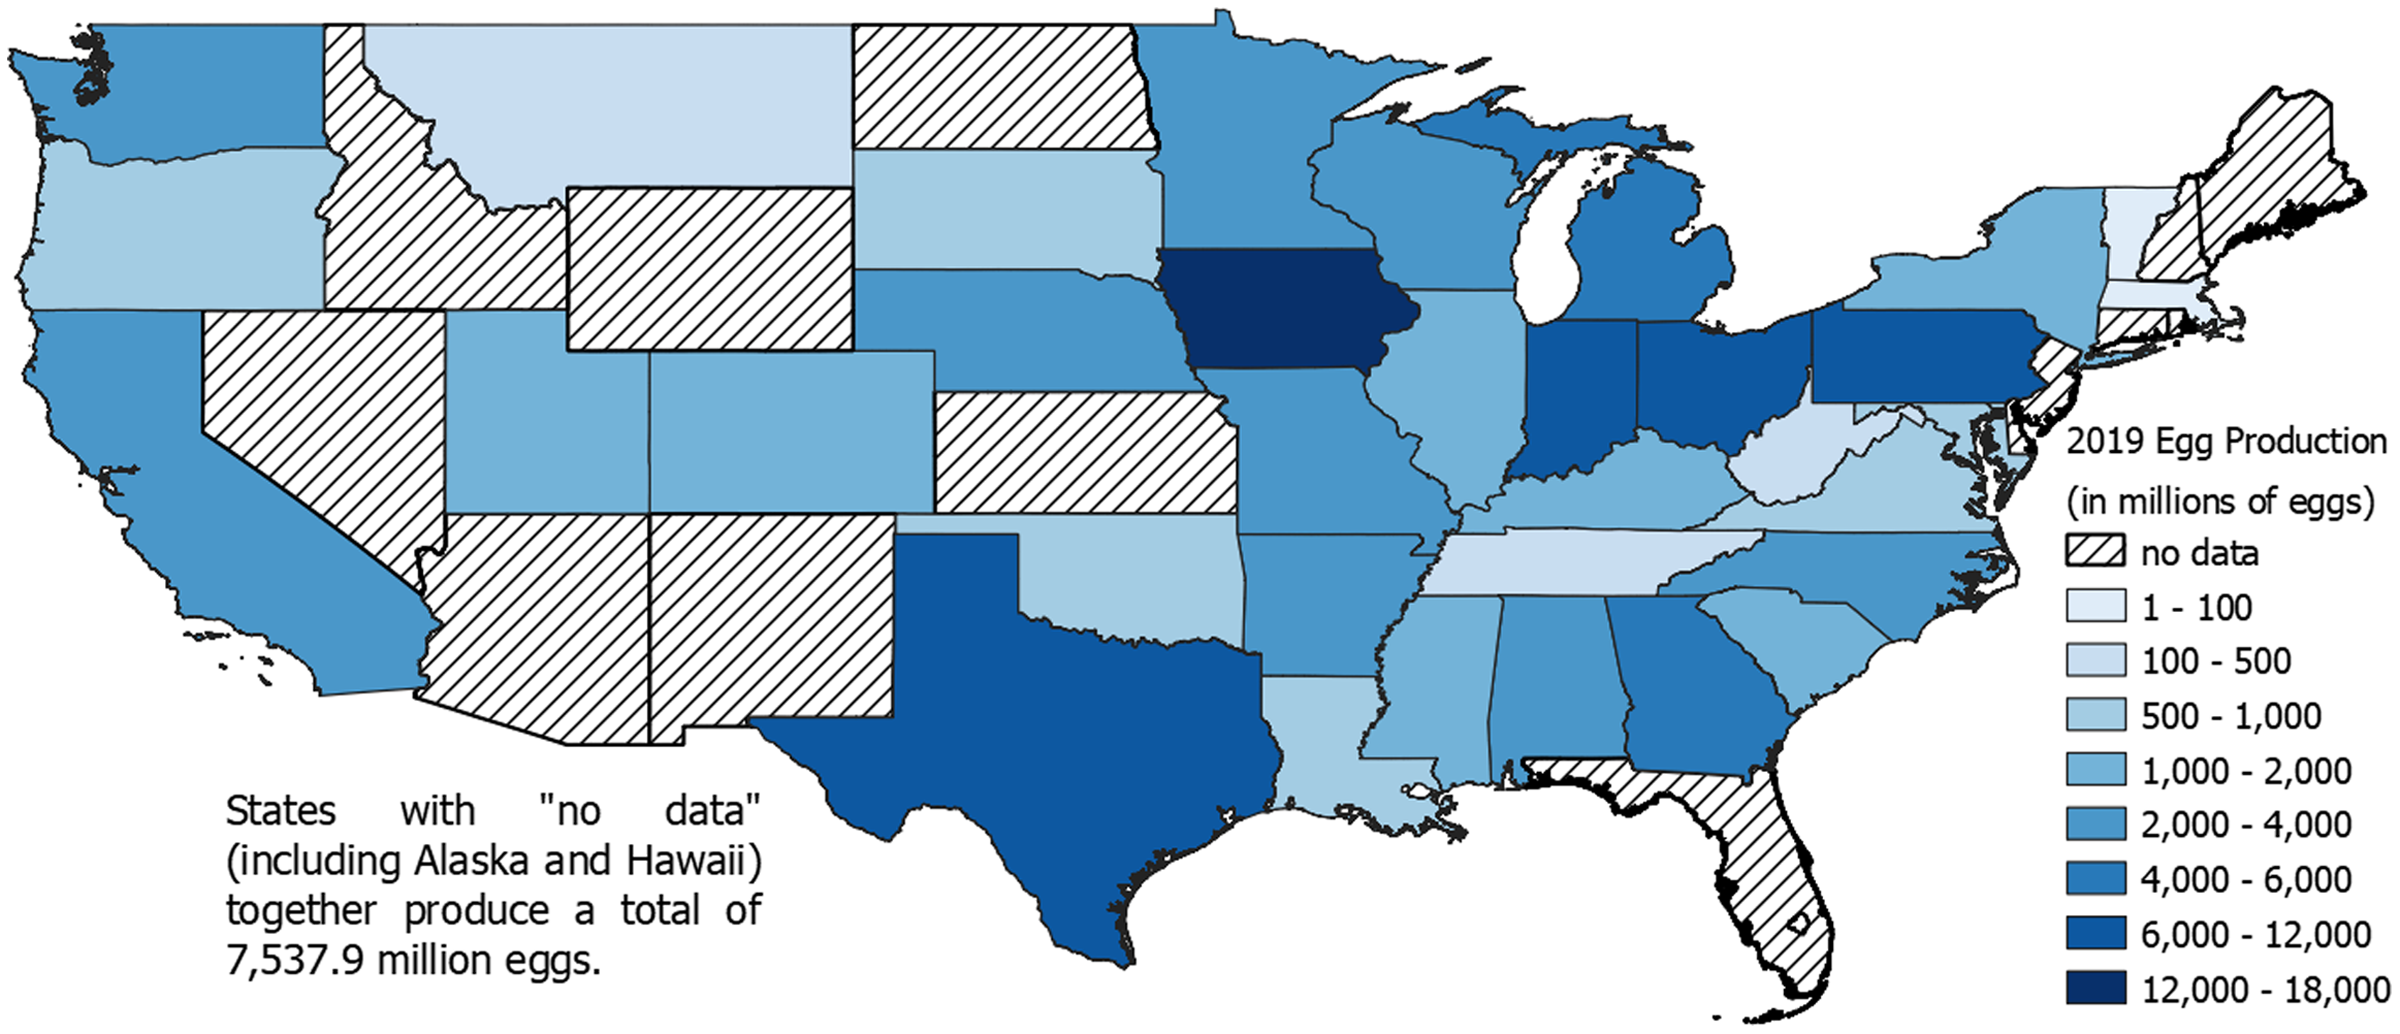
Figure 2. Egg production by state (in millions of eggs).
Source: Authors’ depiction using U.S. Department of Agriculture National Agricultural Statistics Service (2019) data.
Labor-dependent industries, including certain fruits and vegetables and animal agriculture, are exploring ways to substitute technology for manual labor. However, because egg production is already highly automated, new technology to further substitute for manual labor is not a realistic possibility soon. This research looks specifically at Iowa which is the nation’s leading egg producer with a minimum wage of $7.25 in 2022. Hence, to the extent that it exists, the impact of a minimum wage increase is likely to be seen in a state with a large egg industry and a low minimum wage. Iowa producers benefit from a relatively low minimum wage compared to the total costs of producers in other states. However, an increase in Iowa’s minimum wage could erode this advantage.
1.2. The U.S. Egg Industry
The egg industry saw its lowest per capita egg consumption in 1995 at 232 eggs, but it has since trended upward to 292 eggs per person in 2019 (USDA ERS, 2021). The industry’s production system remains largely unchanged since the modern production system emerged in the 1950s. The first step in egg production is the breeding stage which employs the use of specialized genetics and produces fertilized eggs for the hatcheries. At the hatchery, the eggs are incubated and hatched. For most of the industry, the breeding and the hatchery stages are owned and carried out by the same companies that are independent from the egg producers. These companies then sell the female chicks to egg producers.
1.2.1. Egg Production Costs
Although egg production costs are not widely published, Bell (Reference Bell and Bell2002) and Ibarburu, Plastina and Vold (Reference Ibarburu, Plastina and Vold2019) show that current input expenditure proportions have changed little over time. In the U.S. egg industry, labor is the third-highest variable cost of egg production, behind feed and pullets, and it is present in all stages of the value chain. From a manager’s perspective, pullets are a fixed cost for any given production cycle. Specifically, in contract-type operations, genetics providers often have a fixed price linked to output prices. Manager’s control production operations and manage production risk. Thus, labor represents a relatively large share of variable costs. Workers’ tasks include as follows: feeding, watering, and vaccinating birds; collecting eggs; removing waste, carcasses, and spent hens; monitoring; cleaning and maintaining equipment; transporting chicks, pullets, hens, and eggs; and washing, grading, and packaging. Automation, such as using front-end loaders to collect poultry litter instead of humans using pitchforks, has helped reduce overall labor costs, but the need for human workers still exists. Different jobs at a facility require different levels of skills, and as a result, varying wages.
1.3. Study Area
Iowa is the leading egg-producing state in the United States (USDA NASS, 2020). The state’s abundance of corn and soybean meal inputs are ideal for egg production, as feed makes up about 50% of total production costs (Ibarburu, Schulz and Imerman, Reference Ibarburu, Schulz and Imerman2019). This gives Iowa a competitive advantage over other states. On the other hand, Iowa lacks proximity to major population centers and therefore incurs higher transportation costs to bring eggs to market. As a result, Iowa processes or “breaks” a higher percentage—70% total—of eggs into frozen or liquid form than producers in states closer to large population centers. Processed eggs are less costly to transport than are table eggs. In 2018, the Iowa egg industry included 2,398 direct jobs and 7,084 total jobs with $450 million for egg worker salaries and an average salary rising to $45,967 per worker from $37,259 in 2014 (Ibarburu, Schulz and Imerman, Reference Ibarburu, Schulz and Imerman2019). This paper focuses solely on the direct jobs at Iowa’s laying facilities.
Comprehensive data on entry-level egg industry wages are not publicly available. The U.S. Bureau of Labor Statistics (BLS) does publish a Quarterly Census of Employment and Wages, which provides average weekly wages for the egg industry in many U.S. counties. Unfortunately, the data are aggregated in a way that prevents one from accurately extrapolating hourly wages for egg facility laborers. Another data source is online job postings. In March 2020, of the nearly 60 Iowa egg industry entry-level listings on www.indeed.com, 7 had stated an hourly wage. The average wage of those seven listings was $13.50 an hour with benefits.
The Iowa egg industry serves as a great case study on the issue of rural labor. Previous authors have written about poverty in the rural United States, noting how labor-saving farm technologies have greatly lessened the demand for local farm labor (Gardner, Reference Gardner2000; Monchuk et al., 2007). A result of this is a declining rural population in some areas such as the Great Plains and upper Midwest. Egg industry employers face a disadvantage in relation to the employers of similarly skilled positions in more-urban areas. Generally, entry-level egg industry jobs are less desirable than alternative entry-level positions, such as those in retail, restaurant, hospitality, and foodservice that may be less labor-intensive and located in urban areas with more amenities. Consequently, the egg industry competes by offering higher wages. In the event of a minimum wage increase, egg industry employers would need to maintain these compensation advantages to keep enough workers at their facilities.
To put this into perspective, one alternative to working at an egg facility would be the foodservice industry. The BLS statistics for the mean hourly wage for the “Food Preparation and Serving Related” category in Des Moines, Iowa, in May 2018 was $11.82 (U.S. Bureau of Labor Statistics, 2018). The wages for egg industry positions are set significantly higher than food preparation jobs in Des Moines to attract and maintain a large enough workforce. With a current minimum wage in Iowa of $7.25, the foodservice workers in Des Moines earn 63% above the minimum wage. Egg workers make 86% above the minimum wage and 14% more than foodservice workers. Keeping wages above those of competitors is a necessity in the egg industry to draw workers into rural Iowa, which historically attracts fewer workers compared to more urban environments.
2. Model
We use an EDM to analyze the effects of an increase in the minimum wage on Iowa’s egg industry. What separates EDMs from a simple budget analysis is their ability to consider entire systems and their equilibrium effects, which was first noted by Muth (Reference Muth1965). The EDM models have been frequently used to analyze the impacts of policy. For example, Gardner (Reference Gardner1975) uses a six-equation system to derive reduced-form equations. The exogenous shifters within these reduced-form equations are then used to examine their effects on retail/farm price ratios.
The EDMs are valued for their flexibility, as they can address both supply and demand phenomena. From the modeler’s perspective, an EDM is computationally convenient as the framework includes linear approximations of the underlying true demand and supply functions. However, the downside is that if the true underlying functional forms are highly nonlinear, then the EDM will produce distorted results. Note that EDM’s are a subset of partial equilibrium models which may have one or more nonlinear functional forms. Another benefit of using an EDM is the ability to forgo the data collection and estimation needed to obtain supply and demand elasticities. That is, elasticities can be taken from existing literature on the topic. These advantages make EDMs popular throughout agricultural economics. For example, a search in AgEcon Search, the world’s largest depository for published research on agricultural economics, of “equilibrium displacement model” in May 2020 returned 118 papers using this type of model. A similar search in Journal Storage (JSTOR), the world’s largest depository for published academic journals for humanities and social science journals, found 42 agricultural applications of EDM’s with 13 appearing in the Journal of Agricultural and Resource Economics and 26 in the current and legacy journals of the Agricultural and Applied Economics Association.
Considering the egg industry, an arbitrary shock to labor costs at each level in the vertical chain’s supply cause an increase in egg price and a decrease in quantity. For example, egg farmers and wholesale purchasers of table or processed eggs incur added labor costs due to increased wages from the new minimum wage. Consequently, the retailer must now purchase eggs from the wholesaler at a higher cost. The retailer may respond by transmitting part of the increased costs onto consumers, which will cause the quantity demanded to fall. In turn, the wholesaler experiences an endogenous decrease in the derived demand for eggs. This equilibrium analysis is based on a shift in the supply curve, as opposed to a wedge in prices and quantities, which usually occurs from government intervention, often from the implementation of a price floor or a price ceiling, as shown by Just, Hueth and Schmitz (Reference Just, Hueth and Schmitz2004). Wedges in labor quantities and prices, for example, can be caused by the implementation of a minimum wage—a type of price floor.
Many previous EDMs begin with the consideration of only the relevant supply and demand equations. From there, parameters are chosen, and the system of supply and demand equations are solved. Our EDM model omits a horizontal component and does not look at interindustry interactions due to lack of close substitutes.Footnote 4
Figure 3 illustrates the effects of a minimum wage on a labor market equilibrium. The equilibrium wage increases from w m 0 to the legal minimum, w m ′. The minimum wage creates a wedge, ψ, between the quantity of labor demanded, x′ D , and the quantity of labor supplied, x′ S . Because employers will hire no more labor than is necessary, x′ S is irrelevant, and x′ D becomes the new labor quantity.
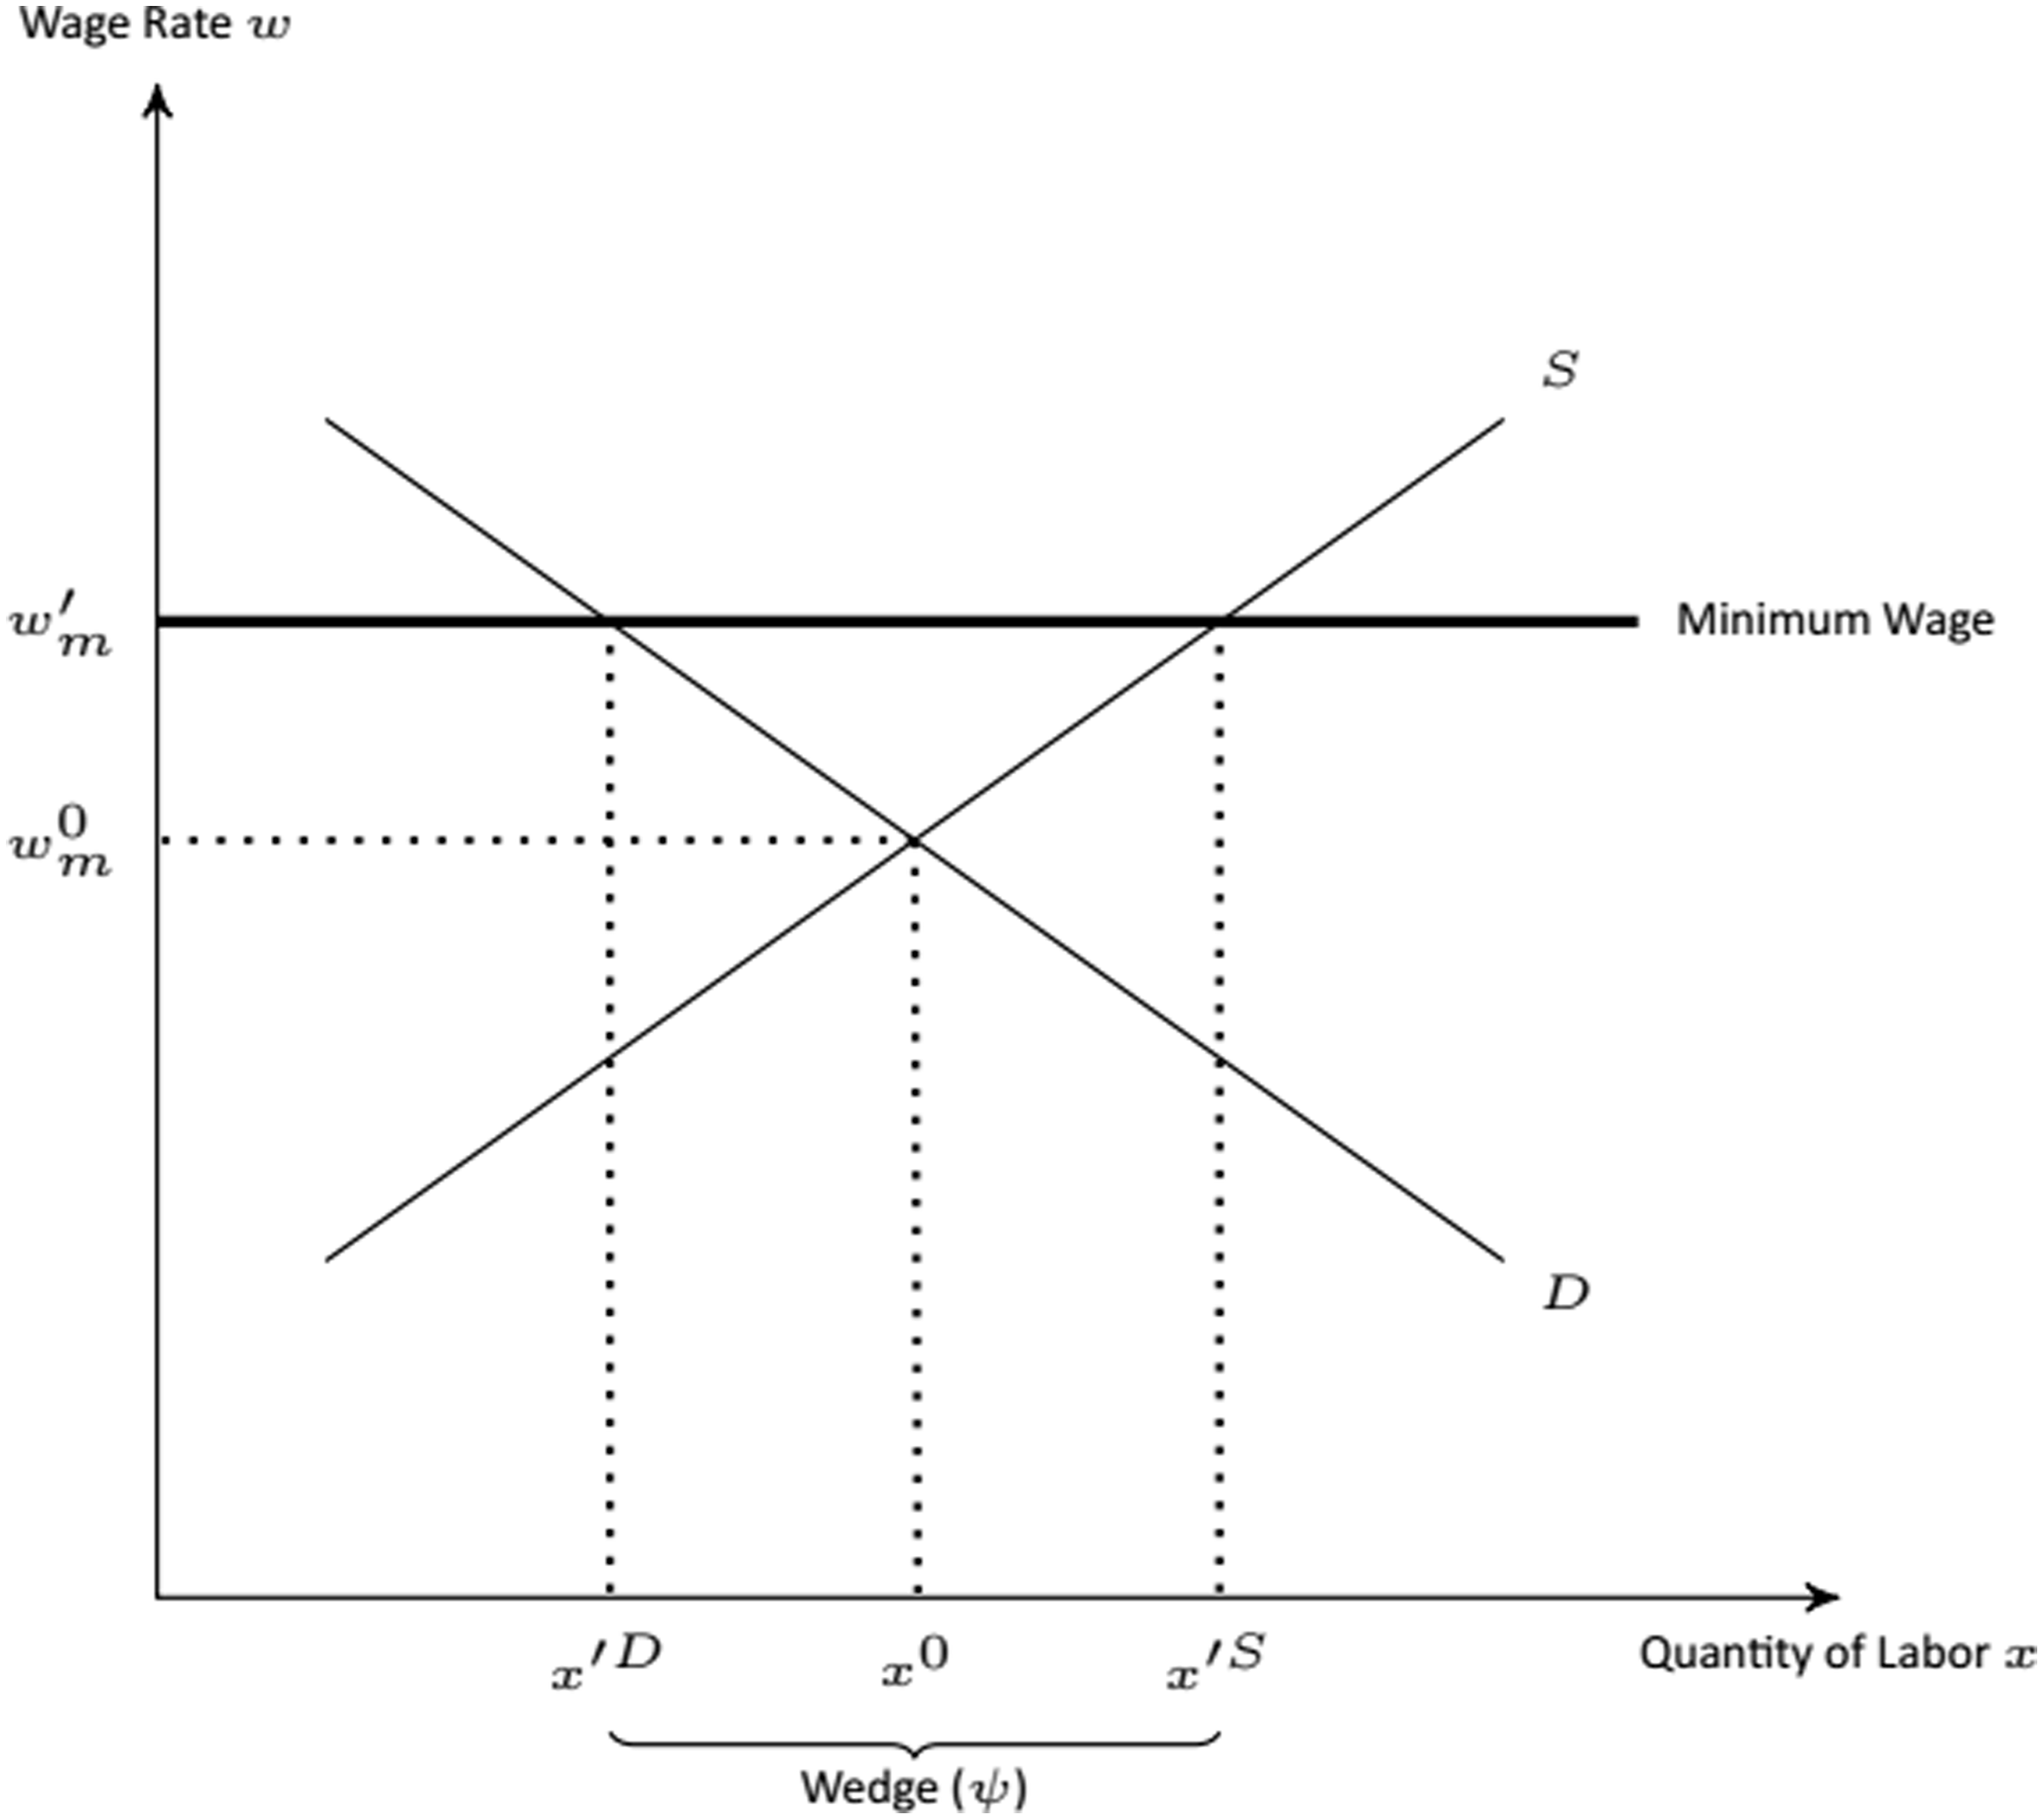
Figure 3. The effects of a new minimum wage with labor as a homogeneous input.
As shown earlier, Iowa’s egg industry must offer higher wages to stay competitive with more desirable, similarly skilled jobs such as those in the foodservice industry. This premium in wages adds a complication compared to the generic minimum wage analysis as shown in Figure 3. Figure 4 depicts the equilibrium outcomes in Iowa’s egg industry after a minimum wage increase. The initial equilibrium, E 0, in Iowa’s egg market is determined by the labor supply curve, S e , and the demand curve, D e , resulting in wages, w 0, and labor quantity, x 0. Note that, in line with the egg industry’s observed wages, the current minimum wage, w m 0, is nonbinding. An increase in the minimum wage can result in two different scenarios. In the first scenario, the demand and supply curves are not affected, and the new equilibrium, E 1, occurs at the new minimum wage, w m ′, and labor quantity, x′ D .Footnote 5 This is a binding outcome similar to that shown in Figure 3.
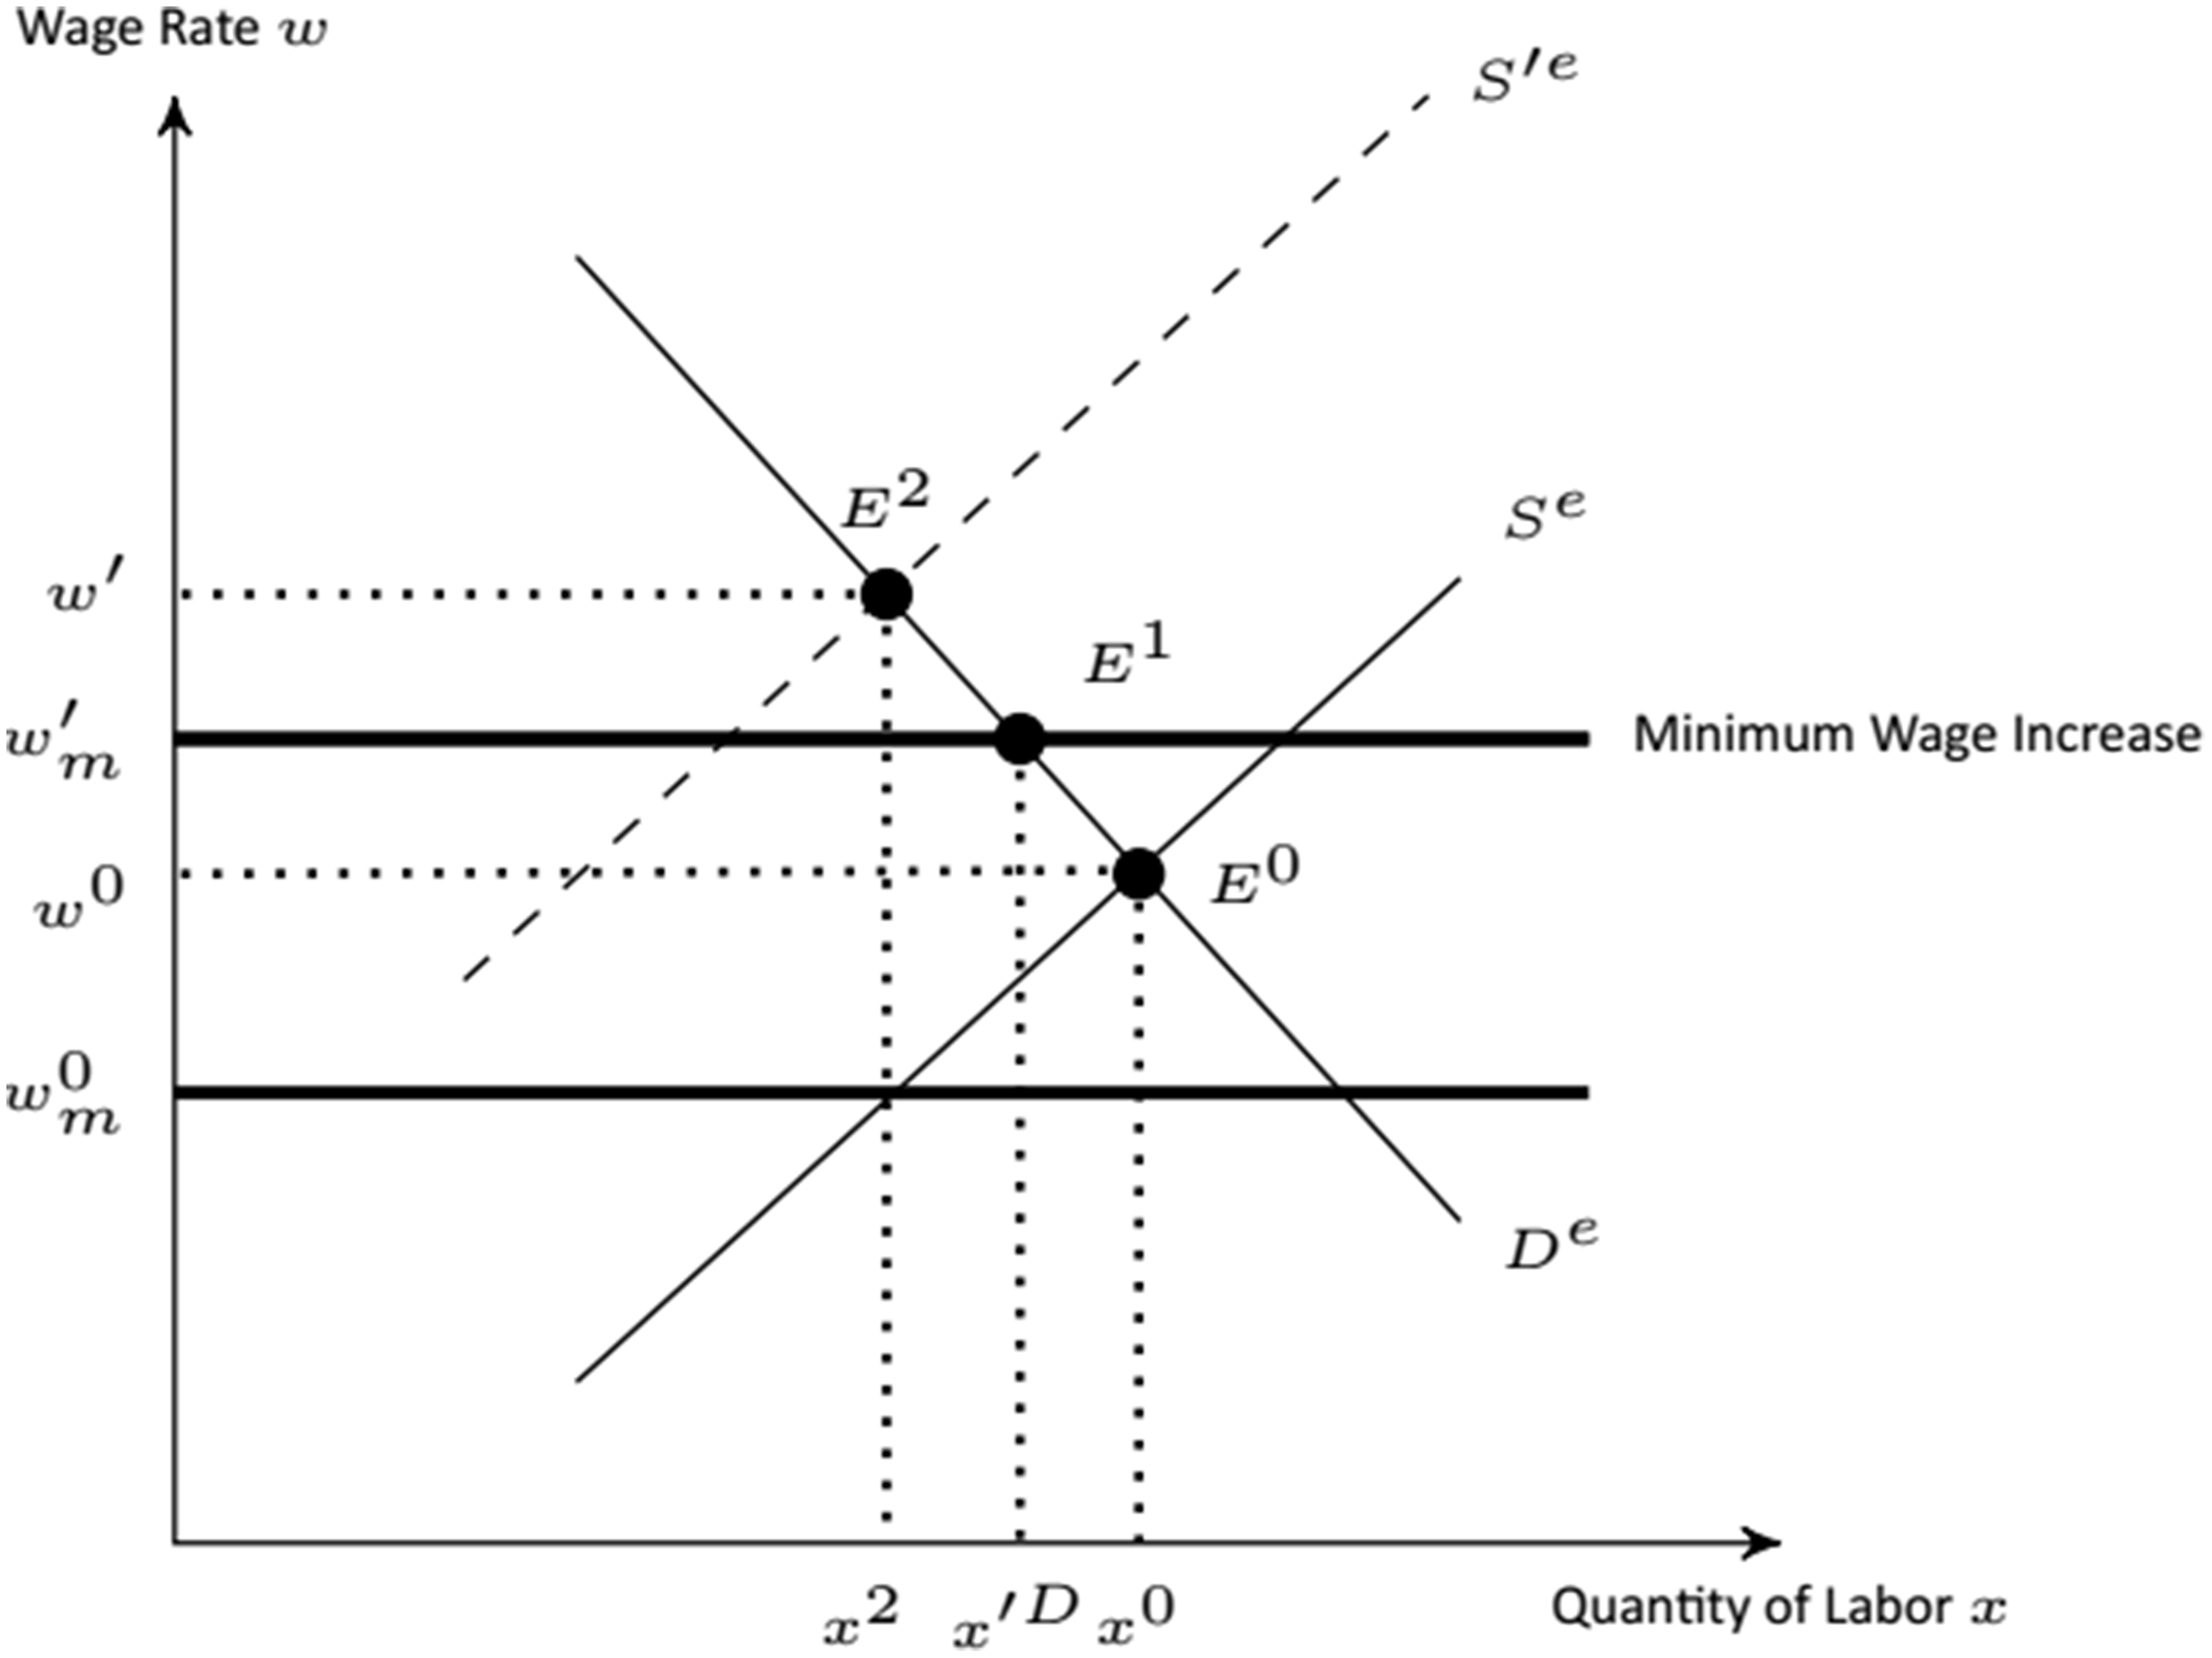
Figure 4. The effects of a new minimum wage on the Iowa egg industry modeled in the EDM.
In the second scenario, the egg industry’s labor supply curve shifts left due to a change in worker preferences such that the new equilibrium, E 2, is determined by the labor demand and the new labor supply curve, S ′e . Note that E 2 is a nonbinding equilibrium similar to the initial equilibrium of the industry. The primary reason for a potential change in worker preferences is that the new minimum wage reduces or even eliminates the wage premium paid by the egg industry, making the non-egg industry positions relatively more attractive. This is analogous to an employee’s change in tastes and preferences for certain types of work that might require less manual labor or being housed in certain types of living conditions if a premium for doing so erodes. In the next section, we model both scenarios and analyze binding and nonbinding outcomes separately.Footnote 6
2.1. The Model for Minimum Wage Increases
Iowa’s egg production begins with egg breeders, and much of it ends with Iowa restaurants, institutions, and grocery stores. Because labor is a primary input in each of these sectors, an increase in Iowa’s minimum wage is felt at all stages of the vertical supply chain. This EDM model is a single-stage model and looks only at Iowa egg producers as opposed to breeders and retailers. Nonetheless, it incorporates the labor shock effects of the upstream firms. These effects are realized by the egg producer once the breeder raises its chick prices due to an increase in its labor costs. Because input prices in this model are smaller than the direct cost of labor shock due to a higher minimum wage, we apply a shock that is 10% of the direct labor cost increase to procuring hens after a new minimum wage. This is a conservative estimate as a 10% increase from the current rate of $7.25 is $0.73 and egg labor wages are higher in Iowa. But it is likely that any new legislation would increase over several years and a 10% estimate is likely to be politically defensible in the first year.
Labor is also used in the production of hens. Hence, besides the direct effect on labor cost in egg production, a higher minimum wage might also have an indirect effect through the increased cost of hens. After examining farm budgets and discussing with industry experts, we conjecture that a 10% increase in the minimum wage might raise cost of hens in egg production by about 1%. In other words, if the shock to the cost of labor is calculated to be 10%, then we shock the cost of hens by 1%.
Using the Atwood and Brester (2020) and Hamilton et al. (Reference Hamilton, McCullough, Brester and Atwood2020)’s approach, based on the assumption of a linearly homogeneous production function, a generic, one-output, one-input model is represented by the following equations:
 $$E\left(q\right)=\eta E\left(p\right)+E\left(\theta _{a}\right)$$
 $$E\left(p\right)=\kappa _{1}E\left(w_{1}\right)+E\left(\theta _{b}\right)$$
 $$E\left(x_{1}\right)=E\left(q\right)+\kappa _{1}\sigma _{11}E\left(w_{1}\right)+E\left(\theta _{c}\right)$$
 $$E\left(x_{1}\right)=\varepsilon _{1}E\left(w_{1}\right)+E\left(\theta _{d}\right)$$
Note that the four E(⋅) represents percentage changes in its respective parameter. Equation (1) characterizes retail-level demand where p is output price and q is output quantity. Equation (2) is the firm’s homogeneous of degree one production function, with κ representing the factor shares while equation (3) is the profit maximization problem’s optimum conditions, where σ is the elasticity of substitution. Furthermore, η is the elasticity of demand and ε i is the elasticity of supply. Finally, equation (4) is the firm’s input supply function, where w is the input price. Exogenous shocks as percentage changes can be operationalized via each equation’s respective θ term, noting that the subscripts of a through d are simply for identification purposes. In the following section, we build upon this generic model to apply to Iowa’s egg industry. We examine two potential scenarios. In the first scenario, a nonbinding minimum-wage equilibrium occurs in the industry after a minimum-wage increase, whereas, in the second scenario the new minimum wage is binding for the industry.
2.2. The EDM of the Iowa Egg industry under Alternative Scenarios
Equations (5) through (21) are used to construct a two-output, and three-input—hens, labor, and all other inputs—model to represent the Iowa egg industry. The two outputs in this model follow Thompson et al. (Reference Thompson, Pendell, Boyer, Patyk, Malladi and Weaver2019) who were the first to separate eggs into table eggs (T) and processed eggs (P). Our model is as follows:
 $$ E\left(q_{T}\right)-\eta _{T}E\left(p_{T}\right)=E\left(\theta _{1}\right)$$
 $$E\left(q_{p}\right)-\eta _{P}E\left(p_{p}\right)=E\left(\theta _{2}\right)$$
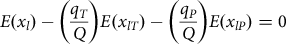
 $$E\left(Q\right)-\left(q_{T} \over Q\right)E\left(q_{T}\right)-\left(q_{P} \over Q\right)E\left(q_{p}\right)=0$$
 $$E\left(x_{h}\right)-\varepsilon _{h}E\left(w_{h}\right)=E\left(\theta _{3}\right)$$
 $$E\left(x_{l}\right)-\varepsilon _{l}E\left(w_{l}\right)=E\left(\theta _{4}\right)$$
 $$E\left(x_{o}\right)-\varepsilon _{o}E\left(w_{o}\right)=E\left(\theta _{5}\right)$$
 $$E\left(x_{hT}\right)-E\left(Q\right)-\kappa _{hT}\sigma _{hh}E\left(w_{h}\right)-\kappa _{lT}\sigma _{hl}E\left(w_{l}\right)-\kappa _{oT}\sigma _{ho}E\left(w_{o}\right)=E\left(\theta _{6}\right)$$
 $$E\left(x_{lT}\right)-E\left(Q\right)-\kappa _{hT}\sigma _{lh}E\left(w_{h}\right)-\kappa _{lT}\sigma _{ll}E\left(w_{l}\right)-\kappa _{oT}\sigma _{lo}E\left(w_{o}\right)=E\left(\theta _{7}\right)$$
 $$E\left(x_{oT}\right)-E\left(Q\right)-\kappa _{hT}\sigma _{oh}E\left(w_{h}\right)-\kappa _{lT}\sigma _{ol}E\left(w_{l}\right)-\kappa _{oT}\sigma _{oo}E\left(w_{o}\right)=E\left(\theta _{8}\right)$$
 $$E\left(x_{hP}\right)-E\left(Q\right)-\kappa _{hP}\sigma _{oh}E\left(w_{h}\right)-\kappa _{lP}\sigma _{hl}E\left(w_{l}\right)-\kappa _{oP}\sigma _{ho}E\left(w_{o}\right)=E\left(\theta _{9}\right)$$
 $$E\left(x_{lP}\right)-E\left(Q\right)-\kappa _{hP}\sigma _{lh}E\left(w_{h}\right)-\kappa _{lP}\sigma _{ll}E\left(w_{l}\right)-\kappa _{oP}\sigma _{lo}E\left(w_{o}\right)=E\left(\theta _{10}\right)$$
 $$E\left(x_{oP}\right)-E\left(Q\right)-\kappa _{hP}\sigma _{oh}E\left(w_{h}\right)-\kappa _{lP}\sigma _{ol}E\left(w_{l}\right)-\kappa _{oP}\sigma _{oo}E\left(w_{o}\right)=E\left(\theta _{11}\right)$$
 $$E\left(x_{h}\right)-\left(q_{T} \over Q\right)E\left(x_{hT}\right)-\left(q_{P} \over Q\right)E\left(x_{hP}\right)=0$$
 $$E\left(x_{l}\right)-\left(q_{T} \over Q\right)E\left(x_{lT}\right)-\left(q_{P} \over Q\right)E\left(x_{lP}\right)=0$$
 $$E\left(x_{o}\right)-\left(q_{T} \over Q\right)E\left(x_{oT}\right)-\left(q_{P} \over Q\right)E\left(x_{oP}\right)=0$$
 $$E\left(p_{T}\right)-\kappa _{hT}E\left(w_{h}\right)-\kappa _{lT}E\left(w_{l}\right)-\kappa _{oT}E\left(w_{o}\right)=E\left(\theta _{12}\right)$$
 $$E\left(p_{P}\right)-\kappa _{hP}E\left(w_{h}\right)-\kappa _{lP}E\left(w_{l}\right)-\kappa _{oP}E\left(w_{o}\right)=E\left(\theta _{13}\right)$$
These equations provide the basis for analysis involving shifts in labor costs for egg producers. That is, these equations make up the model that examines nonbinding minimum wage increases as well as any other labor supply-shifting events. The subscripts T and P represent table eggs and processed eggs respectively. Equations (5) and (6) represent the wholesale demand for table eggs and processed eggs facing the Iowa egg sector, respectively.Footnote 7 Equation (7) represents the sum of Iowa’s table eggs and processed eggs. Equations (8) to (10) represent the input supply functions. The inputs are represented by the subscripts h, l, and o: h is the cost of procuring and maintaining the hens; l is the cost of labor; and o is all other costs (e.g., energy, cleaning supplies, etc.). The corresponding first-order conditions for each input are given in equations (11) through (13) for table eggs and in equations (14) through (16) for processed eggs. Like equation (7), equations (17) through (19) simply aggregate the input quantities used for table eggs and processed eggs. The final two equations, (20) and (21), represent the egg producers’ production function for table eggs and processed eggs, respectively.
We now turn to our binding model which depicts the scenario if the industry equilibrium occurs at the new minimum wage. For convenience, we describe how the nonbinding model, equations (5) to (21), is modified to obtain the binding model, instead presenting a full set of new equations. The main aspects of the binding model are that the new minimum wage creates a wedge between the quantity of labor demanded and the quantity of labor supplied, and that the labor wage is exogeneous. We incorporate the wedge, ψ, and the exogenous labor wage by adding the following two equations:
 $$E\left(x_{l}^{S}\right)-E\left(x_{l}^{D}\right)-E\left(\psi \right)=0$$
 $$E\left(w_{l}\right)=E\left(\theta _{14}\right)$$
Equation (22) manifests the difference between the quantity of labor supplied and the quantity of labor demanded. Equation (23) sets the percentage change in labor wage equal to the exogenous factor, θ 14. Note that we introduced the S and D superscripts in equation (22) to differentiate between the quantities of labor supplied and demanded, respectively. For simplicity, these superscripts were omitted from equations (5) through (21) when describing the nonbinding model. Equation (9), the input supply function for labor, for example, can be rewritten to include the superscript, S, when considering the binding model:
 $$E\left(x_{l}^{S}\right)-\varepsilon _{l}E\left(w_{l}\right)=E\left(\theta _{4}\right).$$
Similarly, Equations (12), (15), and (18) can be rewritten by including the D superscript:
 $$E\left(x_{lT}^{D}\right)-E\left(Q\right)-\kappa _{hT}\sigma _{lh}E\left(w_{h}\right)-\kappa _{lT}\sigma _{ll}E\left(w_{l}\right)-\kappa _{oT}\sigma _{lo}E\left(w_{o}\right)=E\left(\theta _{7}\right)$$
 $$E\left(x_{lP}^{D}\right)-E\left(Q\right)-\kappa _{hP}\sigma _{lh}E\left(w_{h}\right)-\kappa _{lP}\sigma _{ll}E\left(w_{l}\right)-\kappa _{oP}\sigma _{lo}E\left(w_{o}\right)=E\left(\theta _{10}\right)$$
 $$E\left(x_{l}^{D}\right)-\left(q_{T} \over Q\right)E\left(x_{lT}^{D}\right)-\left(q_{P} \over Q\right)E\left(x_{lP}^{D}\right)=0$$
With these changes, the binding model is fully specified by equations (5)–(23) with equations (9), (12), and (15) replaced by (9a), (12a), and (15a).Footnote 8
The variables used in the EDM model using a primal approach are as follows: Q is the total wholesale quantity of eggs; p
T
and p
P
are the wholesale prices of table eggs and processed eggs, respectively; x
i
is the quantity of each input; and w
i
is the cost of each input (i = hens, labor, other costs). The behavioral parameters of the model include η
i
as the own-price elasticities of demand and ε
i
as the elasticities of supply. The factor shares are represented by $\kappa _{i}=\left(w_{i}x_{i} \over wx\right)$
. Given the structure of the industry and the added steps required in producing processed eggs, the factor shares for table eggs are different than those for table eggs. This model incorporates verticality through its shocks. Note that despite the slightly different makeups of the nonbinding and binding models, the approach for solving the system is identical.
$\kappa _{i}=\left(w_{i}x_{i} \over wx\right)$
. Given the structure of the industry and the added steps required in producing processed eggs, the factor shares for table eggs are different than those for table eggs. This model incorporates verticality through its shocks. Note that despite the slightly different makeups of the nonbinding and binding models, the approach for solving the system is identical.
Equations (5) to (21), using (9a), (12a), and (15a), can be represented as a matrix equation, A ⋅ Y = X, where A is a 19 × 19 matrix of parameters, Y is a 19 × 1 vector of changes in the endogenous variables, and X is a 19 × 1 vector of exogenous shocks. Equation (23) equates the change in wage, w 2, with the exogenous shock variable, θ 14, which is the appropriate vehicle to implement the wage shock. This contrasts with the nonbinding model where the θ 4 of (9) is the appropriate labor shock parameter, and θ 14 does not exist. The result of this process is a Y vector that provides the percentage changes for each respective endogenous variable. To estimate the impact of a new minimum wage on the egg industry, a shock must be applied to the appropriate parameter.
2.3. Data and Model Parameters
Table 1 summarizes the parameters used in our EDM model with the far-right column describing the source of the data. Because public egg data is limited, elasticities are informed by the literature, and a sensitivity analysis is conducted within the results of tables in which the results are run multiple times with alternative values for our assumed parameters.Footnote 9 The own-price elasticity of demand is calculated using a weighted average of figures found in the literature. The supply elasticities show the relationships between the quantity of inputs supplied and their respective prices. One would expect the elasticity of hen supply, ε h , to be relatively inelastic as hens have the largest cost share in egg production. The elasticity of labor supply is also quite inelastic, as many functions cannot be automated. Miscellaneous costs would be the least inelastic of the three-input supply elasticities. The factor shares for Iowa’s entire egg industry are κ h = 0.69, κ l = 0.08, and κ o = 0.23, which are taken directly from Ibarburu, Schulz and Imerman (Reference Ibarburu, Schulz and Imerman2019) budget of the Iowa egg industry.
Table 1. Model parameters, definitions, and sources
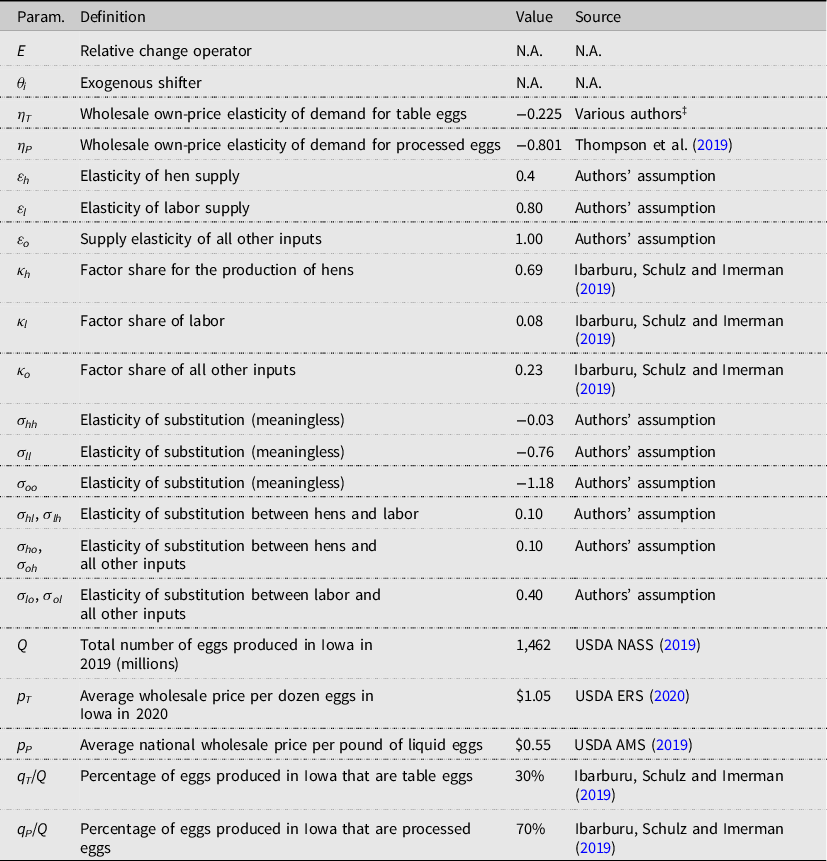
‡This figure is the mean of the literature’s figures for the retail table egg elasticity of demand. The estimates used to calculate the table egg elasticities are from Andreyeva et al. (Reference Andreyeva, Long and Brownell2010), Okrent and Alston (Reference Okrent and Alston2012), and Thompson et al. (Reference Thompson, Pendell, Boyer, Patyk, Malladi and Weaver2019). The table egg elasticities of demand range from −0.08 to −0.73.
The Allen Elasticity of Substitution (AES) is a measure of the substitutability between inputs. The first of these, σ
hl
= σ
lh
, that is, the elasticity of substitution between hens and labor is assumed to be relatively low at 0.1.Footnote
10
Similarly, the substitutability between hens and other costs is also assumed to be low: σ
ho
= σ
oh
= 0.1. The AES between labor and all other costs is higher since there is likely to be greater substitutability in labor with σ
lo
= σ
ol
= 0.4. Finally, note that σ
hh
, σ
ll
, and σ
oo
do not have a meaningful interpretation in that an input cannot be a substitute to itself. However, to keep the production technology homogeneous of degree zero in prices, these elasticities are calculated as follows: $\sigma _{hh}=\left(\kappa _{l}*\sigma _{hl}\right)+\left(\kappa _{o}*\sigma _{h0}\right) \over \kappa _{h}$
,
$\sigma _{hh}=\left(\kappa _{l}*\sigma _{hl}\right)+\left(\kappa _{o}*\sigma _{h0}\right) \over \kappa _{h}$
, $\sigma _{ll}=\left(\kappa _{h}*\sigma _{lh}\right)+\left(\kappa _{o}*\sigma _{lo}\right) \over \kappa _{l}$
, and
$\sigma _{ll}=\left(\kappa _{h}*\sigma _{lh}\right)+\left(\kappa _{o}*\sigma _{lo}\right) \over \kappa _{l}$
, and $\sigma _{oo}=\left(\kappa _{h}*\sigma _{oh}\right)+\left(\kappa _{l}*\sigma _{lo}\right) \over \kappa _{o}$
. The relative rankings of the elasticities are based on factor shares in the Ibarburu, Schulz and Imerman (Reference Ibarburu, Schulz and Imerman2019) budget.
$\sigma _{oo}=\left(\kappa _{h}*\sigma _{oh}\right)+\left(\kappa _{l}*\sigma _{lo}\right) \over \kappa _{o}$
. The relative rankings of the elasticities are based on factor shares in the Ibarburu, Schulz and Imerman (Reference Ibarburu, Schulz and Imerman2019) budget.
While the data for calculating these more-specific factor shares are unavailable, one can be certain of the general direction that these numbers must be adjusted. Specifically, processed eggs require extra labor and extra inputs to carry out the additional required processes. As a result, the factor shares for processed eggs have a relatively smaller share for hens and larger shares for both labor and other costs. The converse is true for the factor shares of table eggs. In order to get a more accurate representation of the industry, we make these adjustments while preserving a weighted average of factor shares that equals the industry-level factor shares as calculated by Ibarburu, Schulz and Imerman (Reference Ibarburu, Schulz and Imerman2019). For table eggs, κ hT = 0.7367, κ lT = 0.0567, and κ oT = 0.2067 are used. For processed eggs, the assumed factor shares are κ hP = 0.6700, κ lP = 0.0900, and κ oP = 0.2400. The results also provide two alternative sets of factor shares to provide a measure of sensitivity for these figures.
3. Results
As expected, the EDM model shows that increasing labor costs cause egg quantities to fall and prices to rise. In the long run, egg producers can adjust to increasing labor costs through several means, such as scaling their operations up or down, recalibrating their processes to be less dependent on labor, optimizing their allocations of investment given cost changes, or some combination of these options. In the short run, however, producers face a period of increased costs without the simultaneous benefit of increased output prices—especially producers under a production contract. Contract producers are likely to not see the resulting output price increases until the beginning of their next contracting period. Even producers who do not contract must undergo the time period it takes for demand and supply forces to increase the price of their outputs. Meanwhile, producers must immediately finance their workers’ pay increases. This immediate cost increase could result in budget shortfalls and potential closures of facilities. Of course, these shortfalls may be cushioned if a new minimum wage is introduced incrementally.
3.1. Scenario 1: Results of a Binding Minimum Wage
In this scenario, Iowa raises its minimum wage to $15.00 an hour. If the minimum wage is binding, that means the resulting inward supply shift is not large enough to bring the equilibrium wage above $15.00. The egg industry employers then must raise their wages further to at least $15.00 by law. Again, the significance of this being binding is that it drives a wedge between the quantities of labor demanded and supplied. To operationalize the wage of $15.00, note that $15.00 is an 11.11% increase from the assumed starting wage of $13.50. Consequently, the shocks are 0.1111 and 0.0111 for θ 14 and θ 3, the shock parameters for the cost of labor, and the cost of hens, respectively.
Table 2 shows that in a binding $15.00 minimum wage scenario, the decrease in the quantity of eggs produced in Iowa is about 146 million eggs—about an 0.86% reduction from Iowa’s 2019 total egg production quantity which can be seen in the fifth row and second column of Table 2. Processed eggs are affected more than table eggs owing to the relatively higher elasticity of demand. When η P , the wholesale elasticity of demand for processed eggs is reduced by 50% to −0.401 as shown in the first row and second column in Table 2, the reduction of processed eggs with respect to table eggs is significantly more equitable. Retailers can expect to pay the price per dozen that is just over one cent higher, which is just over 1% above the average price of $1.05 a dozen.
Table 2. Effects of a binding minimum wage of $15.00 and a 50% decrease and increase in select elasticities
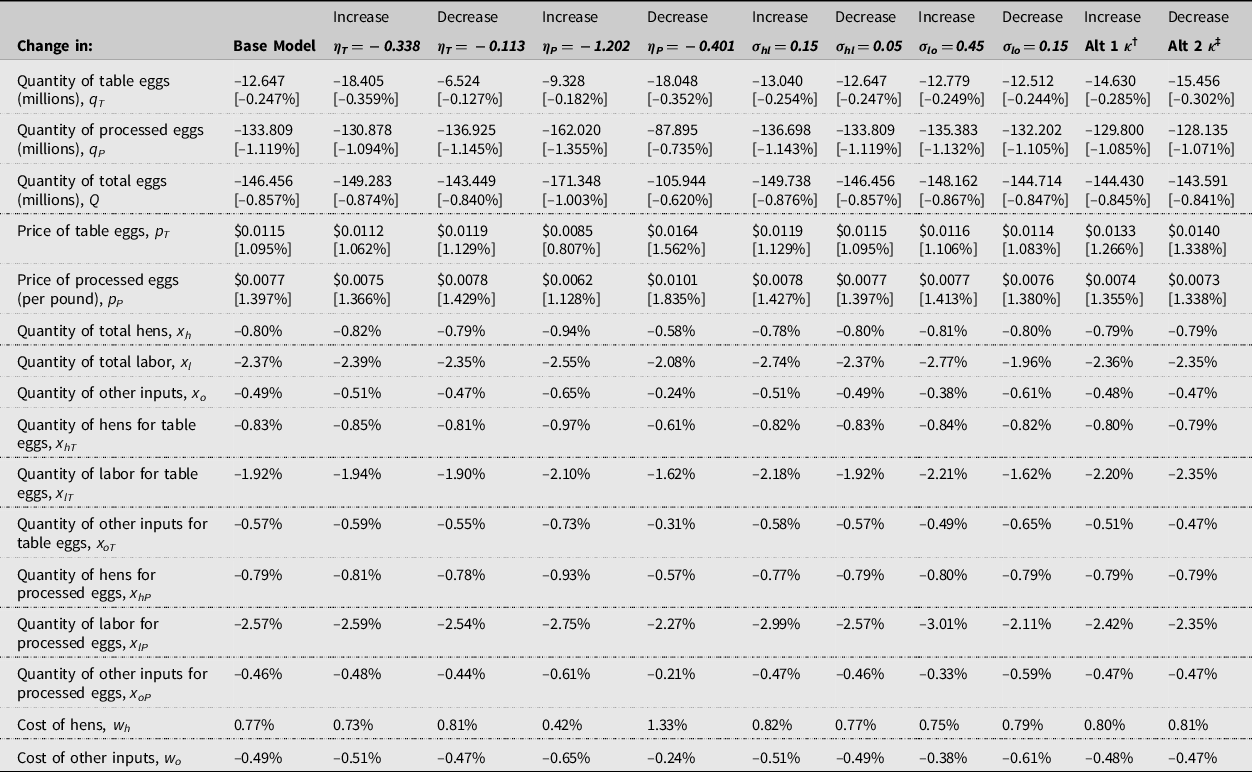
† Alternative κ′s are κ hT = 0.7133, κ lT = 0.7207, κ oT = 0.2146, κ hP = 0.6800, κ lP = 0.0834, and κ oP = 0.2366.
‡ Alternative κ’s are derived from Ibarburu et al.’s (Reference Ibarburu, Schulz and Imerman2019) figures as shown in Table 1 and do not differentiate between table and processed eggs.
The percentage increase for processed eggs is slightly higher at about 1.4% which can be seen in the fourth row and second column. As increasing the minimum wage raises egg production costs, the quantity of eggs produced falls. Consequently, the input quantities, x i , also decrease. Table 2 shows a decrease in the quantity of all inputs, with labor being the most significant at 2.37% in the ninth row and second column. Because the model shocked the costs of hens and labor, their total costs increase despite their decreased quantities. The cost of all other inputs, w o , decreases directly related to the decrease in the quantity used, x o .
For a sensitivity analysis, each of the elasticities of substitution with labor is tested first in accordance with Table 1 and then at a figure that is 50% greater and one that is 50% smaller than what is given in Table 1. In addition, two alternate sets of factor shares, referred to as alternative κ’s in the Table 2 and 3 footnotes, for table eggs and processed eggs are provided to inform the sensitivity of the assumed values used. Looking at the alternative parameters in the sensitivity analysis, the most significant of these is η P , the wholesale elasticity of demand for processed eggs. Changes to this parameter of 50% in either direction can affect the change in the number of eggs being taken out of production by up to 43% in comparison with the base model. This is simply a result of processed eggs making up 70% of Iowa’s total egg production. In contrast, similar changes to any other parameter cause much smaller deviations—none of which exceeds four million eggs.
3.2. Scenario 2: Results of a Nonbinding Minimum Wage
A minimum wage is nonbinding when the new minimum wage is below the new equilibrium wage, w′. Remember that this scenario exists because of a change in an egg worker’s preference for a job in a different industry as the price premium erodes. This is demonstrated in scenario 2. Because there exists no wedge between the labor supplied and demanded, this scenario can be modeled as simple shifts in the labor supply curve.
Unlike the binding minimum wage model, the nonbinding model’s results are in terms of the percentage of labor supply shifts and not a specific minimum wage. Table 3 shows that an 11.11% (nonbinding) negative shock to the labor supply curve causes a reduction of over 145 million eggs from production in Iowa—an 0.85% decrease. Similar to the binding model, wholesale table egg prices increase by about a cent, and processed egg prices per pound increase by about 1.39%. Despite the omission of the wedge equations, there are no significant deviations between the two models other than small differences in magnitudes—the two models are comparable. One should, however, consider the results of the nonbinding model as the minimum effects. Given that non-egg industry jobs appear to be more attractive when wages and benefits are equal, it is likely that the egg industry would have to increase its wages even higher above a binding $15 minimum wage.
Table 3. Effects of a 11.11% negative shock to the Iowa egg industry labor supply curve and a 50% decrease and increase in select elasticities
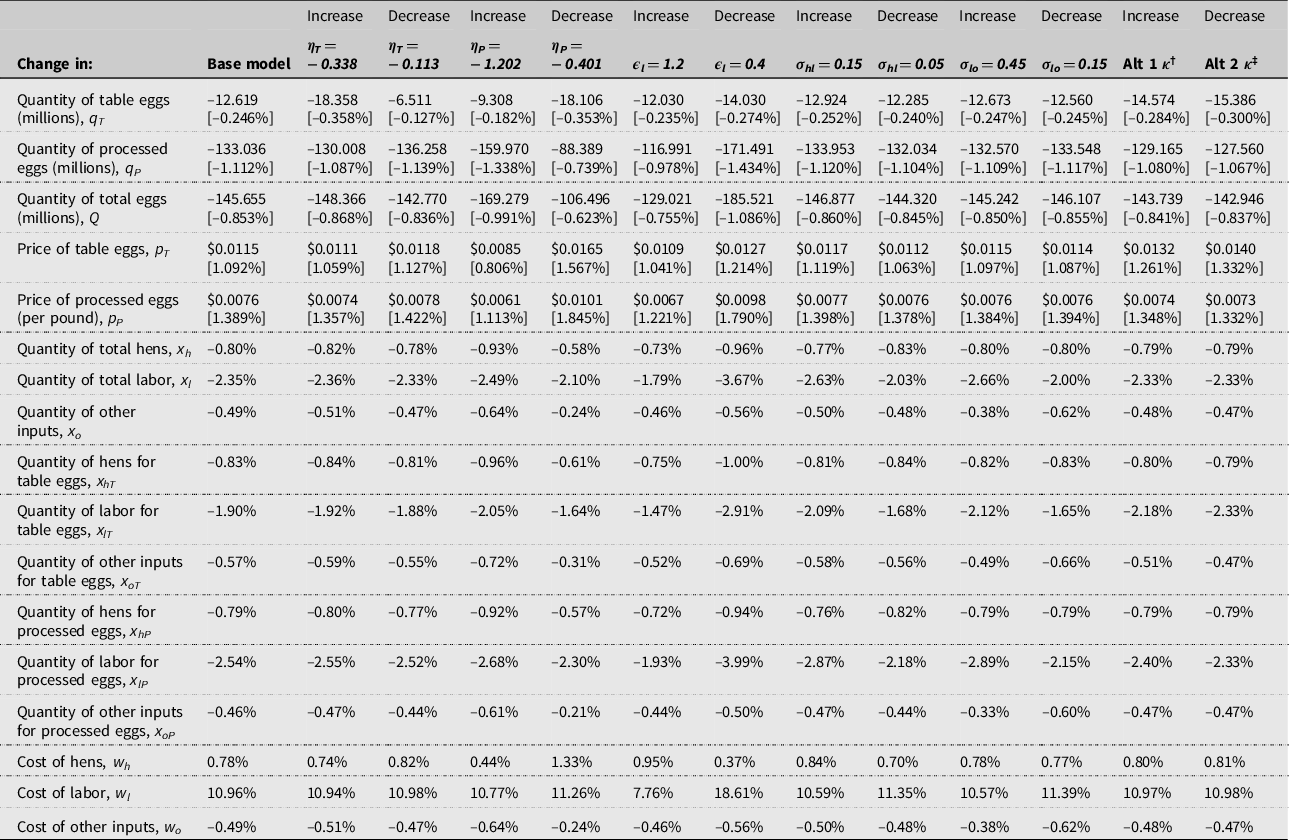
† Alternative κ′s are κ hT = 0.7133, κ lT = 0.7207, κ oT = 0.2146, κ hP = 0.6800, κ lP = 0.0834, and κ oP = 0.2366.
‡ Alternative κ’s are derived from Ibarburu et al.’s (Reference Ibarburu, Schulz and Imerman2019) figures as shown in Table 1 and do not differentiate between table and processed eggs.
The sensitivity analysis for the nonbinding model is similar to that of the binding model. Specifically, the final outcome is quite sensitive to changes in the elasticity of demand for processed eggs. Unlike the binding model, however, the labor supply elasticity is meaningful here because there does not exist a binding price floor. Moreover, the analysis shows that changes to this parameter are also very impactful to the outcome—implicating deviations from the decrease in total eggs from the base model of tens of millions of eggs.
4. Conclusion
This paper analyzed the effects of a future increase to either the state or the federal minimum wage on the Iowa egg industry—the nation’s largest egg producer. The flexibility of the EDM used in this paper can be modified to examine other aspects of the industry, or completely different industries. The results of this model show that when spread across the state’s egg industry, the total negative effects of increasing the minimum wage are not economically significant. This is due in large part to the Iowa egg industry’s current equilibrium wage of $13.50 an hour. Consequently, imposing a $15.00 an hour minimum wage would be a difference of only $1.50, assuming the egg industry does not increase it further. To stay competitive, given the perceived differences in desirability among more-urban jobs, egg industry employers would likely need to increase wages to some level above $15.00 should the minimum wage be increased to that level. Despite these seemingly small effects, egg producers may nonetheless struggle in the short run to respond to immediate labor expenses should the state or nation not phase in its minimum wage over the course of several years. Moreover, an increase in wage, even in a small amount, may affect egg producers net farm income.
Data Availability Statement
The data used in this paper are taken from various published sources and are documented in the publication.
Supplementary material
To view supplementary material for this article, please visit https://doi.org/10.1017/aae.2022.14
Acknowledgements
The authors thank Maro Ibarburu for sharing his insight on the egg industry. They also thank Krishna Paudel for his comments on the manuscript.
Attributions
Conceptualization: A.J.K.; Methodology: A.J.K., M.A.B., and M.Ç. Formal Analysis: A.J.K.; Data Curation: A.J.K.; Writing—Original Draft: A.J.K., Writing—Review and Editing: A.J.K., M.A.B., and M.Ç.; Supervision: M.A.B. and M.Ç.; Funding Acquisition: Not Applicable.
Disclaimer
The findings and conclusions of this paper have not been formally disseminated by the U.S. Department of Agriculture and should not be construed to represent any agency determination or policy. This research was partially supported by the intramural research program of the U.S. Department of Agriculture, Economic Research Service.
Financial Disclosure
No funding agencies were used in this research.
Conflicts of Interest
Andrew Keller is from a leading egg-producing county in Iowa. He has no otherwise connections with the industry. Michael Boland and Metin Çakır declare no conflicts of interests in this publication.
Andrew J. Keller is an agricultural economist with the Economic Research Service at the U.S. Department of Agriculture.
Michael A. Boland is a professor of agricultural economics at the University of Minnesota.
Metin Çakır is an associate professor of agricultural economics at the University of Minnesota.


 Open access