


Introduction
Nano-objects of various types are of increasing importance in a variety of technologies. They enable the development of advanced technologies of many types [Reference Wang and Wang1, Reference Iskandar2] and now appear in a wide variety of industrial, medical, and consumer products [Reference Stark3]. However, there are concerns about the impacts of engineered nanomaterials on the environment and human health [Reference Sajid4, Reference Nel5]. Among the challenges to technologies involving nanoparticles (NPs), or the more general nano-objects, is adequate characterization of particles that may be highly complex [Reference Nel5–Reference Baer7]. The nature and uniformity of layers and deliberate functional [Reference Hennig8] or accidental surface coatings is of considerable importance but is sometimes ignored with the suite of tools routinely used for particle analysis [Reference Grainger and Castner9]. In many circumstances NPs are not exactly as anticipated by those who purchase or synthesize them [6, 7], and X-ray photoelectron spectroscopy (XPS) has been found to be an important analysis method to help in identification of contaminants and inconsistencies.
In this article we demonstrate the use of XPS, in combination with transimission electron microscopy (TEM) or other measurements of size, to examine the thickness of self-assembled monolayers (SAMs) on Au NPs and the thicknesses of multiple layers on quantum dots (QDs). It is also shown that there can be a good correspondence between solution measurements of the number of proteins attached to a nanoparticle in solution and as measured by XPS in vacuum.
Materials and Methods
X-ray photoelectron spectroscopy
XPS is used increasingly for chatacterization of NPs because of its ability to detect very thin surface layers and contaminants [Reference Baer7, Reference Baer and Engelhard10]. Many of the previous XPS studies have been qualitative, just examining whether expected elements or unexpected elements (that is, contaminates) are present. However XPS is a quantitative technique that can provide more detailed information than extracted by many users. By combining appropriate sample preparation with information about particle size, distribution, and shape, often obtained by other methods, it is increasingly easy to combine XPS data with a variety of modeling and computational tools to extract quantitative information about NP structure and the thicknesses of multiple layers on particle surfaces [Reference Mohai11–Reference Werner14].
Modeling thin layers
The surface sensitivity and selectivity of XPS arises from the short distances that electrons can travel within a material without losing energy. The contribution to the detected signal from a depth z into the material will be attenuated by inelastic and elastic scattering from the material above it as the photoelectron travels to the surface. Although the equation is only approximately valid [Reference Jablonski and Powell15], for a sample with a flat surface this relationship is often expressed as:
 $${\rm dI}_{{\rm z}} \,\approx\,{\rm I}_{{\rm 1}} {\rm exp}\,{\rm [{\minus}z\,/\,(\lambda cos\theta )]dz}$$
where dIz is the intensity of the detected signal at depth z, I1 is the intensity that would have been produced if the layer were at z = 0 (the outer surface), λ is the effective electron attenuation length of the electcron, θ is the angle of the detected electron relative to the surface normal, and dz is the thickness of the layer. Because of the exponential nature of this process, ≈95% of the XPS signal arises from the outer of 3λ of the sample, typically 3 to 10 nm. Using effective electron attenuation length information along with known or measured information about particle shape and size, programs that model NP structure and related XPS signals can be compared to XPS spectra acquired from a collection of NPs to obtain quantitataive information about the layered structures present in many nanoparticles [Reference Techane16–Reference Zorn18].
Complementary information
Detailed characterization of NPs is routinely accomplished using a variety of electron microscopy modes, however there are areas and circumstances for which additional information or confirming information is valuable including: i) quantitative determination of the nature and thickness of organic layers that can be damaged by an electron beam; ii) detection and quantification of very thin deliberate or accidental inorganic layers that are either too thin or too similar to the primary particle composition to be readily detected.
It is useful to recognize that XPS measurements collect information from a collection of particles, and the most complete understanding may be achieved by combining results from XPS and appropriate microscopy methods. Recent work has combined STEM/HAADF images of many particles with XPS data from a collection of particles to obtain insights regarding the impact of non-ideal structural features within a collection of particles, such as non-sphericity and off-center cores, on XPS results [Reference Wang19].
Results
Organic layer thickness – SAMs on Au NPs
SAMs are being used to alter or enhance the functionality of Au NPs [Reference Jadhav20]. The thickness and properties of SAMs on Au surfaces have been extensively examined by XPS long before their application to NPs [Reference Fabianowski21, Reference Castner22]. Techane et al. [Reference Techane16, Reference Techane23] used XPS measurements and the simulation of electron spectra for surface analysis (SESSA) [Reference Chudzicki24, Reference Smekal25] (also described in the article by Powell in this issue of Microscopy Today) modeling program to compare SAMs on flat Au and Au NPs. The application of SESSA involves construction of a model layered surface such as shown in Figure 1a. The layer structure included the Au substrate, S from the thiol group attaching the SAM to the Au, the methylene units of the hydrocarbon chain, and a surface functional group. Layers were also modeled around Au nanoparticles as shown in Figure 1b. Because SESSA v1.3 used for their study provided for modeling only flat surfaces, Techane et al. modeled the nanoparticle as a series of concentric cylinders as described in their paper [Reference Techane16]. SESSA V 2.0 simplifies this process by allowing users to identify a variety of particles on which the layered structure may be formed.
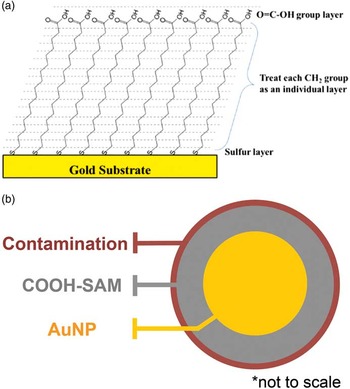
Figure 1 (a) Schematic drawing of the self-assembled monolayer details entered into the SESSA software. (b) Conceptual drawing of a AuNP with a SAM coating capped by a small amount of adventitious carbon contamination. Based on [Reference Techane16]. Using the methods described in the text, the shell or coating thicknesses were determined to be: contamination = 0.15 nm, termination functional group COOH = 0.26 nm, and 16 chain carbon units CH2 = 16 x 0.09 = 1.44 nm.
Regardless of the version of SESSA used, the process used to relate the model to the experimental data is similar to that shown in Figure 2a. The thicknesses of the various layers that make up the particle model are varied in an effort to match the signal strengths predicted by the model to the observed XPS signals. This is often done by varying the thicknesses of individual layers to minimize the variation between the predicted and observed signals. In Figure 2a the thicknesses of a contamination layer are modeled, and a relative sum-of-squares difference [Reference Techane16] is used to indicate the quality of the match. The best agreement between data and the model occurs when the sum of the least squares differences between the data and model are minimized. Based on the minimum in Figure 2a, the thickness of a surface contamination layer was estimated to be between 0.1 and 0.2 nm. Using this process for each layer of the particle and other nanoparticle characteristics, the structural parameters are adjusted to obtain a best match between the data and model. Figure 2b compares the best matches of XPS signal intensities, comparing that predicted using SESSA v1.3 and SESSA v2.0 with the experimental data. The matching of experimental and model intensities requires thicknesses of the various layers to be: contamination = 0.15 nm, termination functional group COOH = 0.26 nm, and 16 chain carbon units CH2 = 16x0.09 = 1.44 nm. This is similar but not identical to the layer thickness observed on flat Au surfaces. For carboxylic acid terminated SAMs on Au NPs, different analysis methods, including XPS/SESSA [Reference Techane16], low-energy ion scattering [Reference Rafati26] and Shard’s core-shell method [Reference Shard12] for modeling XPS layers, have been shown to provide similar layer thicknesses.
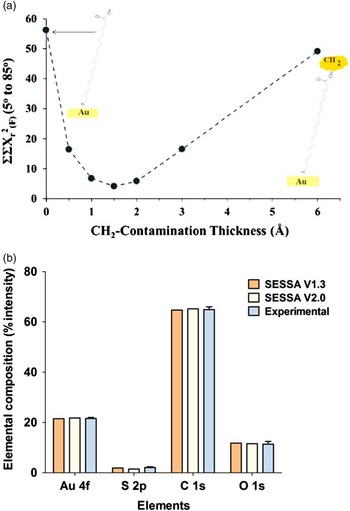
Figure 2 (a) Sum of least squares differences between data and model as the thickness of a carbon contamination layer was varied. The minimum value corresponds to the best agreement between the model and data. Similar thickness variations were used to determine the SAM layer thickness. (b) Comparison of the best matches using SESSA v1.3 (sum of flat plane models) and SESSA v2.0 (spherical nanoparticles) with the experimental data. The resulting thicknesses are: contamination = 0.15 nm, termination functional group COOH = 0.26 nm, and 16 carbon chain elements (∑CH2 = 16x0.09) = 1.44 nm. Based on [Reference Techane16] and follow-on work.
Because creation of a model structure involves a variety of assumptions such as the density profile in the SAM overlayer, the comparison between data and model structures does not provide unique values of layer thicknesses. However, incompatible models are usually easy to identify. For example, it was not possible to obtain a good fit to the data without including the thin contamination layer. In addition, the modeling process provides a consistent appraoch to data intrepration and analysis so that different batches of samples or samples processed in different ways can be compared quantitatively.
Layered quantum dots
Semiconductor nanoparticles or quantum dots (QDs) have potential for a variety of applications, including uses for biomedical science, photonic devices, and sensors [Reference Pilla27]. As described by Pilla et al. [Reference Pilla27], CdSe cores with a band gap ≈ 1.7 eV are often covered by another semiconductor to improve radiative efficiency and environmental stability. These authors note that such a shell provides a physical barrier between the optically active core and the surrounding medium, thereby making the nanocrystals less sensitive to environmental changes, surface chemistry, and photo-oxidation. In particular, CdSe/ZnS core-shell structures have enabled QDs to have broad application in the biomedical sciences [Reference Zorn18]. The growing importance of such NPs with increasingly complex structures calls for robust and rigorous analytical characterization to gain better information about consistency of chemical composition and elemental distribution [Reference Zorn28].
The combination of TEM, XPS, energy dispersive X-ray spectroscopy (XEDS), and time-of-flight secondary ion mass spectrometry (ToF-SIMS) was used to examine a commerical set of CdSe/ZnS core-shell QDs produced by Ocean Nanotech (Springdale, AR). Because a CdS layer can reduce strain induced by lattice mismatch, the particles are actually multilayered particles made up of a CdSe core, a deliberately added CdS transitionlayer, and a ZnS layer, all covered by a layer of hydrophobic surfactant ligands. [Reference Zorn18]. TEM images (Figure 3) of these particles suggest that the non-organic part of the particles has a diameter of about 7 nm. The core shell structure is not visible in this image. Although STEM-HAADF imaging or high-efficiency XEDS mapping data should be able to provide direct information about the layered structure of such particles, detailed analysis is not necessarily straightforward for particles with thin or ultra-thin layers of similar structure or elements of similar electron density. Beam damage or modification to the particle can also be a challenge. XPS measurements can usefully complement microscopy data by providing relatively rapid information about the average structure of a distribution of particles, distinguishing among elements of similar mass and detecting the presence of various types of surface contamination that are sometimes difficult to see with routine microscopy.
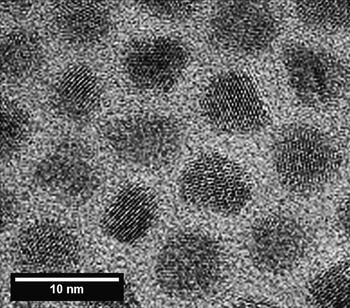
Figure 3 TEM images of an array of these QDs showing an average particles size of ≈ 7 nm. Reprinted from with permission from [Reference Zorn18]. Copyright 2011, American Chemical Society.
In this case a variety of methods can be used to get a relatively comprehensive picture of the particle’s structure [Reference Zorn18]. TEM measurements provide information about particle size, XEDS provides the overall elemental composition of the particles, XPS provides an indication of the surface enrichment, and ToF-SIMS provides molecular information about the surfactant layer. To compare the XPS composition directly to the XEDS composition, the XPS composition needs to be adjusted or corrected to reflect the influence of the particle size (Figure 3) and core-shell-shell structure on the XPS signal strengths. Comparison of the relative agreement between corrected XPS composition and XEDS composition can determine the reasonableness of the proposed structural model. A comparison of the XEDS composition and the corrected XPS composition using an older modeling approach (Zorn et al. [Reference Zorn18]) is shown in Figure 4. The dimensions of the QD core-shell-shell structure that resulted in the corrected XPS composition shown in Figure 4 were: a 4.8 nm diameter stoichiometric CdSe core surrounded by a 0.9 nm CdS transition layer shell and a 0.15 nm thick outer ZnS shell. When the analysis of these particles was undertaken, the presence of a transition layer was not known. The fact that the data could not be well modeled by a two-layer model without a CdS transition layer highlights the importance and value of both XPS measurements and modeling of data.
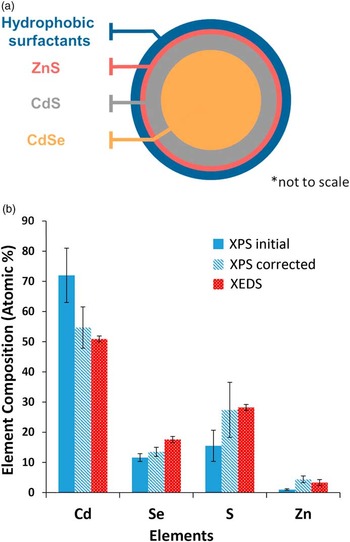
Figure 4 (a) Schematic of nanoparticle with shells of different compositions. (b) Differences in apparent composition determined by the initial XPS and XEDS measurements. Such differences can provide information about the non-uniform elemental distribution within the particles. The XPS signals are impacted by the layered structures of the particles and the kinetic energies (and related path lengths) of the photoelectrons, all of which can be included in particle models. When the XPS signals are corrected or adjusted for the actual particle structure, the thicknesses of layers shown in (a) are determined to be CdSe core = 4.8 nm, CdS shell 0.9 nm thick, ZnS shell 0.15 nm. These give a core particle diameter of 6.9 nm. Based on [Reference Zorn18].
Although this paper highlights the use of XPS to obtain information about the core-shell structures of nanoparticles to complement information from microscopy methods such as STEM and XEDS, medium-energy [Reference Baer7, Reference Gustafson29] and low-energy ion scattering [Reference Baer7, Reference Rafati26] can also be used to obtain important information about shell layers and coating perfection on nanoparticles.
Protein coatings in solution
Many nanoparticles are synthesized, stored, processed, and used in solution. It is very appropriate to ask if measurements of organic layers made in vacuum, especially protein layers that are so important for biological studies, are relevant to their structure and thickness in solution. This specific question has been directly adressed by a series of measurments reported by Belsey et al. [Reference Belsey30] where they used three techniques (ultraviolet–visible spectroscopy, dynamic light scattering [DLS], and differential centrifugal sedimentation) to measure the protein shell refractive indices and thicknesses. These measurements were used to determine the number of protein molecules surrounding Au NPs in solution, while XPS was used to obtain the layer thickness and the number of proteins surrounding Au NPs in vacuum. They examined overlayers formed from two different proteins, immunoglobulin G (IgG) and bovine serum albumin, as well as a peptide. Their IgG results are shown in Figure 5. Although the thicknesses of the protein layer in solution as determined by DSL and that determined in vacuum by XPS are different as would be expected (Figure 5a), the number of protein molecules attached to the particles (Figure 5b) are effectively the same.
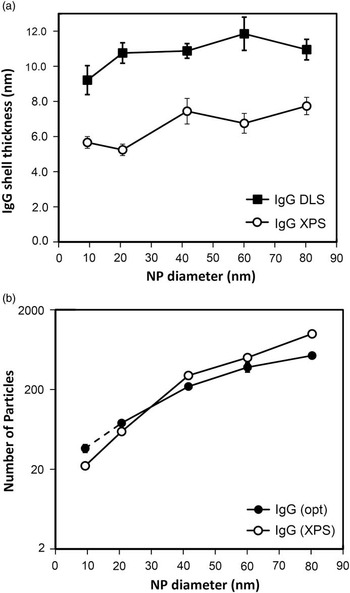
Figure 5 (a) Thickness of immunoglobulin G shell on Au NPs in solution using dynamic light scattering and in-vacuum after removal from solution using XPS. Drying did alter the apparent thickness of the coatings on the Au NPs, but the number of protein molecules adsorbed to the particles as determined by in-solution optical measurements or in-vacuum using XPS (Figure 5b) were nearly identical. Reprinted with permission from [Reference Belsey30]. Copyright 2015, American Vacuum Society.
Discussion
These examples and many others in the literature demonstrate that XPS is an important tool for understanding organic and inorganic coatings, layered structures, and contamination on nanoparticle surfaces. Extracted information from XPS complements and in various ways builds upon information available from electron microscopy. Although much information has been extracted from simple atomic percentage compositions, important additional quantitative information can be obtained linking structural models of the particles with the physical processes associated with XPS to enable comparison with experimental XPS data. In addition to SESSA and the analytical model described above, MultiQuant [Reference Mohai11, Reference Mohai31], QUASES [Reference Tougaard32, Reference Tougaard33], the signal-ratio method developed by Shard [Reference Shard12, Reference Shard34], as well as other “homegrown” models can be used in different circumstances to extract coating and layer thickness information from XPS data. The advancement of these methods and the integration with electron path length and cross section data are making the calculation of layer thickneses on nanoparticles easier to determine using XPS.
Nanoparticles can be quite sensitive to handling and environmenetal changes [Reference Baer7, Reference Baer35]. Reproducible and reliable XPS data have been obtained, but in each circumstance care, reproducible processing, and validation of reproducibility are needed [Reference Baer7, Reference Techane16, Reference Belsey30, Reference Nurmi36].
Conclusion
The ability to extract reliable quantitative information about the surface composition and thickness of coatings is critical to the development of technologies dependent on well-defined nanoparticles, and it provides an understanding of the environmental and biological impacts of such particles. No single analytical method provides the full range of information needed. In addition to high-resolution microscopy methods, XPS has been found to be an important component in the suite of tools needed for adequate nanoparticle characterization. The usefulness of XPS is enhanced when combined with the information provided by careful electron microscopy experiments and comparision of experimental data to models that include the influence of the detailed particle structure on the XPS signal strength.
Acknowlegements
Portions of the research reported here were performed using the Environmental Molecular Sciences Laboratory (EMSL), a national scientific user facility sponsored by the Department of Energy’s Office of Biological and Environmental Research and located at PNNL and at the National ESCA and Surface Analysis for Biomedical Problems at the University of Washington and supported by grant EB-002027 from the National Institutes of Health. Y.-C.W. thanks the U.S. National Science Foundation for a Graduate Fellowship (Grant No. DGE-1256082). DRB acknowledges funding by the National Institutes of Health, National Institute of Environmental Health Sciences under grant U19 ES01954.


