Introduction
Translating complicated hypotheses and conclusions into useful scientific information for students, colleagues, and the public at large is difficult. Illustrations improve communication in scientific reporting [Reference Cassimally1, 2]. Pictures predate writing for this purpose, and using both text and graphics increases impact and understanding. Microscopists, for example, often “know” biological cells pictorially and are able to visualize them, and their organelles, spatially. Others “know” cells differently and produce copious verbiage about them, but they may never really “see” them dimensionally. Thus, occasionally some degree of hardwired or environmentally reinforced bias toward language versus image-based thinking creeps into scientific communications. Unrecognized, such biases can foster serious errors in text and diagrams and cause missed opportunities in teaching. Scholars more adept at transmitting knowledge with language seem to predominate over those who communicate through the visual sense; thus, publications occasionally contain outright erroneous graphics. Pictures are powerful communicators of information, and errors in them undermine the scientific message.
What Makes a Good Diagram?
Information
When knowledge is accurate and communication between scientist and artist is effective, then good diagrams follow. Review papers are excellent places for comprehensive descriptions to bolster knowledge [Reference Ochs3]. Where data are not known and questions abound, communication may be poor, and erroneous diagrams may result.
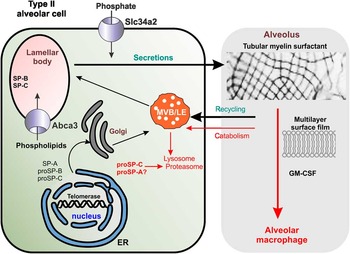
Alveolar cells line the alveoli of the lungs, and alveolar type II cells, 5–7 µm in diameter, comprise a small percent of the alveolar surface area. But these cells secrete surfactant that is critical in lowering surface tension in the alveoli. Much detailed information about these cells comes from transmission electron microscopy (TEM). To demonstrate the problem of creating good diagrams of these cells, two diagrams of alveolar type II cells are presented here, both based on the same data. Figure 1 is a diagram of an alveolar type II cell with misinformation, which is similar to diagrams actually published in prestigious journals [Reference Whitsett4]. Figure 2 shows that diagram edited to provide more accurate visual data.

Figure 1 Sample diagram of an alveolar type II cell showing how simple errors in organelle position, relative sizes, incidence, transporter notation, extraneous raster images, and redundancies can misrepresent the known details. Inaccurate diagrams can become established and perpetuated in the scientific literature.

Figure 2 Alveolar type II cell. The apical plasmalemma has microvilli, lateral membranes are indicated by hash marks, and the basal plasmalemma has adjacent gray area representing basement membrane. The nucleus (nucleus) is shown in blue with areas of condensed and open chromatin. A double-helix icon calls attention to telomerases/telomeres, which can play a role in alveolar type II cell function, surfactant production, and human disease. The nuclear membrane is continuous with the rough endoplasmic reticulum (RER), and the pathway of surfactant production progresses from the RER to the Golgi (dotted arrows), to vesicles, to multivesicular bodies/late endosomes (MVB/LEs), and finally to lamellar bodies (LBs). Secretion of surfactant occurs at the apical membrane. Other colors and symbols indicate the following: mitochondria (purple); lysosomes and proteosomes (red); surfactant protein A (SP-A); pro-surfactant proteins B and C, (proSP-B, proSP-C). Different symbols for membrane transporters highlight their dissimilar functions. Surfactant is indicated by myelin-like swirls, and the re-uptake of surfactant into macrophages (partial cell bottom right) is enhanced by the presence of granulocyte macrophage stimulating factor (GM-CSF).
The cell
In general, it is preferable to list the name of the cell type before any sub-classification, for example, rather than “type II alveolar cell”, use “alveolar type II cell”. Alveolar type II cells are acceptably drawn as cuboidal, but a single solid outline implies that all portions of the cell membrane (plasmalemma) function similarly (Figure 1), which is not always true. In Figure 2 the cell has polarity: microvilli define the apical membrane at the right-hand side of the cell, hatch marks at top and bottom of the plasmalemma represent junctional complexes on lateral plasmalemma, and a gray band on the left indicates the basement membrane adjacent to basal plasmalemma.
A light gray bounding box (right side, Figure 1) is presumed to represent the alveolar space. But, the “white space” between the alveolar type II cell and gray box becomes confusing. Does it represent surfactant hypophase? Figure 2 depicts the entire alveolar space without color. It also permits a logical positioning of an alveolar macrophage (Figure 2). The text “alveolus” now is aligned with the text “alveolar type II cell” to show a division from cellular to extracellular.
Organelle placement
The alveolar type II cell in Figure 1 shows a single lamellar body (LB), depicted as an oval, positioned close to what is assumed to be lateral plasmalemma (an arrow points to the apical membrane in Figure 1, and there is the word “secretions”). Because exocytosis of LBs occurs at the apical membrane, this organelle is better placed just beneath the apical plasmalemma as shown in Figure 2. In addition to placement, relative size and numerical density are extremely important in diagrams, so using a single oversized LB as seen in Figure 1, misinforms. Figure 2 uses smaller LB to indicate that there are many in each type II cell. The vast majority of electron micrographs from many species show LBs with distinctive, electron-dense, parallel or concentric lipid leaflets, a morphology not noted in Figure 1, but shown in Figure 2. Two mitochondria were added to Fig. 2 for completeness.
Nucleus
The ratio of nucleus to cytoplasm in a generic cell is about 0.45. A random selection of 50 alveolar type II cells imaged by TEM produced a ratio of about 0.37, much larger than the ratio of 0.1 (determined morphometrically) depicted in Figure 1. This ratio was corrected in Figure 2. The inner and outer nuclear membranes in Figure 1 show breaks, which in reality should not be “breaks” but should be nuclear pore complexes spanning both the inner and outer nuclear membranes. Uneven and out-of-position profiles of the nuclear membrane in Figure 1 (blue) were careless and have been redrawn in Figure 2.
Anatomical icons
Figure 1 used icons based on electron microscopic structures, but then it depicted DNA as a double helix rather than the nuclear structure that would be consistent with that genre: areas of euchromatin, condensed chromatin, and a nucleolus. In addition, the double helix was shown at the center of the nucleus in Figure 1 but labeled with the word “telomerase,” probably in an attempt to bring attention to the fact that a telomerase gene is important in surfactant production. But this presentation derails any pertinent visual associations. This double-helix icon is not only disproportionately large, but it has no T-loop/D-loop structure or proteins indicative of telomers and telomerase and is not positioned close to the inner nuclear membrane where telomers and telomerase-complexes might be found. In Figure 2 there is a considerable reduction in the size of the double helix (still inappropriately large, but better), and a generic object, colored similarly to the text (green), clearly identified as telomerase, has been added. Figure 2 also displays a diagrammatic distinction between euchromatin (shaded blue to white) and condensed chromatin (blue), which allows placement of the DNA helix and telomerase at the inner nuclear membrane near condensed chromatin where it might typically be found.
Proteins
Importantly, Figure 1 strives to highlight membrane proteins known to be particularly important for surfactant production. It depicts ABCA3, a transport protein reportedly found in the limiting membrane of LBs, with a sphere and an inward pointing arrow. The lowercase text indicates mouse gene nomenclature, not human, while human protein was mentioned in the text. The same sphere-like symbol used for ABCA3 was also used for SLC34A2, the sodium-potassium symporter found on the apical plasmalemma of alveolar type II cells. Note that ABCA3 is an ATP binding cassette superfamily member, not in the same superfamily as solute carrier protein SCL34A2. Using the same symbol for both types of transporter wrongly suggests a similar function. Figure 2 uses an arrow-shape for ABCA3 (purposefully mimicking the structure of ABCA3, a split arrowhead). This provides a visual distinction between ABCA3 and SLC34A2.
To indicate the location of uptake of phosphate ions from the alveolar space via proteins in the apical membrane, a sphere and single inward pointing arrow was labeled as SLC34A2 (Figure 1). A single arrow is the symbol used for uniporters, but SLC34A2 is a symporter. It is likely that numerous transporters are involved in maintaining intracellular phosphate homeostasis for synthesis, reuptake, and recycling of phospholipids. An accurate depiction specific for SLC34A2 also would have shown the obligatory sodium ion import, either electrogenic or electroneutral depending on the isoform, which Figure 2 now implies with two inward pointing arrows [5–Reference Saito7]. In Figure 2, all the icons for generic phosphate import, and parentheses for SLC34A2, are located on the apical plasmalemma with the surface microvilli, unlike Figure 1 where the symbol lies above what is erroneously construed, by default, as lateral plasmalemma (denoted by hash marks in Figure 2).
Endoplasmic reticulum
The endoplasmic reticulum (ER) in Figure 1 lacks ribosomes, and by convention, then, is smooth, but its position at the nuclear membrane implies that it is rough endoplasmic reticulum. There are numerous ribosomes in the type II cell, membrane-bound and free, therefore an accurate depiction of the ER continuous with the nucleus includes the addition of just a few ribosomes in Figure 2 and a relabeling as rough ER (RER). In addition, one profile of ER in Figure 1 spans nearly three-quarters of the circumference of the nucleus, not at all representative of what is seen with TEM. That profile was divided into smaller segments in Figure 2, and the frequency of continuities between the RER and outer nuclear membrane and perinuclear space was increased, along with the addition of a few vesicles leading to the cis face of the Golgi.
Golgi
The Golgi apparatus was shown near the nucleus, the latter with gray shading in both figures, but without vesicles, of which there are many in type II cells. An arrow from the ER in Figure 1 indicates that surfactant protein A (SP-A), pro-surfactant protein B and C (proSP-B, and proSP-C) move through the cytoplasm from RER through Golgi with a mandatory stopover within the multivesicular body/late endosome (MVB/LE). There are enough unanswered questions about the movement of surfactant proteins, particularly SP-A, from their respective production sites into LBs, that such a narrow representation may not be justified. In addition, direct fusion of the RER with LBs, bypassing Golgi and MVB/LE altogether, occurs commonly. Dotted arrows now in Figure 2 imply that route is variable. A few structures depicting lysosomes and proteasomes were added in Figure 2.
Tubular myelin and surfactant
The depiction of tubular myelin in Figure 1 was misleading since routine TEM almost always shows a heterogeneous tangled mix of surfactant lipid layers, lamellar structures, proteins, and debris in the alveolar space, with only infrequent portions of orderly tubular myelin lattice. Many studies suggest that the lattice structure is dependent on the presence of SP-A and is not actually required for surfactant function [Reference McCormack8]. There is little need for an electron micrograph here, and it gives a skewed emphasis to a small part of the overall diagram. Figure 2 uses tracings of actual randomly selected heterogeneous surfactant. This also emphasizes the uptake of surfactant by alveolar type II cells and macrophages, as well as maintaining the “vector” quality of the entire diagram. The image of a generic lipid bilayer in Figure 1 is not truly representative of surfactant. Mature surfactant has been shown in countless publications to have various protein components necessary for structure, function, and many other purposes; therefore, lipid bilayer image in Figure 1 was deleted in Figure 2.
Uptake of spent surfactant from the alveolar space can occur at the apical membrane (shown on the right with a microvillar-studded surface), progressing, perhaps, through late endosomes (LE) and proteasomes. Separate arrows for recycling and catabolism in Figure 1 without descriptions of how these pathways might differ within the same MVB/LE beg debate and are combined in Figure 2, with uptake (recycling and catabolism) considered as one event involving MVB/LE. Likely the major uptake of surfactant from the alveolar space occurs via the alveolar macrophage (a portion of a macrophage is now present in Figure 2). The arrow and label depicting reuptake in Figure 1 was made bold in Figure 2, emphasizing that surfactant reuptake is facilitated by granulocyte-macrophage colony-stimulating factor GM-CSF.
Discussion
While cells and organelles can appear to be of various shapes when single 2D images of sections are analyzed, the features described above can be observed in most TEM images of alveolar type II cells. Figure 3 shows an example TEM image of such a cell. Most of the features described above in relation to Figures 1 and 2 can be seen in Figure 3. Indeed, the information to produce the former figures came from careful study of hundreds of images similar to Figure 3.

Figure 3 Transmission electron micrograph of a thin section through an alveolar type II cell. The apical plasmalemma exhibits microvilli (arrows). Lateral membranes are not visible in this section, and the basal plasmalemma has a gray line lying over a portion of the adjacent basement membrane. The nucleus (nucleus) has areas of condensed and open chromatin, and a nucleolus is present (white arrowhead). A double-helix icon calls attention to telomerases/telomeres, which play a role in alveolar type II cell function, including surfactant production. Several profiles of rough endoplasmic reticulum are seen (RER), two adjacent to the outer nuclear membrane and one with layered protein contents. Multivesicular bodies/late endosomes (MVB/LEs), lamellar bodies (LBs), and mitochondria (M) are also present. Secretion of surfactant, as LBs, occurs at the apical membrane. Alveolar space is seen bottom left and bottom right, and a small portion of lamellar surfactant can be seen in the latter. Bar = 2.7 µm.
Thus, the data shown in Figure 2 are no different from those in Figure 1 except in anatomical accuracy, which requires that both scientist and illustrator come together with the facts. The scientist must explain details sufficiently for the illustrator to depict an accurate event, and the illustrator must inform the scientist when the request is not understood or unclear. For the naturalist, renditions of nature are simpler because the examples are present [9–Reference Hajar11], but when concepts are abstract, and entities, molecules, and particles are microscopic, then every effort must be made to make the depiction accurate. In Figure 2 considerable effort was made not to “trip up” the reader by careless symbols and omissions while keeping the diagram simple and informative. Table 1 presents general guidelines for creating scientific illustrations that inform and support a manuscript.
Table 1 Guidelines for creating scientific illustrations that inform and support a manuscript.

Conclusion
Illustrations and line drawings convey information in a standard manner: “artistic license” should not replace knowledge of the subject matter. In summary, one might say: “Inaccurate words cause confusion; inaccurate illustrations cause 1,000 times more confusion.”
Acknowledgements
Thank you to Drs. Daniel W. Nebert and Manoocher Soleimani. Support from NIEHS Health Sciences Center and Center for Environmental Genetics grants ES00159, ES06096, and ES02847 is gratefully acknowledged.