Introduction
Over much of the Canadian Arctic Archipelago, surface temperatures are below 0°C from September to May (i.e. the Oé C isotherm orfreezing level does not rise above the surface). The freezing level reaches a maximum elevation in July, and hence changes in the mean elevation of this surface can greatly influence the area of snow and ice affected by melting. With freezing levels near the ground surface, sensible heat exchange is low and receipts of long-wave radiation are reduced, resulting in less energy available for melting (Reference PatersonPaterson, 1969).
The height of the freezing level also determines the relative proportions of precipitation reaching the surface as rain or snow. As the elevation of the freezing level lowers, the percentage of precipitation falling as snow at the surface increases; when the freezing level is below approximately 250 m, 50% of the precipitation at the surface is in the form of snow. This has been shown for both mid-latitudes ( Reference MurrayMurray,1952, Reference Murray1959) and Arctic regions (personal communication from R. G. Barry). By controlling the altitudinal zonation of rain and snow during the peak of the ablation season, the height of the July freezing level also has an important influence on surface albedo which remains high where summer snowfall occurs and thus further diminishes the energy available for melting.
ELA, mass balance and the freezing level
In any balance year the equilibrium line is the boundary between the zone of net accumulation and the zone of net ablation on a glacier. The height of the equilibrium line is thus an integrated measure of the relative amounts of accumulation and ablation throughout the mass-balance year. In negative mass-balance years the equilibrium line altitude (ELA) will be high, while in positive mass-balance years the reverse is true. By examining variations of climatic parameters with changes in equilibrium line altitude, the principal climatic influences on the ELA can be determined.
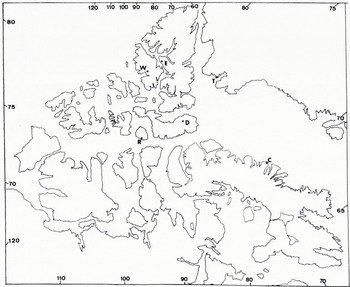
Few records of equilibrium line altitude variations are available for Canadian Arctic. However, on the White Glacier, Axel Heiberg Island (Figure i) ELA measurements have been kept for about a decade ( Reference Müller and FletcherMuller,1966, Reference Müller1967, Reference Müller1968, Reference Müller1970). The White Glacier extends from 75 m to 1 400 m a.s.l., with an average gradient of 1 in 10 (Reference AdamsAdams, 1966). Surface and upper-air climatological data are available for Isachsen (lat. 78° 47° N., long. 103° 32° W.), 300 km to the south-west, and Eureka (lat. 80° 00° N., long. 85° 65° W.), 110 km to the north-east. Table I shows correlation coefficients between the While Glacier ELA and various climatic parameters. The equilibrium-line altitude is poorly correlated with winter precipitation, particularly at Eureka, which is situated in the lee of the Axel Heiberg mountains. However, very high correlations (significant at < 1 % level) exist between the ELA and July freezing levels* at both Isachsen and Eureka. Mean summer (June, July and August) freezing levels are less highly correlated with ELAs.

Fig. 1. Location of places mentioned in text. E = Eureka, Ellemere Island; W = White Glacier, Axel Heiberg Island; R = Resolute, Cornwallis Island; D = Devon Ice Cap, Devon Island; C = Clyde, Baffin Island; T = Thule, Green land. Note: only the Devon Ice Cap is stippled.
Tabel I. Correlation Coefficents Between Climatic Parameters Measured at Eureka and Isachsen and the ELA on White Glacier, Axel Heiberg Island, 1959/60 to 1968/69 (excluding 1967/68)

Fig. 2. Equilibrium-line altitudes on the White Glacier. Axel Heiberg Island, in relation to July freezing-level heights at Eureka (1959/60) to 1968/69); no data for 1967/68). Geopotential metre ≈ 0.98 meters. Freezing level for July 1960 related to ELA for 1959/60, etc. (While Glacier data from , Reference Müller and FletcherMaller,1966, Reference Müller1967, Reference Müller1968 and Reference Müller1970.)
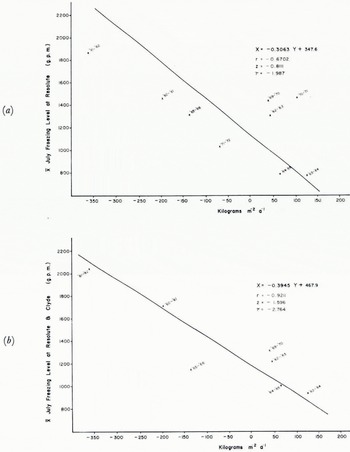
Figure 2 illustrates the relationship between July freezing-level height at Eureka and ELAs on the White Glacier, Axel Heiberg Island. Although the record is short, it is clear that the height of the freezing level in July has an important influence on the equilibrium-line altitude of the glacier. A similar analysis was carried out using the record of ELAs on the north western sector of the Devon Ice Cap (Reference KoernerKoerner, 1970 and personal communication), and July freezing levels at Resolute, 350 km to the west (Fig. 3a). Again a strong correlation (significant at <1% level) is indicated, though again the small number of points requires caution in interpretation. However, in view of the importance of the freezing level (discussed above), it is not difficult to see a meaningful physical relationship between freezing-level height and equilibrium-line altitude. Furthermore, the ELA on the Devon Ice Cap is closely related to glacier mass balance (Reference KoernerKoerner, 1970, fig. 8) and so the relationship between mass balance and July freezing-level height was also examined (Fig. 4a). As expected, there is a negative relationship (statistically significant at <% level), with low freezing levels corresponding to positive mass-balance years. Both figures, although based on limited field observations and upper-air data a considerable distance from the ice bodies, suggest that July freezing-level height acts as a major control on the mass balance and ELA of these high Arctic ice bodies. Upper-air soundings closer to the ice bodies may improve the relationships even further. This is suggested, in fact, by the higher correlation coefficients between the average of July freezing levels at Resolute and Clyde and the ELA and mass balance on the north-west Devon Ice Cap (the ice cap lies between these two upper-air stations) (Figs 3b and 4b). However, the Clyde station closed in 1970 and so today the nearest upper-air station to the ice cap is Resolute. It is very likely that upper-air data from Thule would also improve the prediction of ELAs on the Devon Ice Cap. However, unlike the Canadian stations, Thule is operated entirely by the U.S. Weather Bureau and freezing levels are not explicitly analysed and published. Freezing levels could normally be obtained from significant-level data but these are not available for Thule. Consequently freezing levels at Thule must be obtained either from interpolation between standard pressure levels (which is not a very reliable method) or from examination of individual daily soundings for the relevant period. Because of the cost and inherent problems of such data reduction it was decided that Canadian stations which are closest to the Devon Ice Cap would be used (Fig, 1) and the results clearly indicate that an improvement in the relationship is achieved by the use of both Clyde and Resolute data. It would be of interest for upper-air soundings to be taken directly above these ice bodies to see what further information might be gained from observations in the immediate vicinity rather than from stations hundreds of kilometres away.

Fig. 3. Equilibrium-line altitudes on the Devon Ice Cap, north-west sector, in relation to: (a) July freezing level heights at Resolute (Cornwallis Island), 1960/61 to 1971/72: (b) an average of July freezing level heights at Resolute and Clyde, (Baffin Island), 1961/62 to 1970/71. The ELA for 1967 has been omitted because it is based on fewer observations than other years, (Devon Island from a from Reference Müller and FletcherKoerner, 1970 and personal communication, 1973.)
Limitations of the regressions
Although a plot of Elas on these two ice bodies and adjacent upper-air data indicates a simple linear relationship based on 10 or 12 points there are physical constraints to be considered which place limitations on (he regression. For example, in a very cold summer (low July freezing level) the firn line will be lowered. If the following summer is warm and melting occurs, much of the melt may be absorbed by the porous firn resulting in a less negative balance than the freezing level suggests. This, in fact, is the case for the warm summer of 1966 (preceded by two extremely cold summers) and 1969 (preceded by the cold summer of 1968).
Adjusting the ELA downward to account for this would bring both points closer to the regression line for the other years (see Fig. 3b). Similarly, the mass balance for these years would appear to be lower than is actually the case, as shown by the balance year 1965-66 (Fig. 4b). Adjusting this upward (i.e. towards a more positive balance) would bring the point closer to the regression line for the other years. Thus, although there are glaciological considerations to be taken into account with the linear relationship outlined above these actually appear to reinforce the connection between upper-air data and glacial mass balance.
Recent freezing level changes
In view of the fact that there appears to be a close relationship between annual equilibrium-line altitudes in the high Arctic and the corresponding mean July freezing levels, it is of interest to consider recent freezing-level changes in the area in relation to the “steady-state” ELAs,
estimated from the 1: 250 000 topographic maps of the Canadian high Arctic (i.e. north of lat. 72° N.) (Reference Miller, Miller, Bradley and AndrewsMiller and others, 1975). As a result of large falls in July freezing levels through out the Canadian archipelago since 1963 (Reference BradleyBradley, 1973), the mean July freezing levels 1963-72 have been below the “steady-state” ELAs over large areas of northern and central Ellesmere Island and north-central Axel Heiberg Island. This suggests that during the period 1963-72, a large upland area in the Canadian high Arctic experienced predominantly positive mass-balance years. Unfortunately, no regular observations were made in this remote area during the last decade, but some support for this suggestion comes from the observations made by Reference Hattersley-SmithHattersley-Smith (1972) on a traverse across the United States Range, northern Ellesmere Island in 1967. He notes that the former percolation facies of the ice cap above 1 800 m had been changed to an almost dry-snow facies and the equilibrium line on the glaciers had been lowered to an elevation of about 900 m from a mean of about 1 200 m in the years 1957-63. This fall in the equilibrium-line altitude is similar to the recent decrease in mean July freezing level observed at Alert and Eureka (Reference BradleyBradley, 1973). Highly positive net budgets on the Gilman Glacier, northern Ellesmere Island, have also been noted by R. B. Sagar for the period 1962-67 (c. +230 ° 106 m3 H20) (Reference Müller and FletcherHattersley-Smith, 1972) and recent expansion and thickening of a small ice cap on north-eastern Ellesmere Island have been reported (Hattcrslcy-Smith and Serson, 1973).

Fig. 4. Man balance on the Devon Ice Cap, north-west sector, in relation to; (a) July freezing level heights at Resolute (Cornwallis Island), 1960 to 1965/66 (no data for the rears 1966/67 to 1968/69) and 1969/70 to 1971/72; (b) an average of July freezing-level heights at Resolute and Clyde (Baffin Island), 1960/61 to 1965/66 and 1969/70. No mass-balance data for 1966/67 to 1968/69 and no Clyde upper-air data after 1969/70. [Devon Island data from Reference Müller and FletcherKoerner. 1970 and personal communication, 1973.)
In interpreting the climatological and glaciological evidence it should be noted that, although (here is a strong relationship between ELA, mass balance and July freezing-level variations over time, small-scale maps of mean July freezing levels over the period 1955-63 do not resemble the small-scale “steady-state” ELA maps in details. These differences may point to the influence of other macroscale climatic factors or may reflect the problems of mapping ELAs over large areas, and at a point in time when the ice bodies may not be in equilibrium with contemporary climate. If ice bodies represented on the 1: 250000 maps are lagging in response to the post-1880 warming trend, the estimated ELAs may be unrealistically low. However, as the recent freezing levels (1963-72) are below these estimated ELAs the predominance of positive mass-balance years over the last decade for a large part of northern Ellesmere and north-central Axel Heiberg Island is a reasonable assumption.
Conclusion
It has been shown that in recent years at the high Arctic sites examined, a strong relationship exists between equilibrium-line altitude, mass balance and the corresponding mean height of the freezing level in July of that year. If studies at additional sites support these relationships, they may provide a technique for estimating the broad-scale net balance over much of the Canadian high Arctic. In addition, estimates of palaeo-equilibriuin-line altitudes maybe interpreted more meaningfully in terms of this relationship. However, it should be noted that the two areas for which ELA records have been examined are representative of an area where winter precipitation amounts are small and the summer ablation period is relatively-short (i.e. where mass exchange is low). In areas where winter precipitation amounts are higher and the ablation season longer, it is doubtful that the height of the July freezing level will be the major control on the equilibrium-line altitude.
Acknowledgements
This work was partly supported by a contract to J. T. Andrews from the Glaciology Division, Environment Canada, Ottawa, Canada. I would like to thank Drs R. M. Koerner, J. T. Andrews, L. D. Williams, G. H. Miller, R. G. Barry and J. H. England for helpful discussions and comments.