


Introduction
Resource allocation is a strategic decision, and burden sharing in international organizations is central to the study of international collective action. North Atlantic Treaty Organization (NATO) and the European Union (EU) both seek to influence members not just to increase overall defense spending, but also to spend more on equipment modernization. What drives such increases? Most research on transatlantic burden sharing focuses on the international sources of differences in top-line defense spending. Yet in a ‘fog of peace’, in which allies cannot agree about a single threat, compelling them toward ‘a particular strategic path (Goldman, Reference Goldman1994, 40–42)’, domestic politics takes on more importance than international factors. This article advances and tests a theory about domestic sources of burden shifting: ‘limiting contributions to the collective effort… without wrecking the alliance (Thies, Reference Thies2015, 5)’.
What is the relationship between unemployment and defense spending? I find that governments reduce spending on agreed priorities as unemployment increases. Not only do they slightly decrease overall defense spending as a share of GDP, they decrease, over time, the share of equipment in both defense budgets and GDP, shifting resources into personnel. Doing so is the opposite of the balanced ‘3 C’s’ approach to burden sharing that allies have agreed.Footnote 1 Although the long-term employment effects of the COVID-19 pandemic are unclear, it is a severe shock. This development, combined with the finding that unemployment dampens burden-sharing efforts, suggests that unemployment may be a particular challenge for allies as they seek to meet their public commitments to one another.Footnote 2
I focus on the composition of defense budgets to analyze burden sharing as defined by NATO and EU members themselves, bridging a gap between research and policy. States can burden shift by decreasing overall defense expenditures, but they do so more subtly by shifting defense resources away from equipment and into personnel, which need not – and often does not – occur through hiring additional personnel. Focusing on the composition of defense budgets as NATO and EU members track them, and in areas that they have identified as strategic, helps bridge a gap between research and policy. While this paper is not the first to disaggregate defense spending (Becker and Malesky, Reference Becker and Malesky2017; Bove and Cavatorta, Reference Bove and Cavatorta2012), no study to date has explicitly analyzed the effects of an exogenous variable on states’ ability to meet their declared aims of spending 2% of GDP on defense and 20% of defense budgets on equipment (European Council, 2016; NATO, 2014).
I draw on defense economics research on burden sharing, international security literature on alliances, and political economy research on the domestic and regional implications of defense spending to develop and test a theory that unemployment dampens burden sharing, as defined by NATO and the EU.Footnote 3 I contribute to these literatures, as well as to the political economy of security subfield, which draws them together. In particular, I analyze the factors that shape ‘guns vs. butter’ trade-offs, which are more complicated than the current literature acknowledges, and vary among countries. My findings may also interest students of labor markets, political economies of multilateral and national institutions, and European politics. Specifically, the use of disaggregated defense spending data for a more detailed understanding of macroeconomic trade-offs perceived by leaders can help inform policy: employment policies on both sides of the Atlantic are likely to shape defense spending choices. Scholars can help inform policy-makers by disaggregating defense spending into the categories that interest policy-makers, and identifying factors that may affect the likelihood of policy initiatives coming to fruition. While unemployment is a thorny problem, it is more amenable to national policy than is, for example, threat proximity or behavior. National action, or even multilateral coordination, is more likely to affect unemployment than it is to move a national capital farther from Moscow, or to affect the capabilities or intent of transnational terrorist groups.
I test my predictions using World Bank (2019) unemployment data for 34 members of NATO and the EU from 1991 to 2019, and a purpose-built data set containing disaggregated defense spending tracked by NATO (NATO, 2018) and the EU (European Council, 2016), covering the same countries and years. These variables allow me to test the relationship between unemployment and burden shifting, controlling for a set of theoretically important covariates in a variety of empirical forms and specifications. Data availability for those covariates means that the main models in the paper include fewer countries (30) and years (2004–18).
Unemployment leads states in Europe and North America to shift defense burdens to their allies – the opposite of what they have pledged. To avoid jeopardizing the security benefits of alliances, governments respond to unemployment with small top-line defense cuts, and larger shifts within defense budgets from capabilities and contributions, into personnel. Economic distress thus affects defense spending as governments seek to burden shift by using military spending as ‘welfare policy in disguise (Whitten and Williams, Reference Whitten and Williams2011, 117)’, making the most prominent shifts in the composition of defense budgets, rather than overall national budgets.
My analysis is robust to multiple specifications and identification strategies, the use of several subsamples capturing varying institutional memberships, and different data sources. This robustness suggests that the relationship between unemployment and defense burden shifting is not the result of common statistical pitfalls.
In short, my findings suggest that transatlantic burden sharing is closely linked with national labor markets. Unemployment is a leading indicator of declines in defense investments in capabilities and operational readiness. Rather than a simple guns vs. butter trade-off, members of the transatlantic community are challenged to ensure economies generate enough butter (employment opportunities) to enable their defense planners to focus on capabilities and readiness.
Unemployment, domestic political economies, and defense spending
In spite of rich burden-sharing research on international, domestic, and institutional drivers of defense spending, there is no consensus on relationships between defense spending and economic performance, even among meta-analyses (Alptekin and Levine, Reference Alptekin and Levine2012; Dunne and Smith, Reference Dunne and Smith2020).
Do governments behave as if defense spending reduces unemployment? My findings suggest that they do. While states with significant domestic defense industries can generate employment through the procurement of new equipment, those without can channel stimulus into their domestic economies much more directly through personnel – not just by hiring more, which is rare in practice, but by preserving personnel from cuts, or by maintaining or increasing compensation. Even with the use of offsets,Footnote 4 equipment procurement cannot offer this kind of stimulus to the majority of European economies, which have no significant domestic defense industry.
Burden-shifting research notes how difficult it is to actually identify qualitatively: members of the transatlantic community ‘cannot openly shirk … jeopardizing the alliance that all value highly (Thies, Reference Thies2015, 8)’. Scholars and practitioners have only recently focused on disaggregated expenditures to resolve this difficulty; analyses remain incomplete (Becker, Reference Becker2017).Footnote 5
This incomplete picture leaves open questions regarding burden sharing in international organizations. The 2014 Wales Pledge on Defense Investment,Footnote 6 NATO’s most significant public effort to address the burden-sharing issue, emphasizes equally topline defense spending (2% of GDP) and equipment modernization (20% of defense spending). The European Council (2016) formally embraced those aims soon after.Footnote 7 Empirical analysis (Becker, Reference Becker2017) validates NATO Secretary-General Jens Stoltenberg’s (Reference Stoltenberg2018) alliterative linkage between today’s ‘cash’, tomorrow’s ‘capabilities’, and operational ‘contributions’. Identifying and modeling domestic drivers of disaggregated defense spending can help us learn if such pledges work.
Testing relationships between national-level independent variables and dependent variables that capture actual burden-sharing behavior – rather than just top-line defense spending – thus helps bridge gaps between international political economy, international relations, defense economics, and foreign policy. The insight that unemployment drives states to burden shift highlights the connection between transatlantic economies and foreign, security, and defense policy. It also affirms theoretical work identifying disaggregated defense spending as a countercyclical policy tool.Footnote 8
Theory: international and domestic collective action
While research on causes and effects of overall defense spending is well developed, no published study has directly tested relationships between domestic unemployment and burden sharing as NATO and the EU have defined it. I build on three strands of literature to develop my theory on the relationship between unemployment and budget composition: first, defense economics research on alliance burden sharing; second, international security research on alliances; third, international political economy research on domestic origins of defense spending.
Alliance burden sharing as a collective action
Collective action theorizing weighs heavily in the economics literature on burden sharing. Olson and Zeckhauser (Reference Olson and Zeckhauser1966) first developed an exploitation hypothesis, whereby smaller allies free ride on larger allies’ expenditures. Operationalizing spillover effects as the total spending of all other allies, Sandler and Forbes (Reference Sandler and Forbes1980) found that prior to 1967 allied defense spending was a public good – its consumption was both non-excludable and non-rivalrous. After 1967, though, it became a joint product, meaning that the degree of publicness varied (Cornes and Sandler, Reference Cornes and Sandler1984). Threats from states and non-state actors are now part of defense spending models.
The defense economics literature thus suggests that alliance burden shifting is endemic. Larger allies may use international organizations to induce transparency or to coerce smaller allies into spending more than they otherwise would.
I argue that opportunities for coercion, but particularly transparency (through institutionalized sharing of defense spending and capabilities) in international organizations like NATO and the EU means that unemployment-related burden shifting is subtle. As unemployment increases, states shift small amounts out of defense budgets, obscuring larger shifts within budgets – out of agreed priorities and into personnel. NATO and the EU emphasize overall defense spending and the share of that spending allocated to equipment and operations as primary burden-sharing metrics, consistent with the definition of burden sharing as the ‘distribution of costs among group members in support of common goals (Cimbala and Forster, Reference Cimbala and Forster2005, 1)’.
International security: threats, institutions, and culture
The international security literature also emphasizes the role of state (Walt, Reference Walt1987) and non-state (Haesebrouck, Reference Haesebrouck2018) threats in alliance politics. Institutionalist work emphasizes adaptability in international organizations (Wallander, Reference Wallander2000). Constructivist scholars (Oma, Reference Oma2012) point to the role of strategic culture in alliances and coalitions.
While I acknowledge that threats, institutions, and strategic culture all shape burden-sharing choices, I contend that states shift burdens to the extent that institutional architecture allows. While NATO as an alliance encourages burden shifting, NATO as an organization, with its transparent accounting of allied expenditures and capabilities development, alongside opportunities for public accountability, mitigates such tendencies.
Domestic political economies and defense spending
For these reasons, a third strand of literature, highlighting the domestic origins of defense spending, leads me to my key independent variable: unemployment.
Nincic and Cusack (Reference Nincic and Cusack1979) proposed that, because defense spending can be justified on national security grounds where other types of stabilizers cannot, US governments are tempted to use defense spending for nondefense ends. I argue that in the context of transatlantic security, this sort of justification is even more important, and that it affects primarily personnel spending. Because few European states possess any defense industry at all, as Figure 1 illustrates, personnel is the only way most states can use defense spending as a stabilizer. Although personnel expenditures are difficult to adjust quickly, states do manage to do so – more quickly, in fact, than equipment expenditures, which are often tied to long-term projects.
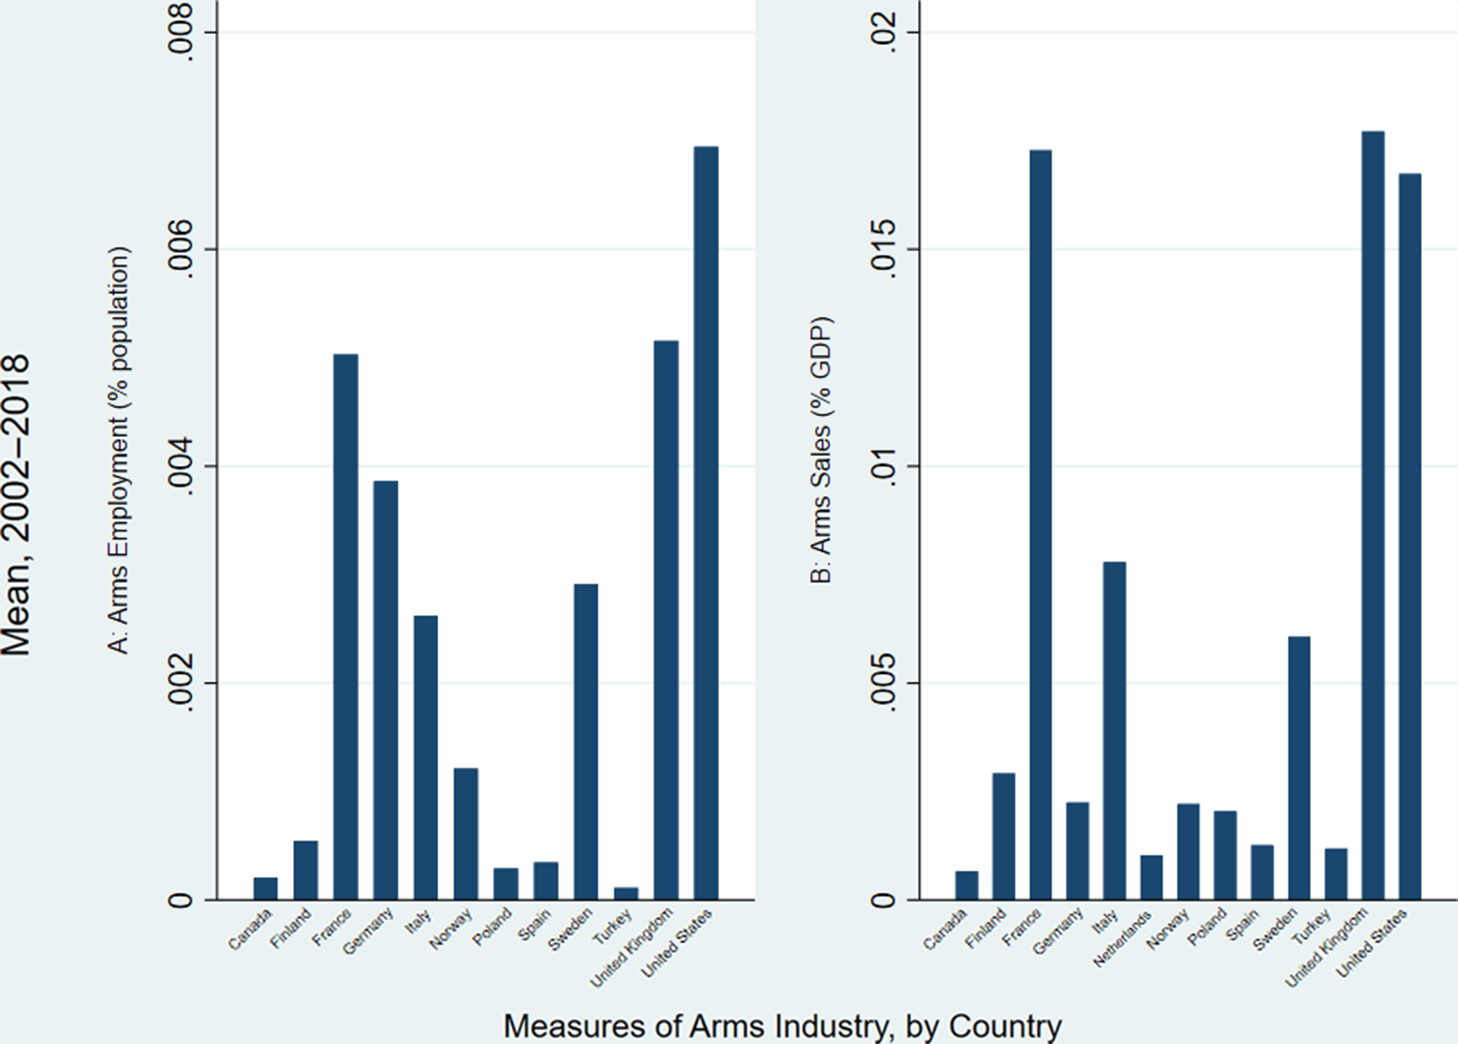
Figure 1. Unequal distribution of arms sales and employment (SIPRI, 2019).
I propose three reasons why states respond to unemployment by shifting resources out of defense, while disguising further burden shifting within their defense budgets. First, states are increasingly constrained in their use of stabilizers in domestic labor markets: the Stability and Growth Pact (SGP) constrains EU members, and the Budget Control Act constrains the US. As options narrow, shifting resources within budgets becomes more attractive. Shifting from equipment into personnel allows states to minimize appearances of burden shifting, while ensuring their national ‘guns vs. butter’ trade-offs enable them to derive private benefits from defense spending.
Second, policy-makers everywhere may reasonably believe that personnel expenditures can have direct effects on employment – this is not the case for equipment expenditures, the effects of which are indirect. European states with significant defense industriesFootnote 9 spent 50% more on equipment between 2006 and 2013 than did states without, and states with above-average domestic R&D expenditures spent 25% more on equipment than those that were below average.
Third, governments can derive other particularistic benefits from personnel spending that they cannot from equipment and other spending. Such benefits enable states to justify burden shifting on security grounds. For example, states may increase salaries or delay reductions in personnel to support domestic counterterrorism or border control. States can also use personnel in gendarmeries focused solely on internal defense, which they can defend on security grounds with both constituents and allies. All of these behaviors amount to burden shifting.
Figure 2 illustrates the bivariate correlation between unemployment and the proportion of defense budgets allocated to personnel in the full sample and in five countries with varying structural situations: in each, the correlation is substantial and consistent over time.Footnote 10 Figure 3 illustrates the same correlation for different years, starting with the full sample. Together, Figures 2 and 3 demonstrate consistent correlations between unemployment and personnel spending including outside of the 30 countries and the 14 years (2004–18) for which data on the full set of covariates are available.
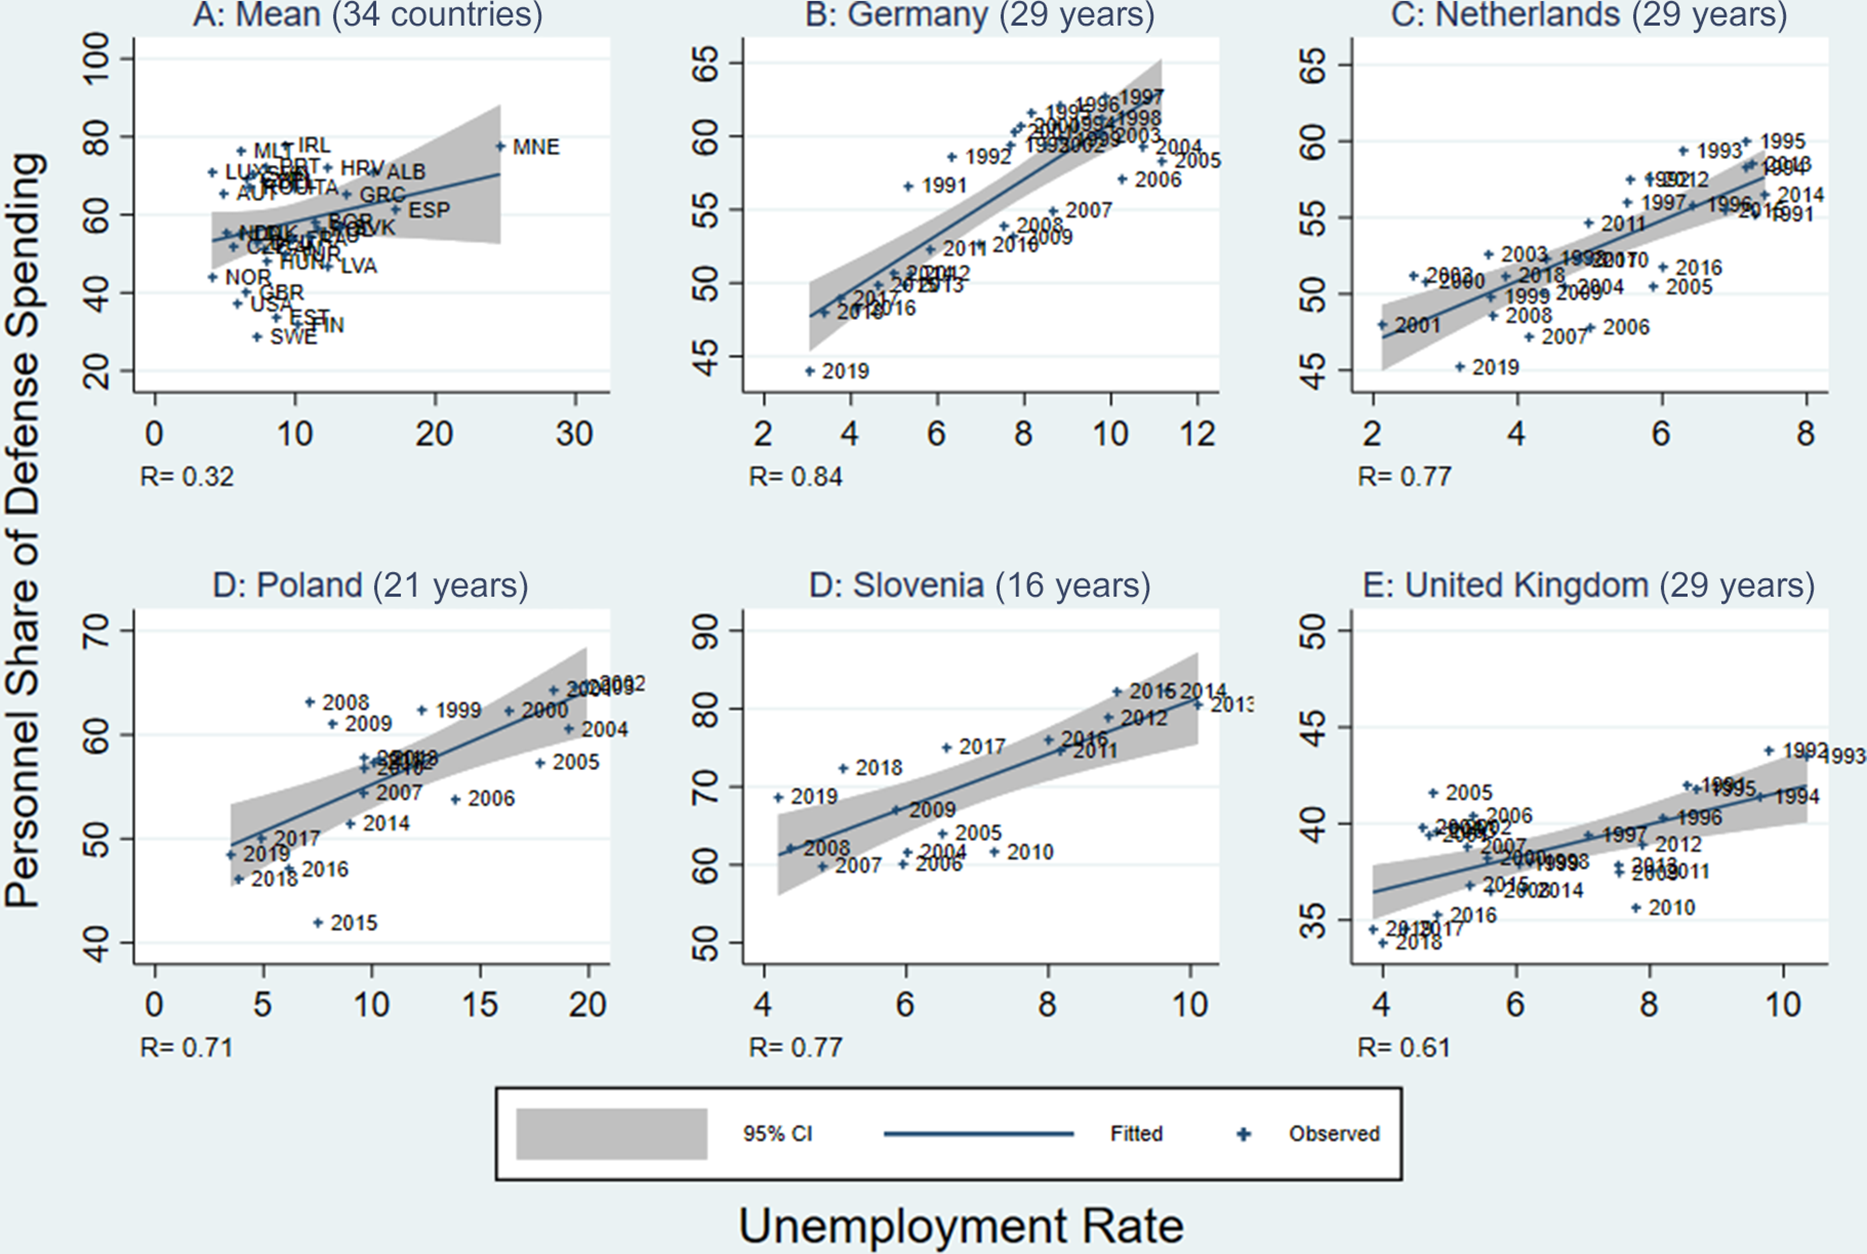
Figure 2. Unemployment and personnel spending (full sample mean, Germany, the Netherlands, Poland, Slovenia, UK).
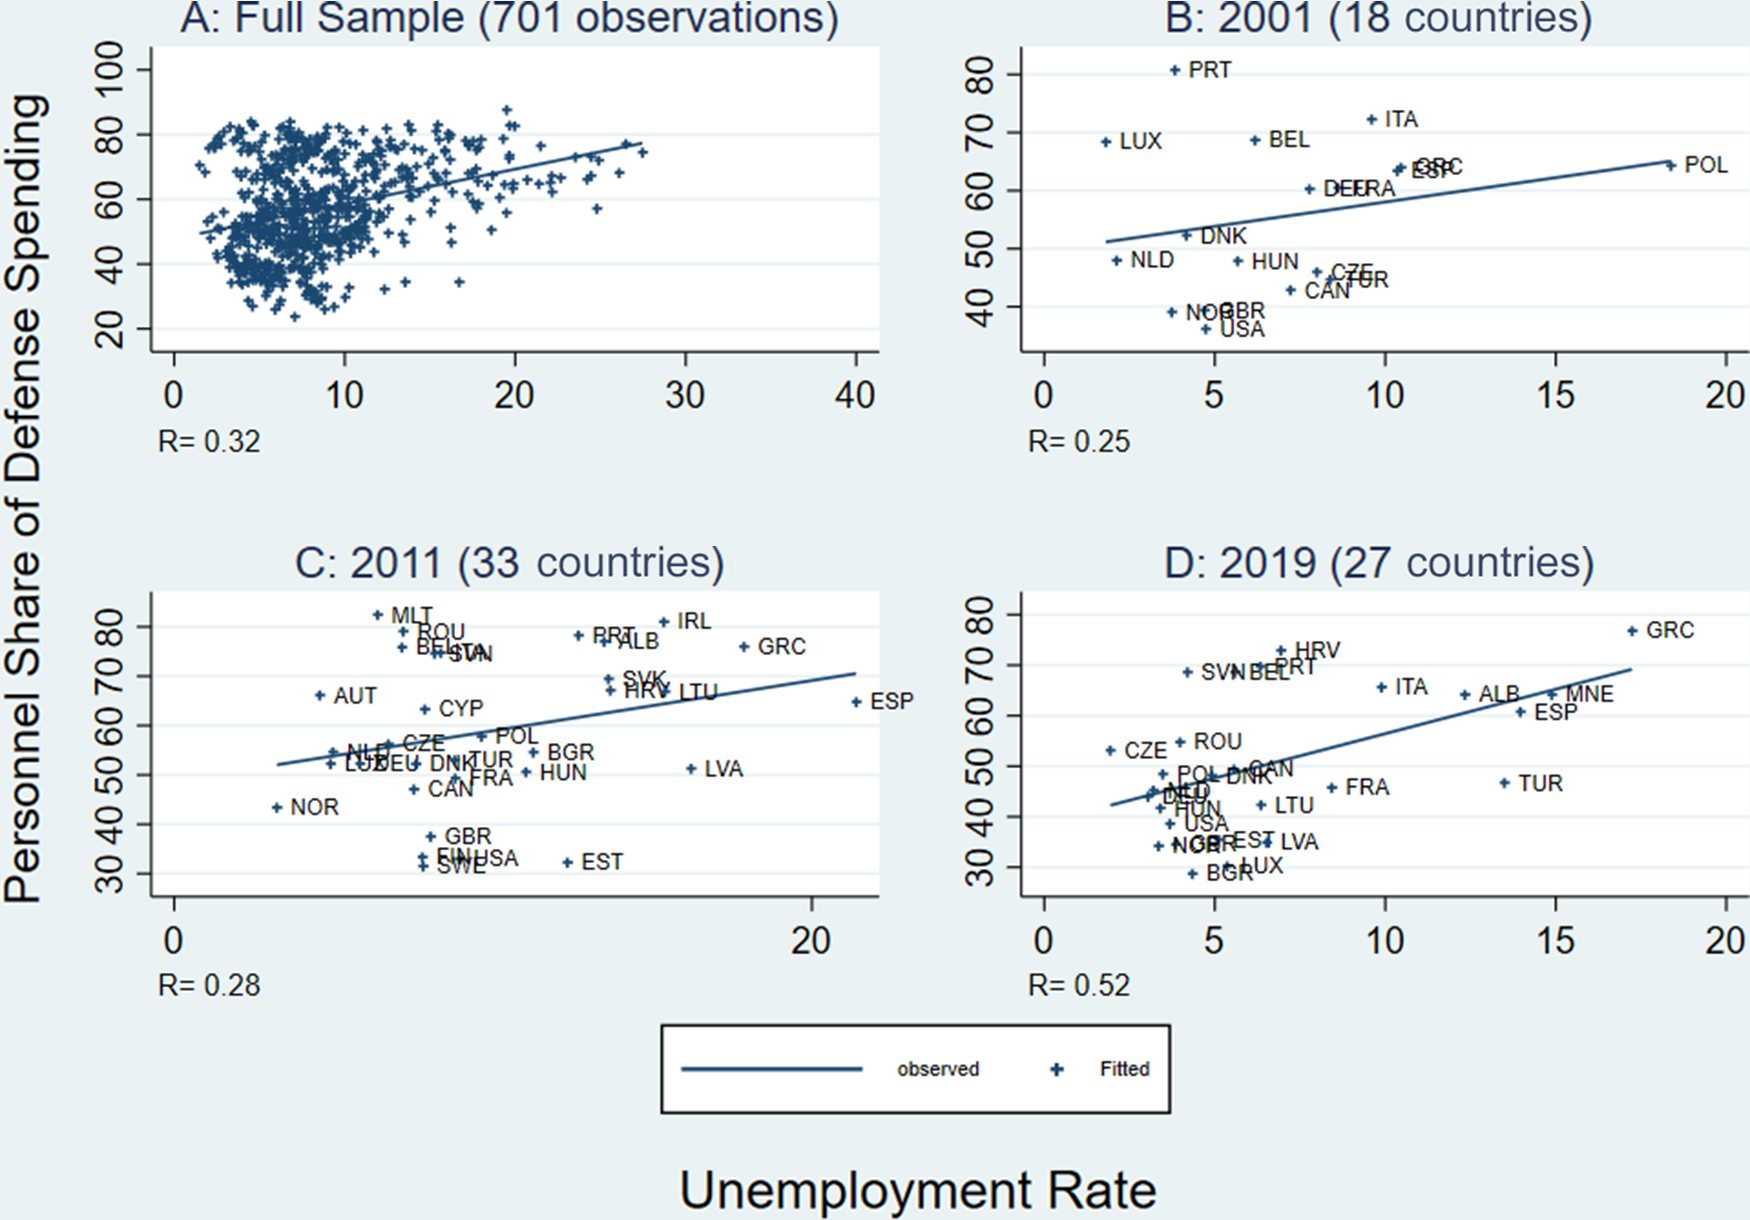
Figure 3. Unemployment and personnel spending (full sample, 2001, 2011, 2019).
The use of personnel spending as an economic stabilizer is not tantamount to adding personnel, nor does it depend on any assumptions regarding Hicks neutrality – the notion that technological developments increase the marginal productivity of labor and capital in the same proportion. The dependent variables are not measures of defense ‘outputs’, notoriously difficult to measure (Becker, Reference Becker2017), but of decisions to allocate resources. I am not estimating a production function, but state policy decisions. Many states have increased the share of personnel in their defense budgets while the size of their forces has declined. States may limit cuts to personnel and stabilize compensation, hoping to stimulate demand more directly than other defense spending. Doing so is inconsistent with increasingly capital-intensive military requirements and multilateral agreements. This phenomenon is not due to widespread policies aimed at increasing the level of technical skill in the military workforce in conjunction with improvements in military technology (Cancian and Klein, Reference Cancian and Klein2015; Wallace et al., Reference Wallace, Colarusso, Hall, Lyle and Walker2015). For example, two of the most technologically advanced countries in the study – the US and the UK – devoted 37% of defense spending to personnel in 2015. That same year, two of NATO’s least high-tech militaries – Albania and Bulgaria – devoted 65% and 68%, respectively.
To test my theory that unemployment leads states to shift defense burdens, I hypothesize that states shift resources out of ‘guns’ and into ‘butter’ to the extent they can, but will particularly shift defense resources into personnel spending, which generates more ‘butter’ in terms of salaries and multipliers, in the absence of defense industrial spillovers:
Hypothesis 1 : The higher the unemployment rate a state experiences in year t−1, the more of its defense budget it allocates to personnel in year t, at the expense of equipment spending in particular.
Data and measurement
I operationalize burden shifting as moving defense resources out of modernization and readiness and into personnel – shifting defense burdens without overtly free riding. This approach is consistent with academic definitions of burden sharing as ‘the distribution of costs and risks among members of a group in the process of accomplishing a goal (Cimbala and Forster, Reference Cimbala and Forster2005, 1)’.
As importantly, it is consistent with NATO’s understanding of burden sharing as ‘about spending, about contributions, about capabilities, so we speak about the three Cs, cash, contributions and capabilities (Stoltenberg, Reference Stoltenberg2018)’.
Defense economists separate a ‘payroll (personnel) effect’ from a ‘purchasing (equipment) effect (Sasaki, Reference Sasaki1963, 302)’. Only recently has there been sufficient disaggregated time-series data available for panel analysis. Expanding the analysis to include the six EU members that are not part of NATO allows for a more robust analysis than recent work on NATO.Footnote 11
Disaggregating thus enables a clearer understanding of actual burden-sharing behavior by helping scholars differentiate collective from particularistic spending. Conflating the two poses a major theoretical problem by commingling personnel spending with the equipment spending allies have pledged to one another to increase.Footnote 12
While scholars have argued that burden-sharing measures should include refugee assistance and foreign aid, using NATO and the EU’s own burden-sharing metrics ensures consistency across countries and over time, enabling systematic analysis across as many as 35 members of the transatlantic community. It also helps address the role of confounders like spillover effects and strategic choices, national wealth and population, threat, national political economies, and strategic culture.
Disaggregated defense spending represents ‘a consistent basis of comparison of the defense effort of Alliance members based on a common definition of defense expenditure (NATO, 2018)’.Footnote 13 This data is the point of reference for actual transatlantic burden-sharing discussions, the source for the most widely used defense spending data set (SIPRI, 2018), and for the most cited defense economics research (Dunne et al., Reference Dunne, Smith and Willenbockel2005). The European Defence Agency (2018) replicated NATO’s data collection methodology and presentation from 2006 to 2017. Supplementary File E discusses robustness checks using different measures for variables, as well as varying samples to ensure the results are not artifacts of varying alliance commitments, organizational memberships, data particularities, or other factors specific to groups of countries.
Because NATO and EU members face similar structural constraints, we might expect them to allocate resources similarly within defense budgets, even if their overall allocations to defense are subject to free riding, burden shifting, or even balancing. In reality, the composition of defense budgets varies widely. For example, less than 2% of Bulgarian and Slovenian defense spending in 2015 went to equipment, while Poland and Luxembourg each allocated over 30%. Cross-country variation in the share allocated to each of the other three categories is significant, ranging from 6.2% to 39.5% for O&M, 36.4% to 80.7% for personnel, and from under 0.1%to 10.1% for infrastructure. Figure 4 visualizes the composition of defense budgets for all states studied, with horizontal lines at 2% for the overall GDP target, and 0.4%, the share of overall GDP a state would dedicate to equipment were it meeting both the 2% guideline and allocating the prescribed 20% of defense spending to equipment. Note that more countries achieved the latter than the former in 2017.

Figure 4. Disaggregated defense spending.
More important is the variation within countries over time. Figure 5 illustrates this variation using two pairs of small countries with similar economic, cultural, and geostrategic situations. The wide variation in disaggregated defense spending both between and within countries over time suggests that domestic political economies affect burden-sharing behavior more than structural factors. Note that France has consistently invested more than 0.5% of GDP in equipment, and decreasing personnel expenditures brought it below the 2% guideline.
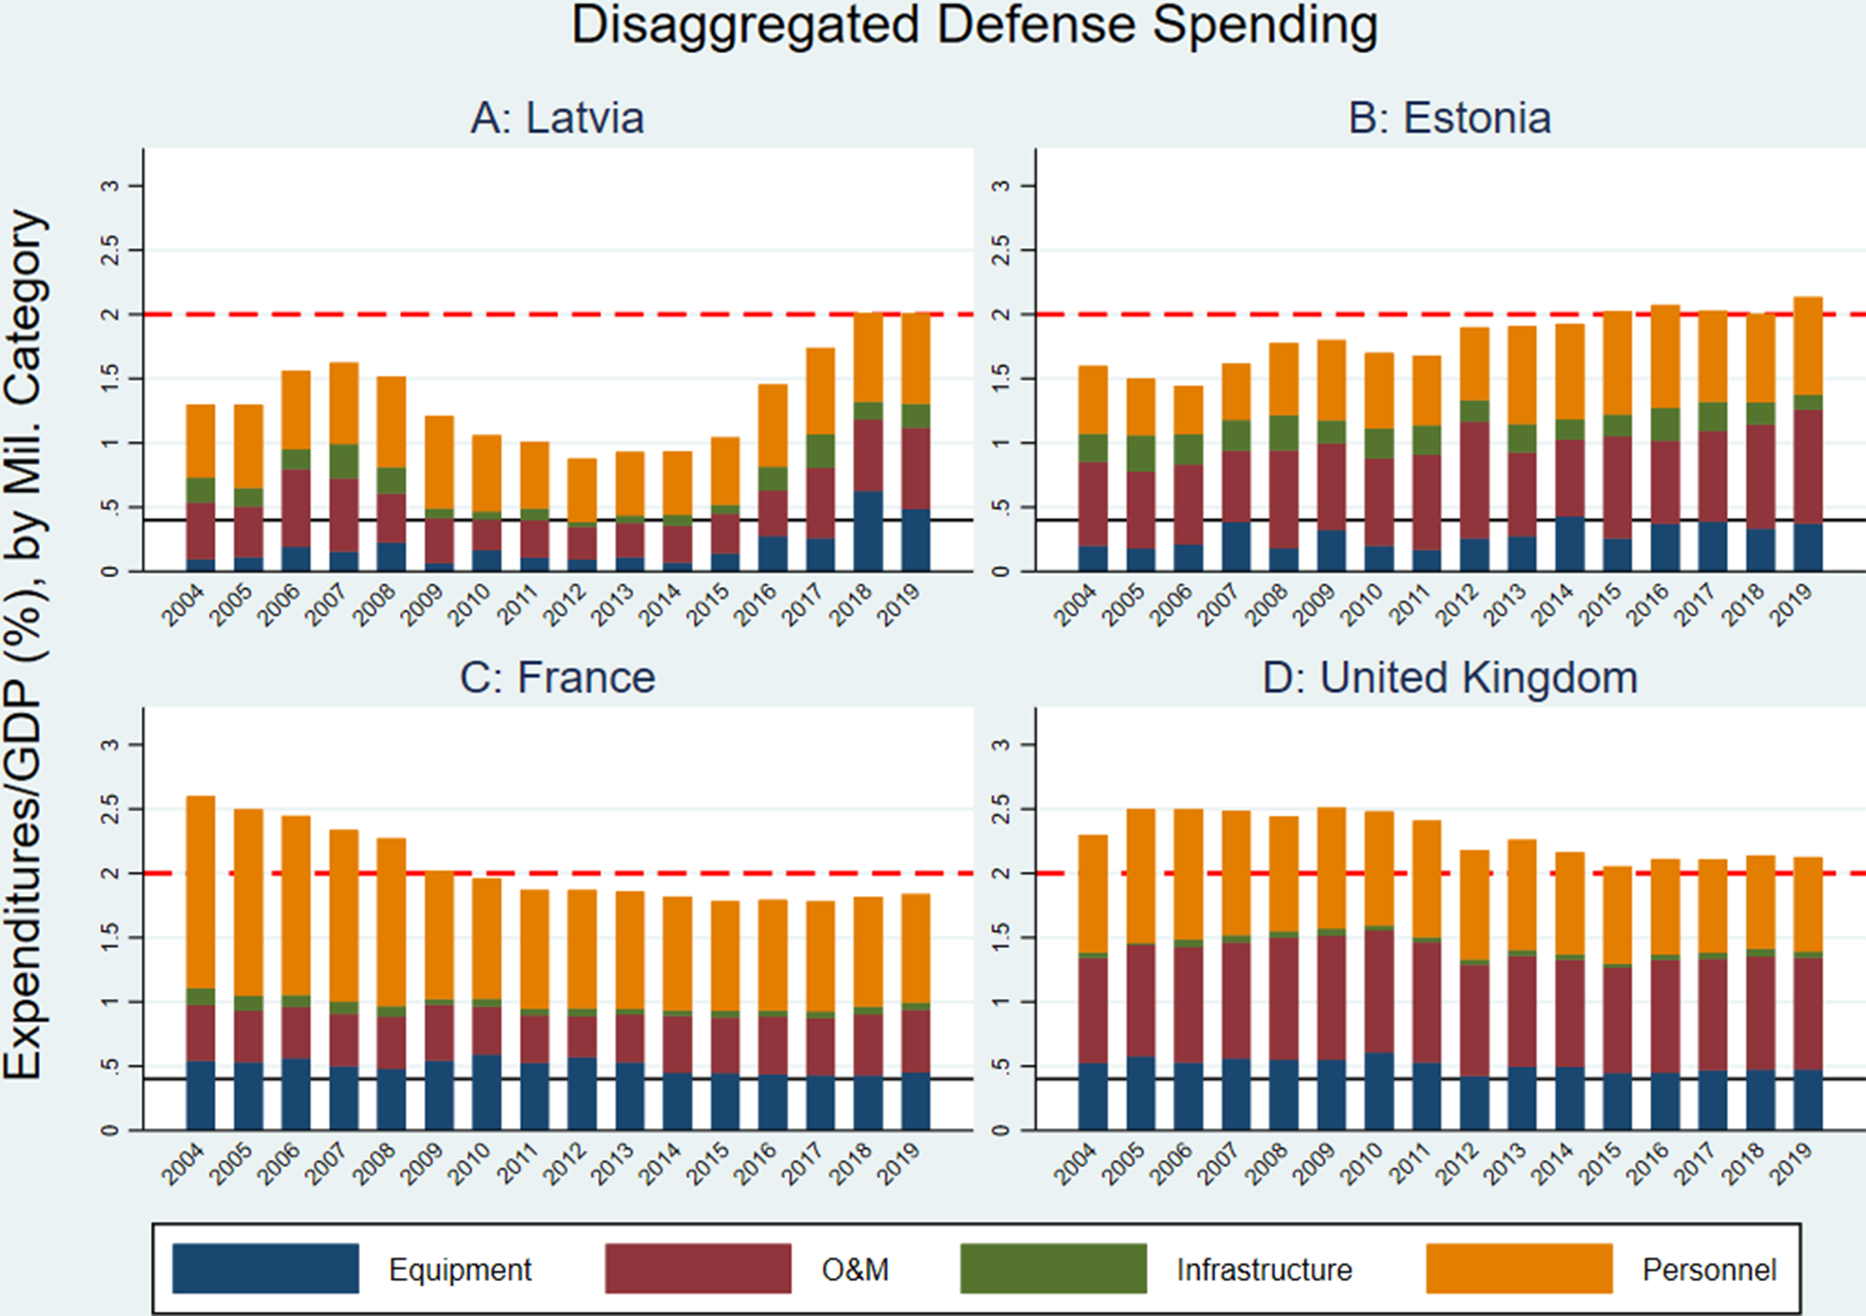
Figure 5. Disaggregated defense spending (Latvia, Estonia, France, UK).
Because most current scholarship does not disaggregate spending, it cannot explain this variation. Testing my theory that states burden shift in response to unemployment helps address this shortcoming.
Disaggregating quantitative data also helps engage directly with defense economists, who initially viewed burden sharing through a pure public goodFootnote 14 lens, but eventually moved to a joint productFootnote 15 approach, and with constructivists who advocate more interpretive approaches of foreign policy, focusing on culture and identity.
Results: unemployment and burden shifting
I begin with a theoretical model of transatlantic burden sharingFootnote 16 :
 $${{\rm{M}}_{{\rm{it}}}} = {\rm{f}}({{\rm{U}}_{{\rm{it}}}}_{ - {\rm{1}}},{\rm{GD}}{{\rm{P}}_{{\rm{it}}}}_{ - {\rm{1}}},\,{{\rm{T}}_{{\rm{it}}}}_{ - {\rm{1}}},{\rm{T}}{{\rm{E}}_{{\rm{it}}}}_{ - {\rm{1}}},\,{{\rm{I}}_{\rm{t}}}_{ - {\rm{1}}},{{\rm{V}}_{{\rm{it}}}}_{ - {\rm{1}}},{\rm{P}}{{\rm{S}}_{{\rm{it}}}}_{ - {\rm{1}}},{{\rm{A}}_{{\rm{it}}}}_{ - {\rm{1}}},{\rm{Y}}{{\rm{R}}_{{\rm{it}}}}_{ - {\rm{1}}}),$$
where M it is the share of military spending in GDP in country i during year t, expressed as a percentage (NATO, 2018). In order to test my theory, I replace M it with the shares of personnel and equipment in overall defense spending. I expect unemployment to correlate with increased personnel, and decreased equipment expenditures.
U it−1 , the key independent variable, is the unemployment rate in country i during the previous year, t−1 (World Bank, 2019). I expect states experiencing increased unemployment to burden shift by reducing overall defense spending, while shifting defense resources out of equipment modernization and into personnel. I consider the World Bank’s World Database of Indicators (WDI) unemployment data to be the best available source, as it incorporates the International Labor Organization’s ILOSTAT data, and is the most comprehensive that is available in terms of country and year coverage. The OECD gathers separate unemployment data for its members, covering fewer country years. The correlation coefficient for the 627 observations for which there is both OECD and WB/ILO data available is 0.9937, leaving me very confident in the utility of the data in my analysis.
GDP it−1 is country i’s rank within the sample in GDP in year t−1. I use rank for this variable because GDP itself is the denominator in some variations of the dependent variable, and doing so is a convention in the defense economics literature (Kim and Sandler, Reference Kim and Sandler2019). Canonical public choice theorizing (Olson and Zeckhauser, Reference Olson and Zeckhauser1966) indicates that GDP rank correlates positively with defense spending as a share of GDP. GDP rank also addresses the size, which can be a proxy for labor supply.
T it−1 is the state-centric military threat level in country i in year t−1.Footnote 17 It is the product of Russian military expenditures and the inverse distance from country i’s capital to Moscow.
TE it−1 is country i’s score on the World Governance Indicators Political Stability and Absence of Violence/Terrorism measure (Kaufmann et al., Reference Kaufmann, Kraay and Mastruzzi2011). I include this variable because political stability and vulnerability to various forms of internal and transnational political violence may also shape resource allocation.
I t−1 is the party of the government in power (Scartascini et al., Reference Scartascini, Cruz and Keefer2018).Footnote 18 Party ideology may affect how states respond to unemployment, as well as how states allocate resources and pursue foreign policy.
V it−1 is the Database of Political Institutions’ ‘checks’ score for country i in year t−1 (Scartascini et al., Reference Scartascini, Cruz and Keefer2018), a comprehensive measure of all actors with the ability to thwart policy change including independent executives, multiple legislative bodies, and number of parties in the ruling coalition. This variable addresses the effect of domestic political institutions, and executive autonomy on the transmission of macroeconomic variables to budgeting.
PS it−1 is the percentage of military personnel in the overall labor force of country i in year t−1, expressed as a percentage (World Bank, 2019). This variable captures the weight of military employment in national economies, as well as relative factor endowments and transitions from a conscript force to an all-volunteer force, which may also affect how states allocate defense resources and how macroeconomic variables’ effects transmit to defense choices.
A it−1 is the extent to which country i’s national security strategy was Atlanticist in year t−1. Becker and Malesky (Reference Becker and Malesky2017, 165) found that Atlanticism, or a preference ‘for a transatlantic approach to European security, in which the US’ role is central’, in strategic cultureFootnote 19 is a driver of operating expenditures, and noted that personnel expenditures appear to crowd out other types of expenditures.
YR it−1 is the number of years country i has been a member of NATO. This variable helps capture alliance institutionalization, and time-specific factors not otherwise addressed, such as spillover effects from other allies’ spending, and changes in overall alliance strategy that affect the publicness of allies’ spending.
To maximize variation on these variables, I constructed a panel data set of total defense spending as a percentage of GDP, as well as personnel, equipment, O&M, and infrastructure shares of defense budgets across all 35 states that are members of NATO or the EU.Footnote 20 Measuring this way is useful because it is comparable across countries and over time, and converts easily into real expenditures or shares of GDP for robustness checks.Footnote 21
Because unemployment’s effects on disaggregated defense spending are likely dynamic and accrue over time, I initially test my theory with an Error Correction Model (ECM), estimating short- and long-term effects in a single model (De Boef and Keele, Reference De Boef and Keele2008). Such models are widely used by defense economists estimating demand for and effects of aggregate defense spending (Cavatorta and Smith, Reference Cavatorta and Smith2017). ECMs regress a first-differenced dependent variable on its lagged level, and those of covariates. Their use rests on the theoretical assumption that the relationship between unemployment and personnel expenditures resembles a moving equilibrium, with personnel spending responding to 1-year changes in unemployment, but with the full effects only becoming apparent over time. This assumption is appropriate for unemployment, which is strongly predicted by previous levels, but is not static. Figure 6 visualizes this: both unemployment and personnel spending evolve gradually over time, with major shifts in unemployment (e.g. in 2008 and 2013) preceding shifts in personnel spending, which is more stable.
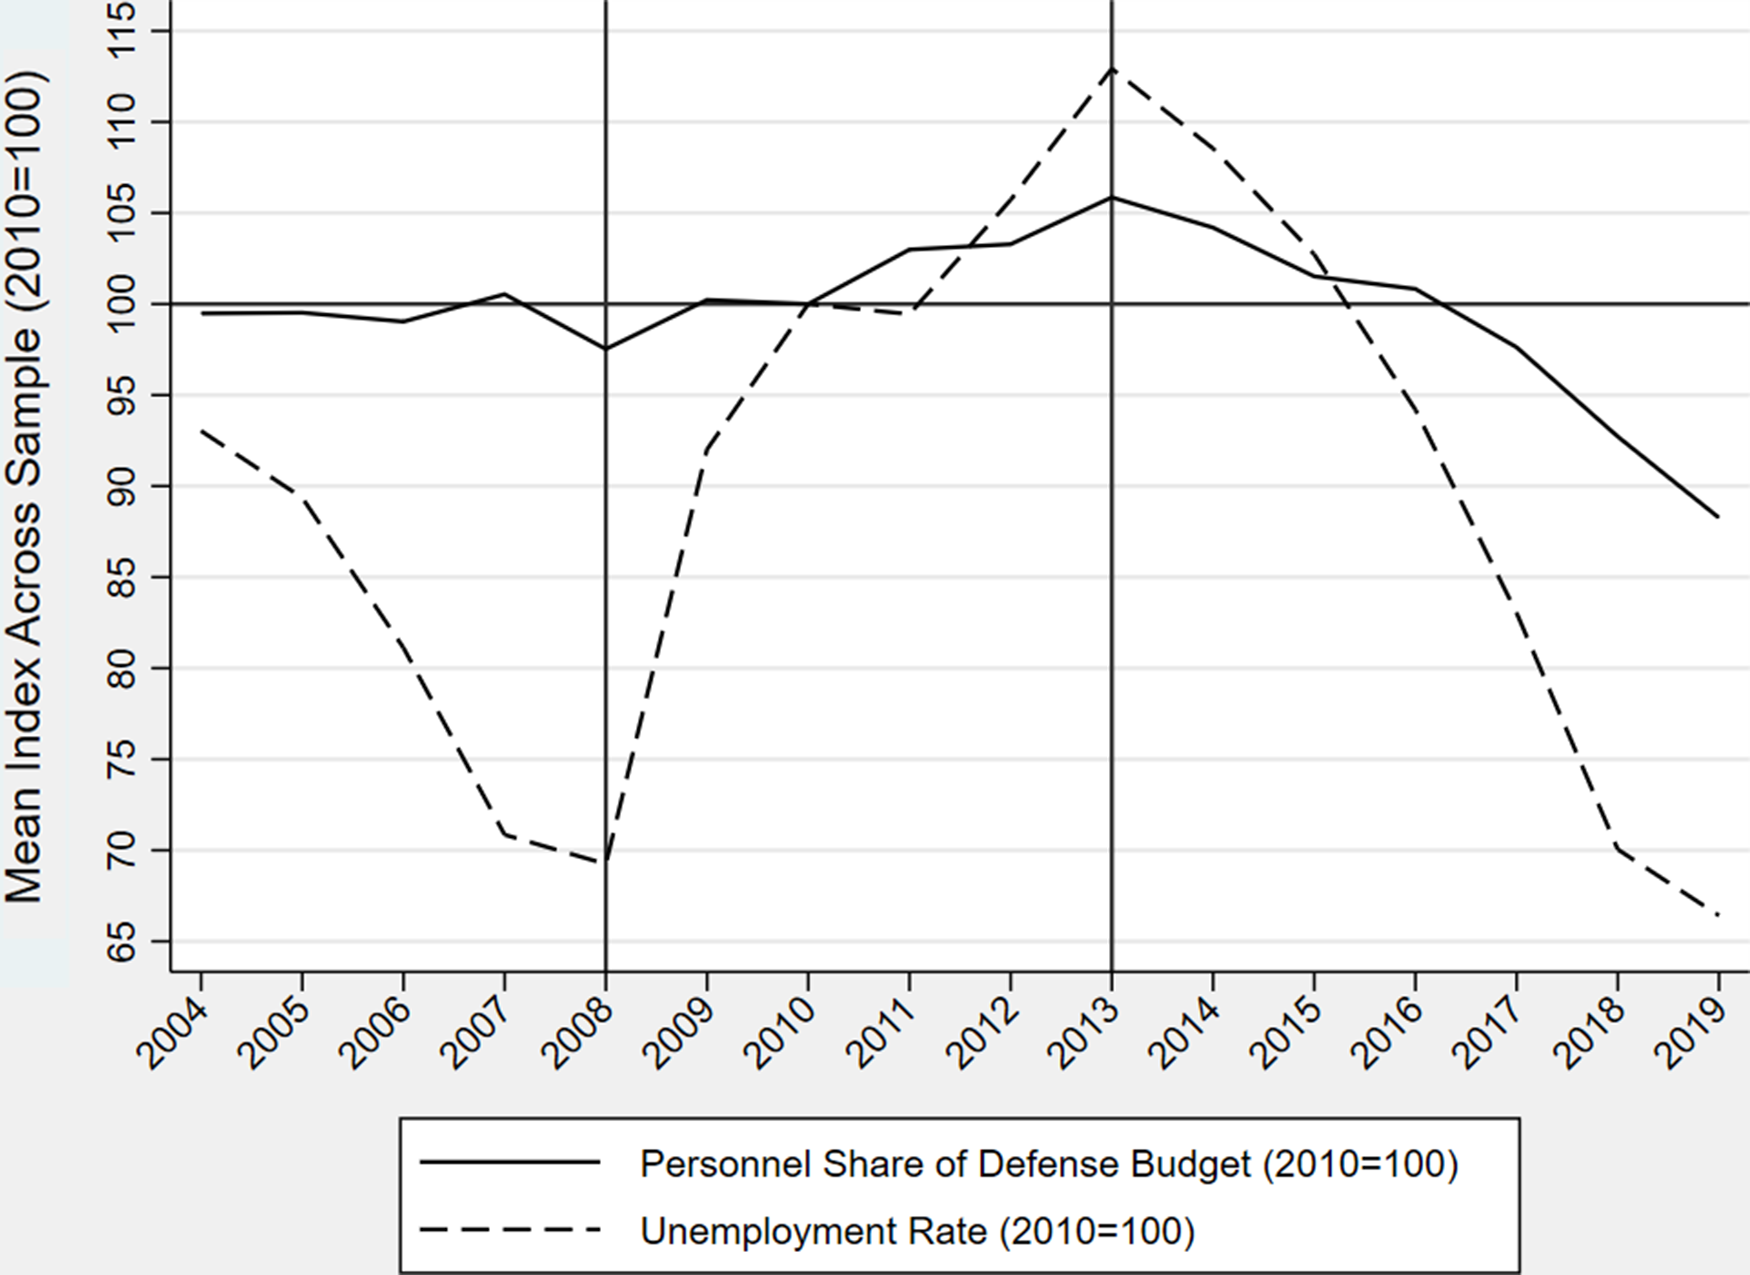
Figure 6. Mean unemployment and personnel expenditures over time.
An ECM is appropriate for stationary, non-cointegrated time-series data, and does not yield spurious inferences with highly autoregressive data (De Boef and Keele, Reference De Boef and Keele2008). Personnel spending and unemployment are stationaryFootnote 22 and not cointegrated.Footnote 23
I, therefore, estimate the following ECM:
 $$\Delta {{\rm{y}}_{{\rm{i}},{\rm{t}}}} = \alpha + {\beta _0}{{\rm{y}}_{{\rm{i}},{\rm{ t}}}}_{ - {\rm{1}}} + {\beta _{\rm{1}}}{{\rm{x}}_{{\rm{i}},{\rm{t}}}}_{ - {\rm{1}}} + {\beta _{\rm{2}}}\Delta {{\rm{x}}_{{\rm{i}},{\rm{t}}}} + {{\rm{u}}_{{\rm{i}},{\rm{t}}}},$$
where βk is yearly changes and β0 and β1 are lagged values. α i is a set of country fixed effects (FE) in each model. I estimate long-term effects by dividing the coefficient on the lagged independent variable by the inverse of the coefficient on the lagged dependent variable:
 $${{{\beta _1}{\rm{x}}} \over { - {\beta _0}{\rm{Y}}}}$$
The results are presented in Table 1.
Table 1. Correlates of disaggregated defense spending (ECM)
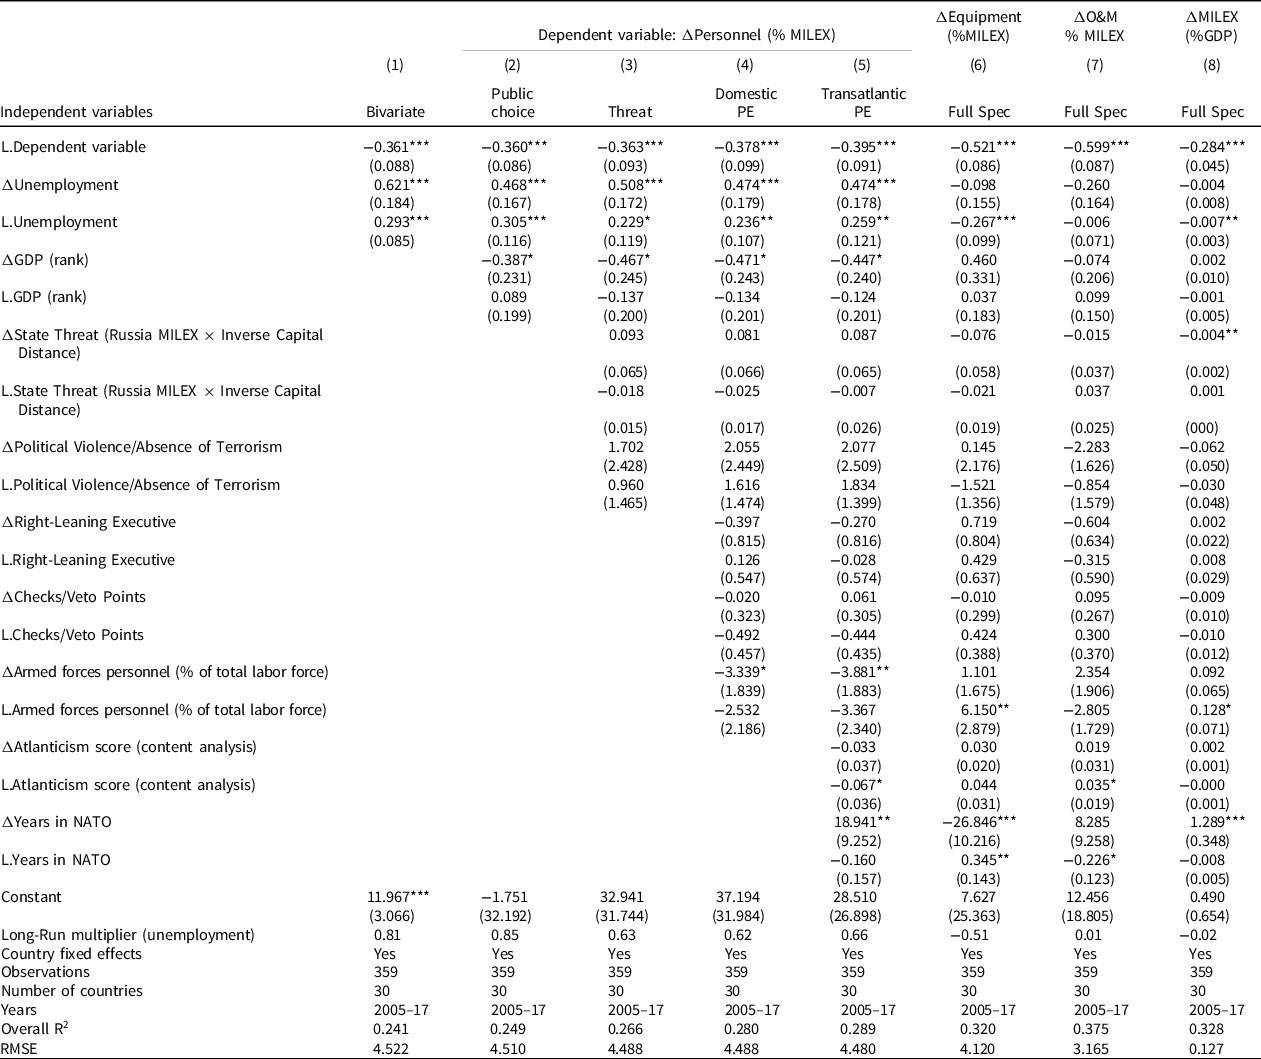
Robust standard errors in parentheses.
*P < 0.1, **P < 0.05, ***P < 0.01.
I begin with a bivariate analysis between personnel spending and unemployment, visualized in Figures 2 and 3, but using only those country years available for all covariates. I then test the strength of that relationship by adding covariates to address the theoretical confounders discussed above. Model 2 includes GDP rank in accordance with public choice theorizing. Model 3 adds a synthetic variable combining Russian defense spending in year t and country i’s capital’s distance from Moscow to address state-centric threat, and the World Bank’s Political Violence/Absence of Terrorism indicator to capture non-state threats. Model 4 adds domestic political economy variables: political ideology of the executive and institutional constraints. Model 5 adds transatlantic political economy variables: country i’s Atlanticism score in year t, and the number of years it has been in NATO. This latter variable also addresses time-trending and year-specific shocks, as well as institutional membership and neutrality, with non-NATO members of the EU taking on the value of zero. Models 6–8 replicate model 5, using equipment, O&M, and overall defense spending as dependent variables, respectively.
The key finding is that the relationship between both long-term and short-term unemployment and personnel spending is significant and positive. Both long-term and short-term relationships are robust to the addition of confounders – the coefficient remains stable and significant across all models. The substantive implications are also sizeable. The coefficient of 0.474 (significant at the 1% level) on the first difference in the fully specified model indicates that a 1 standard deviation annual change in unemployment (4.38% points) would yield a 2.08% point change in annual personnel spending. Considering that the mean annual personnel share of defense budgets is 57%, and the maximum annual change is 26.25%, this change is substantively meaningful. The long-run multiplier of 0.66 in model 5 is even more substantively meaningful.Footnote 24 Figure 7 plots the cumulative effects of a one standard deviation change in unemployment. The solid line shows that the effect of such a change in year 1 would accumulate in personnel spending, and by 16 years after a spike in unemployment in a particular country, that country would spend over 4 percentage points more of its defense budget on personnel. Similarly, the second panel in Figure 7 visualizes how unemployment affects equipment spending over time. Equipment weighs systematically less in defense budgets than personnel (15.8% as opposed to 56.7% on average), so while the numbers on the y-axis are smaller, the effects are nearly as striking, in line with the long-run multiplier of −0.51 on equipment spending in model 6. Columns 7 and 8 in Table 1 suggest that unemployment primarily affects defense budget composition, and generally comport with past theorizing on operational and overall defense spending.
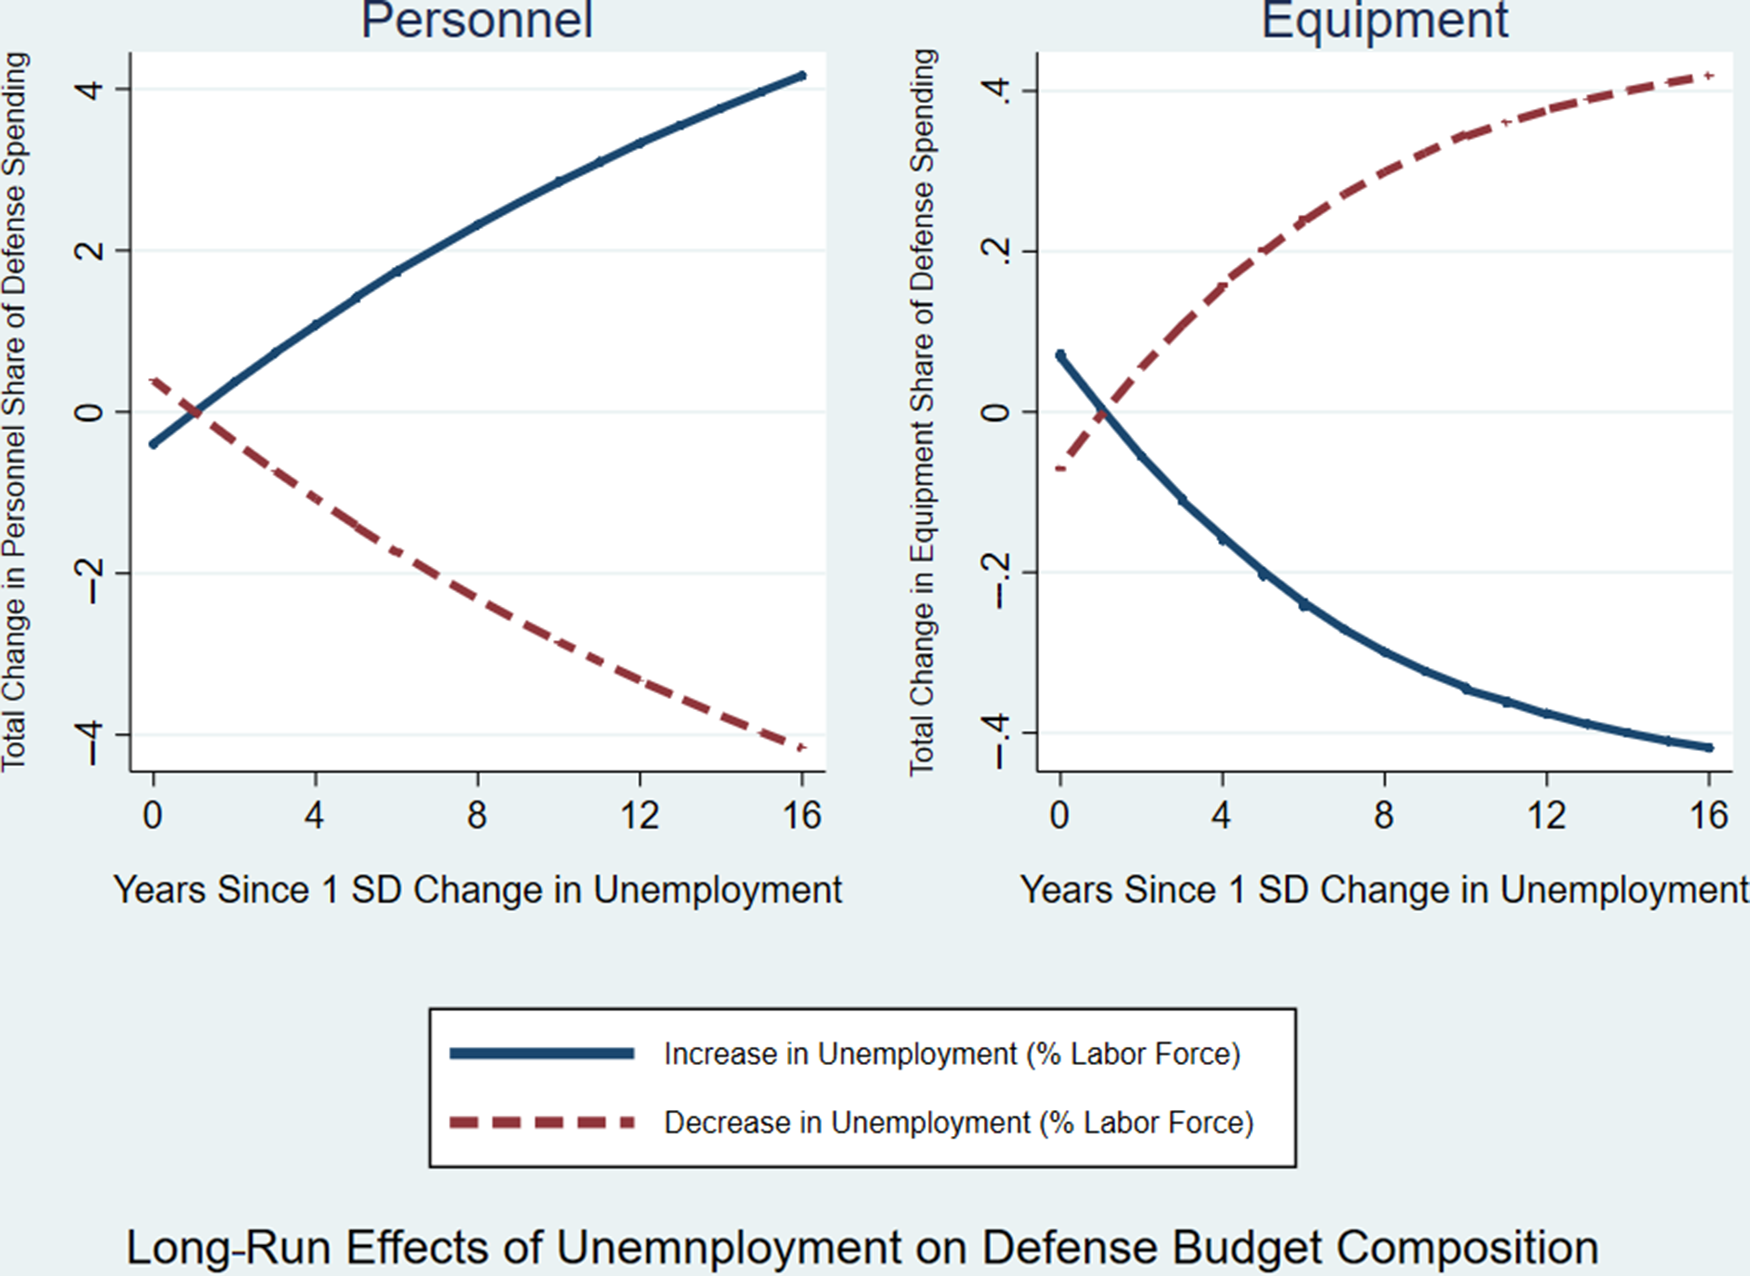
Figure 7. Long-run effects of a 1 standard deviation change in unemployment.
In sum, Table 1 and Figure 7 demonstrate a strong correlation between unemployment and defense budget composition – states facing more unemployment spend more on personnel and less on equipment. While these results are merely correlational, they are robust to multiple specifications and not spurious. The ECM mitigates concerns about underlying trends in both unemployment and defense budget composition, as does the noncorrelation in overall defense expenditures. Reverse causality is also fairly unlikely – increasing personnel expenditures are unlikely to cause unemployment directly, but the use of the weight of the armed forces in the overall labor force in models 4–8 also addresses this possibility. The relatively high R-squared in each model suggests unobserved heterogeneity and is not likely to be a major issue.
Nonetheless, Table 2 reports results from two additional modeling approaches, designed to further test the robustness of the results depicted in Table 1, and to help ascertain causality: a Prais–Winsten model using panel-corrected standard errors (PCSE) and country FE, and a two-stage least squares (2SLS) model using shocks in housing markets as an (imperfect) instrument for unemployment. I specify the PCSE models, reported in columns 1–8, as follows:
 $${Y_{i,t}} = {\beta _0} + {\beta _1}UE{M_{i,t}} + \delta {X_{i,t}} + {\alpha _i} + {\varepsilon _{i,t}}$$
where Y is the dependent variable (overall and disaggregated defense spending), UEM is the key independent variable (unemployment), X is the matrix of control variables specified above, α is the intercept for each country, and ϵ is the error term. I then specify a 2SLS model with FE (to address autocorrelation) and standard errors clustered by country (to address panel cointegration).
Table 2. Correlates of transatlantic burden shifting
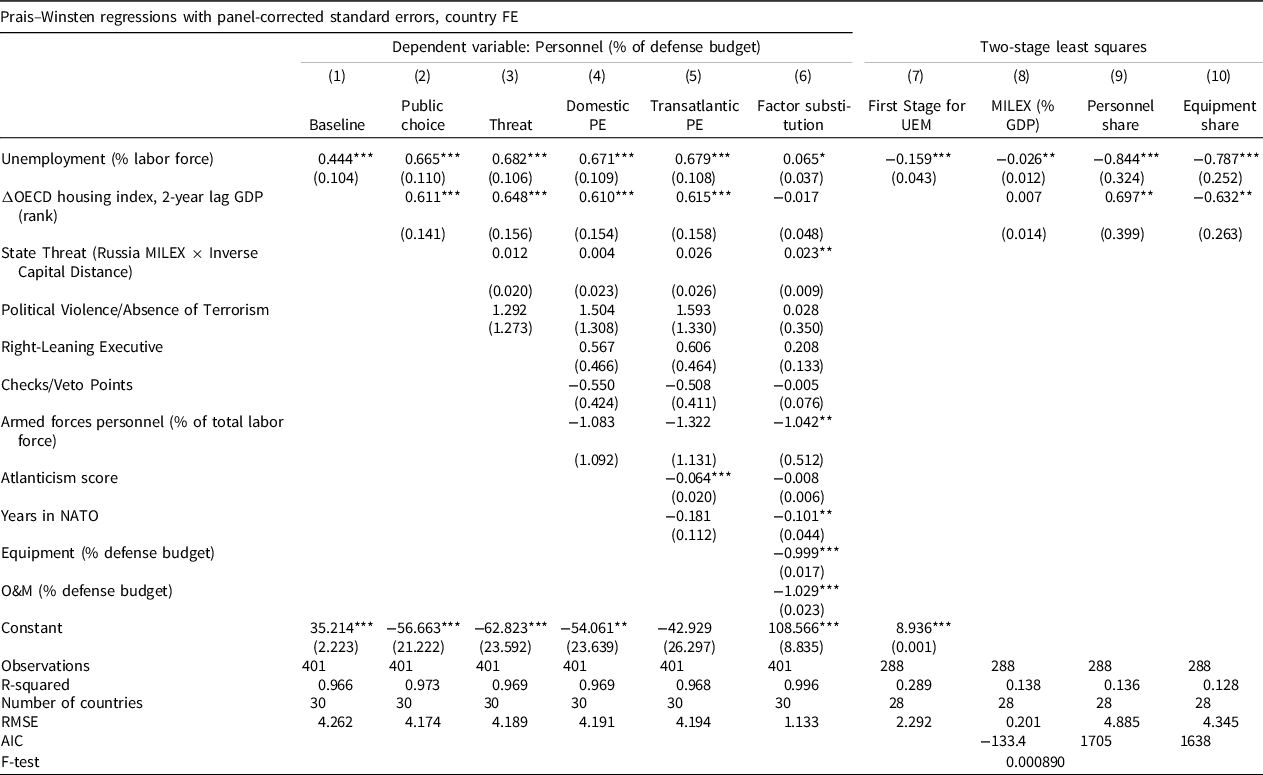
Standard errors in parentheses.
*P < 0.1, **P < 0.05, ***P < 0.01.
2SLS requires a source of exogenous variation in unemployment, which is uncommon (Layard et al., Reference Layard, Layard, Nickell, Nickell and Jackman2005), meaning that any instrument is likely to be imperfect. Even such an imperfect instrument can yield informative results in spite of relaxing the exclusion restriction (Nevo and Rosen, Reference Nevo and Rosen2010), making it useful in the context of the analysis above.
I therefore use partial or incomplete random assignment: shocks in national housing markets are a source of exogenous variation in unemployment, which in turn drives overall budgeting, which then drives defense budget composition. Housing shocks themselves have no direct effect on defense budget composition. The relationship between housing shocks and unemployment is well documented (Reinhart and Rogoff, Reference Reinhart and Rogoff2008). I find no evidence that housing shocks directly affect disaggregated defense spending – if a relationship exists, it is because unemployment transmits housing price shocks into overall and defense budget composition.
Because housing shocks are nonetheless likely an imperfect instrumental variable in this case, I include another possible pathway (GDP) in my 2SLS model. I also test if the instrument is ‘plausibly exogenous’, and ‘can yield informative results even under appreciable deviations from an exact exclusion restriction (Conley et al., Reference Conley, Hansen and Rossi2012, 261)’. When γ is set to 0.06 using the Union of Confidence Intervals method in Stata’s ‘plausexog’ module (Clarke, Reference Clarke2019), the confidence interval for the 2SLS estimate for personnel spending is [.131, 1.829], suggesting that the exclusion restriction need only be relaxed slightly in this case. The robustness of the relationship to various modeling choices accounting for serial correlation and other statistical pitfalls leaves me confident that unemployment precedes burden shifting, temporally and likely causally.
Housing price shocks are likely to affect unemployment in particular ways. For example, the prevalence of households with negative home equity may reduce labor mobility and increase structural unemployment (Crowe et al., Reference Crowe, Dell’Ariccia, Igan and Rabanal2013), and large and sudden capital reversals such as those experienced during a housing shock often lead to rising unemployment (Lane, Reference Lane2012). In the US, the 2001–09 housing bubble and bust caused employment swings of over 60% in the construction industry, 35% in some manufacturing sectors, and 40% in some trade sectors, excluding massive effects in financial and real estate industries (BLS, 2011). Governments seek to address such issues with stabilization mechanisms. For example, the American Recovery and Reinvestment Act explicitly aimed at reducing unemployment associated with housing and financial shocks. SGP restrictions make it all but impossible for EU members to act unilaterally, adding an interorganizational challenge with NATO (Hofmann, Reference Hofmann2009).
Housing price shocks might move top-line military expenditures in the same direction as employment, via changes in government revenue, for example. However, there is no reason to expect that housing price shocks would affect the share of national wealth allocated to defense or the allocation of resources within defense budgets – there is no evidence that defense ministries track housing prices or consider them when making decisions regarding the allocation of resources within budgets. Nor is there a plausible reason that they would do so. There is also no reason to believe that allocating defense resources toward personnel would affect housing markets, as personnel expenditures represent, on average, less than 1% of GDP.Footnote 25 Housing price shocks are thus a useful instrument for unemployment, allowing me to estimate the effect of unemployment on burden shifting. Because housing prices and unemployment are difficult to disentangle from the broader economic situation, and because GDP influences defense spending, GDP remains in all models. The rest of the theoretical controls are not plausibly correlated with both my instrument (housing shocks) and my dependent variable (burden shifting).Footnote 26 The first difference of the OECD index of real house prices is, therefore, my instrument for unemployment.Footnote 27
I use a 1-year lag for all of the independent variables, as policy-makers’ responses to unemployment are likely to manifest only after rates are published, and because inherent delays in the legislative and policy-making processes prevent policy-makers from responding simultaneously.
The key dependent variables, Military Burden and its disaggregated components, are discussed above and in more detail in Supplementary File D. The key independent variable remains Unemployment as a percentage of the labor force.
I argue that
 $${Y_{it}} = {\beta _0} + {\beta _1}UE{M_{it - 1}} + \delta GD{P_{it}} + {\varepsilon _{it}}$$
describes the relationship between unemployment and defense expenditures, where Y it is the overall military burden (successively replaced with each disaggregated category), UEM is the unemployment rate in a particular country, and GDP remains as a control that could be related to both unemployment and defense spending. β is the coefficient of interest throughout the analysis. In the first stage of the 2SLS analysis, I estimate
 $$UE{M_{it}} = {\lambda _{UEM}} + {\beta _{UEM}}{H_{it - 1}} + \delta GD{P_{it}} + {\upsilon _{UEMit}},$$
where UEM is the unemployment rate and H is the year-on-year change of the OECD index of housing prices. I use H as an instrument for UEM in Equation (6). Because H it is not correlated with ϵ it , I argue that this is a valid identification strategy. H is not in Equation (5) because while it correlates with the causal variable of interest (unemployment), it does not correlate with unobservable causes of unemployment excluded from the equation.
I present the results in Table 2. The main equation is Equation (5). Treating UEM it , as endogenous, I model it as
 $$UE{M_{it - 1}} = \varsigma + \beta {H_{it - 2}} + GDP{'_{it}}\delta + {\upsilon _{it}}$$
where H it is the housing instrument. The exclusion restriction is that H it , while correlated with unemployment, is not correlated with unobservable determinants of disaggregated defense spending. So I estimate Equations (5) and (6) jointly with 2SLS, using H it−2 as an instrument for UEM it−1 . I use a more parsimonious set of controls here than in the PCSE model, only controlling for GDP, which plausibly correlates with both housing shocks and personnel expenditures. I expect wealthier countries to engage in less burden shifting. GDP also addresses questions of reverse causation with the general state of economies or questions like the post-Cold War ‘Peace Dividend’. The remaining theoretical explanations are addressed by the first stage of the 2SLS because they are not plausibly correlated to shocks in residential housing markets, and therefore do not appear in this model. I use country FE in all models, clustering standard errors by country in the 2SLS models.
Columns 1 through 5 of Table 2 report the results of a progression through five PCSE models, mirroring the columns in Table 1. The coefficients are large and statistically significant in the predicted direction in each of the models – they are also stable across the models, and similar to those in the ECM. Column 6 considers the substitutability of the four components of defense spending (Bove and Cavatorta, Reference Bove and Cavatorta2012) and points in the same direction – unemployment’s relationship with personnel spending remains positive, and negative with equipment and O&M.
As in the ECM, in spite of numerous controls, omitted determinants of personnel and equipment spending that correlate with unemployment may remain. Reverse causality may also be an issue – military spending may affect unemployment. Columns 7–10 of Table 2 present the results of the 2SLS model described above to address these issues.
Column 7 presents the first stage estimate of the relationship between housing prices and unemployment: as predicted, negative housing shocks are associated with increased unemployment. A 1% decline in housing prices is associated with a 0.159% point increase in unemployment, significant at the 1% level. The F-test of the excluded instrument reported in column 7 (0.00089) also supports the theoretical notion that housing shocks have no direct effect on defense spending. Knowing that housing prices are a strong (if imperfect) instrument for unemployment allows us to examine subsequent 2SLS estimates with additional confidence of their relevance and validity.
The 2SLS estimates in columns 8–10 demonstrate the strong, likely causal relationship between unemployment in year y−1 and burden shifting in year y. The relationship remains large, positive, significant, and robust to controls for GDP rank and country FE. The coefficient of −0.026 in column 10, significant at the 5% level, suggests that unemployment also leads countries to devote a slightly smaller share of GDP to defense.
Column 9 indicates that for each 1% point increase in unemployment, personnel’s share of defense spending increases by 0.844% points, significant at the 1% level. In the case of the US that would represent nearly $300 million in 2015. Column 10 indicates nearly the precise opposite relationship between unemployment and equipment’s share of defense budgets (−0.787 points), significant at the 1% level. Together, the results in columns 8–10 confirm the hypotheses that unemployment leads countries to spend slightly less on defense, while at the same time shifting significant portions of their defense budgets out of equipment and into personnel. Unemployment causes countries to shift burdens of collective defense to their allies.
I report the Akaike’s Information Criterion (AIC) and the Bayesian Information Criterion (BIC) rather than the R-squared, which tells us little in a 2SLS. The difference between the AIC in the models of interest and the baseline model is large and negative, meaning the 2SLS model improves fit. Taken in conjunction with the high R-squared for the PCSE models, this leaves me confident that my results are consistent across models. The 2SLS addresses the risk of reverse causality and of omitted variable bias without risking collinearity. The p-value of the F-statistic of 0.00089 in column 8 attests to the strength of the instrument.
I further assess the validity of my instrumental variable approach using the standard Schaffer (Reference Schaffer2010) routine. I do so with the fully specified 2SLS model for the effect of unemployment on personnel expenditures, as this is the central 2SLS analysis. I first examine the F-test for weak identification of the excluded instrument, testing the null hypothesis that including the instruments in the model does lead to a better statistical fit (Angrist and Pischke, Reference Angrist and Pischke2008). The output of the F-test for my housing instrument is 41.83, indicating that it is a good instrument. The Kleibergen–Paap rk Wald F statistic of 41.826 is also well above the Stock and Yogo threshold of 16.38, allowing me to conclude cautiously that my instrument is not weak. Different clusters of states behaving differently with regard to the key variables of interest, as presented above, can help explain any additional potential weakness. I can also reject the null hypothesis that the model is underidentified: the p-value in an underidentification test using the Kleibergen–Paap rk LM statistic is 0.013.
Robustness and extended validity
The similarity between the PCSE and 2SLS estimates suggests this relationship is very robust. Nonetheless, I present the results of multiple additional robustness checks in Supplementary File E. These checks include year FE, varying lags, and varying periods to account for the possibility that burden-shifting behavior is subject to temporal effects. I vary samples of states and use country FE to ensure the results are not due to country-specific shocks. I use both disaggregated spending in real dollars and share of GDP, as well as absolute personnel numbers as independent variables to address concerns that the behavior is driven by other factors not related to budget composition. The robustness of this analysis to such a variety of modeling choices suggests that the relationship between unemployment and burden shifting in the allocation of resources to and within defense budgets is causal, and it addresses concerns about the timing of the effects of unemployment on defense spending.
Because of the compositional nature of disaggregated defense spending data, Supplementary Table E12 reports a replication of the main analysis using Seemingly Unrelated Regressions (SUR). Supplementary Table E15 reports an Arellano–Bond estimation to further address serial correlation.
Could these findings be generalizable beyond the transatlantic community? Disaggregated defense spending is only available for NATO and EU members. There appears to be no statistically significant relationship between unemployment and overall defense spending as a share of GDP across the 153 states (n = 3855) for which data for those two variables is available. Labor markets differ significantly across regions, but we might expect non-Western states – especially those without significant defense industries – to use personnel spending as a labor market stabilizer just as much or more than do western states. Gathering disaggregated data for non-NATO and EU members would be helpful to analysts, but it is not certain that other institutions are ready to perform the tasks that NATO and the EU perform in order to do so.
Discussion
Understanding the domestic origins of burden shifting advances theoretical debates on burden sharing to inform policy in a way that previous work focusing on structural variables cannot. It also engages with debates on the relationship between defense and social policies, and helps understand the extent to which great powers are able to exert authority in regional security complexes, which are themselves central to international order. Additionally, the precision gained by disaggregating defense expenditures helps reconcile methodological disputes over ‘form of contribution (Oma, Reference Oma2012, 566)’.
Operationalizing burden shifting as decreasing defense spending while shifting expenses within budgets away from equipment and into personnel also bridges a gap between security and defense economics research. A panel analysis of disaggregated data from as many as 35 states enables granularity that scholars have called for. In the security literature, theory-driven empirical attempts to conduct such an analysis have focused on case studies, results of which may not generalize (Bennett et al., Reference Bennett, Lepgold and Unger1994).
I have advanced and found support for a theory about the domestic origins of burden shifting. Countries experiencing unemployment spend less on defense, and at the same time shift resources away from the acquisition of capability-enhancing equipment, reorienting them toward personnel spending, which they consider a stabilizer. This behavior has substantive negative effects on transatlantic burden sharing – it is the opposite of what NATO allies agreed to do in Wales in 2014 - a set of goals that the European Council subsequently embraced, and that have been less public aspirations for many years.
Shocks in housing markets are mostly exogenous to defense budgeting processes, they result in unemployment, and governments respond to rising unemployment by shifting more of the burden of collective defense to their allies. They do so because they perceive personnel spending to have a direct effect on employment, whereas equipment investment can only have an indirect effect, if any. Governments appear to prefer this more direct route to addressing employment, even though it may damage military capability and readiness through reduced investment. They do not acknowledge doing so because they fear allies identifying them as ‘burden-shifters, intent on limiting their contribution to the collective effort (Thies, Reference Thies2015, 7)’. While few states acknowledge this behavior, it is apparent in the data. Numerous robustness checks, beyond the PCSE and 2SLS models in Table 2, leave me confident that my findings are not artifacts of common statistical pitfalls.
The relationship between unemployment and burden shifting has important implications for transatlantic security, particularly in the context of the adverse economic and labor market shock represented by the COVID-19 crisis. It affirms the strategic significance of a healthy European economy. The more members of the transatlantic community struggle with unemployment, the less likely they are to share the strategic burden of their collectively envisioned adaptation and deterrence in the face of evolving challenges. These implications may be similar for other parts of the world, but scholars would need to develop reliably accurate disaggregated defense spending data beyond members of NATO and the EU to extend the analysis beyond the transatlantic community.
Future research may benefit from examining the effects of other domestic or EU-level variables on burden sharing. Exploring the effects of EU fiscal policy on defense planning and strategy is particularly promising, as it could build on these findings to provide insights on interorganizational relations and institutional design. Such research has implications well beyond defense: the extent to which states are willing to suborn international agreements to cope with domestic challenges is important for broader questions of international collective action, burden sharing, and the international order itself. While my findings are clear about the effects of states’ perceptions of the effect of personnel spending on unemployment, I have not explored that effect itself, which is another potential avenue for future research. The disaggregation of defense spending data may also help in resolving other difficult issues in the burden-sharing debate, and can help inform detailed case studies. Doing so would reconcile opportunities presented by a move toward interpretive analysis in the burden-sharing literature with the analytical promise of quantitative analysis.
Supplementary material
To view supplementary material for this article, please visit https://doi.org/10.1017/S1755773921000102.
Acknowledgments
I am grateful to Mike Walker, Susan Carter, David Lyle, Fran Murphy, Edmund Malesky, Lee Savage, Anand Menon, Ron Smith, Malcolm Chalmers, and three anonymous reviewers, who each provided helpful feedback on this manuscript.


 Open access