


1. Introduction
The behaviour of air bubbles bursting into the atmosphere on a liquid free surface has kept the attention of researchers for decades, especially due to the fast and long liquid jets they produce (Boulton-Stone & Blake Reference Boulton-Stone and Blake1993; Spiel Reference Spiel1995; Krishnan, Hopfinger & Puthenveettil Reference Krishnan, Hopfinger and Puthenveettil2017; Deike et al. Reference Deike, Ghabache, Liger-Belair, Das, Zaleski, Popinet and Séon2018). This natural phenomenon gave explanation to the formation of sea mist, which plays an important role in the physical and chemical processes occurring on the ocean surface (Wu Reference Wu1981). Thin liquid sheets that atomise into a mist may also be induced from oscillating vapour bubbles near a free surface. These cavitation bubbles can be created by an electrical discharge (Li et al. Reference Li, Zhang, Wang, Li and Liu2019; Phan, Nguyen & Park Reference Phan, Nguyen and Park2020), or by the dielectric rupture of the liquid provoked by a high-power focused laser pulse (Gregorčič, Petkovšek & Možina Reference Gregorčič, Petkovšek and Možina2007; Chen et al. Reference Chen, Yu, Su, Chen and Chen2013; Patrascioiu et al. Reference Patrascioiu, Fernández-Pradas, Palla-Papavlu, Morenza and Serra2014; Koukouvinis et al. Reference Koukouvinis, Gavaises, Supponen and Farhat2016; Supponen et al. Reference Supponen, Obreschkow, Tinguely, Kobel, Dorsaz and Farhat2016; Jalaal et al. Reference Jalaal, Li, Klein Schaarsberg, Qin and Lohse2019; Bempedelis et al. Reference Bempedelis, Zhou, Andersson and Ventikos2021). Those studies discuss the dynamics of cavities produced at different distances below the liquid level, and also the formation of an upward liquid jet rising from the surface after the cavity collapse (Blake & Gibson Reference Blake and Gibson1987; Robinson et al. Reference Robinson, Blake, Kodama, Shima and Tomita2001; Pearson et al. Reference Pearson, Cox, Blake and Otto2004; Li et al. Reference Li, Zhang, Wang, Li and Liu2019; Saade et al. Reference Saade, Jalaal, Prosperetti and Lohse2021). In most of the existing literature on this topic, the behaviour of both the submerged cavity and the subsequent upward directed jet was classified using a single parameter, the stand-off distance  $\gamma = h/R_{max}$, defined as the ratio between the depth where the bubble is initially produced $h$ (see figure 1a) and the maximum radius achieved by the bubble during the initial expansion phase $R_{max}$ (Supponen et al. Reference Supponen, Obreschkow, Tinguely, Kobel, Dorsaz and Farhat2016). The latter definition carries with it some ambiguity issues related to the fact that, as the bubble gets closer to the liquid boundary, its deviation from a spherical shape becomes more pronounced, and thus a dilemma regarding how to measure $R_{max}$ sets in. In addition to the uncertainty introduced by the bubble deformation, the cavity centre might displace during expansion. These issues do not allow a direct comparison between results performed from different authors, considering that in many existing studies the specific method used for measuring $R_{max}$ is not even mentioned. Lauterborn et al. (Reference Lauterborn, Lechner, Koch and Mettin2018) proposed an alternative normalised stand-off distance $D^*$ given by
 \begin{equation} D^* = \frac{h}{R_{max,unbound}}, \end{equation}
where  $R_{max,unbound}$ is the maximum radius of a bubble produced under fixed initial conditions, for instance by using a defined laser pulse to generate a cavity far away from the surface, i.e. in an unbounded liquid. This definition is useful for comparing between cases of bubbles close to any kind of boundary (e.g. a solid or an elastic boundary, bubbles growing next to a crevice or non-planar objects, etc.), and in particular for cases where the gas cavity does not preserve its initial mass, such as for example when the cavity is not perfectly sealed. Further details about this discussion can be found in Appendix A.

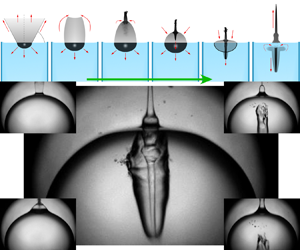
Figure 1. Experimental set-up and bubble jet shape evolution for measurements with different depths of the focused laser pulse. (a) A bubble is created in the bulk of a static liquid by focusing an infrared (IR) laser pulse at a depth  $h$ below the surface. The error in the inception depth was 10 $\mathrm {\mu }$m. (b) Jetting bubble at $h_1 =580$ $\mathrm {\mu }$m. The times of the frames are 60, 70.6, 73.8, 75.2 and 75.6 $\mathrm {\mu }$s. (c) Jet formation at $h_2$=194 $\mathrm {\mu }$m. The times of the frames are 10, 51, 66, 69 and 74 $\mathrm {\mu }$s. (d) The ‘bullet’ jet is produced at a depth $h_3 =86\ \mathrm {\mu }$m. The times of the frames are 15, 26, 38, 49 and 53 $\mathrm {\mu }$s. See online supplementary movies 1–3 available at https://doi.org/10.1017/jfm.2022.223.
The fluid mechanics following the impact of rigid objects is catalogued in the literature as the water entry problem. Duclaux et al. (Reference Duclaux, Caillé, Duez, Ybert, Boquet and Clanet2007) and Aristoff & Bush (Reference Aristoff and Bush2009) studied the water entry of small hydrophobic spheres into a liquid pool. Generally, the impact leads to a splash above the water–air interface and the formation of a deep and slender cavity in the liquid. A similar splash curtain was observed by Bergmann et al. (Reference Bergmann, van der Meer, Stijnman, Sandtke, Prosperetti and Lohse2006) after a flat disk was suddenly submerged in water. For sufficiently high impact speeds or high Weber numbers the splash curtain closes from its top and seals the cavity from the ambient air. Similarly, for impact velocities above 3 m s $^{-1}$ in water, Mansoor et al. (Reference Mansoor, Marston, Vakarelski and Thoroddsen2014) noticed that the cavity produced in the liquid by the passage of the object was partially filled with a fine spray during the closure of the splash. Recently, Eshraghi, Jung & Vlachos (Reference Eshraghi, Jung and Vlachos2020) performed detailed measurements of the splash curtain closure dynamics and compared that with an analytical model.
In this work we study the cavity and plume dynamics generated by a nanosecond laser pulse focused close to a free surface, in particular, the case of a bubble initially produced just below the liquid interface (i.e. a few tens of microns below the surface). Similar to the fluid mechanics created by an object impacting on a free surface (Kiyama et al. Reference Kiyama, Mansoor, Speirs, Tagawa and Truscott2019), laser focusing gives origin to an explosive expansion of a cavity front into the liquid and a recoil induced material expulsion (or splash) into the air (Vogel & Venugopalan Reference Vogel and Venugopalan2003; Apitz & Vogel Reference Apitz and Vogel2005; Thoroddsen et al. Reference Thoroddsen, Takehara, Etoh and Ohl2009). While typical impact velocities of objects result in cavity front velocities of tens of metres per second, and splashes rising in opposite direction with similar velocities, laser induced splashes are considerably faster. For instance, in a case of a laser pulse focused on the surface of water with a radiant exposure of  $5$ J cm $^{-2}$, the induced plasma originates a gas cavity in (and below) the liquid interface which expands at $590$ m s $^{-1}$, and also produces a splash that rises up with an average velocity of $150$ m s $^{-1}$, as reported by Apitz & Vogel (Reference Apitz and Vogel2005).
Here, we present a phenomenon which combines the two physical mechanisms described above, namely the splash dynamics and the formation of a jet from the collapse of a transient cavity created just below a standing liquid surface. This finite-length liquid jet is formed after the closure of a splash canopy, which takes the shape of an inverted cup usually referred as a water ‘bell’ (Clanet Reference Clanet2007). While one would expect a splash moving away from the surface, the initially outward splash changes direction and moves towards the liquid bulk, resulting in a jet that penetrates into the water from the top. The dynamics of a liquid splash produced by localised explosions (or even impacting objects) has already received considerable attention, nevertheless, the formation of such a downward jet has not yet been fully addressed. The resulting shape of the elongated gas cavity linked to this kind of jet resembles a bullet entering a liquid (see Bodily, Carlson & Truscott Reference Bodily, Carlson and Truscott2014; Kiyama et al. Reference Kiyama, Mansoor, Speirs, Tagawa and Truscott2019) and we have therefore termed this regime the ‘bullet jet regime’.
In general, jets developed from the collapse of a bubble are defined by their boundary conditions, for instance by the stand-off parameter and characteristics of the surrounding surfaces (e.g. geometry, hardness or elasticity) (Supponen et al. Reference Supponen, Obreschkow, Tinguely, Kobel, Dorsaz and Farhat2016; Li et al. Reference Li, Zhang, Han and Liu2017; Ma et al. Reference Ma, Huang, Zhao, Wang, Chang, Qiu, Fu and Wang2018; Gonzalez-Avila et al. Reference Gonzalez-Avila, van Blokland, Zeng and Ohl2020; Lechner et al. Reference Lechner, Lauterborn, Koch and Mettin2020). In contrast to the bubble jets discussed in the current literature, the ‘bullet’ jets presented in this work are remarkably less sensitive to the presence of neighbouring surfaces, which makes them an interesting case of study. Some unique aspects are: the relatively long distances that the liquid stream can reach, and also the amount of fluid transported in the liquid jet. Furthermore, this kind of jet could be of use in diverse applications such as bubble cleaning (Ohl et al. Reference Ohl, Arora, Dijkink, Janve and Lohse2006), or a drug delivery system that automatically directs the drug to a specific location repeatably, such as micro-vaccination or drug delivery platforms (Cu et al. Reference Cu, Bansal, Mitragotri and Fernandez Rivas2020; Oyarte Gálvez et al. Reference Oyarte Gálvez, Fraters, Offerhaus, Versluis, Hunter and Fernández Rivas2020; Robles et al. Reference Robles, Gutierrez-Herrera, Devia-Cruz, Banks, Camacho-Lopez and Aguilar2020).
2. Experimental method
In this study, we nucleate a bubble with an infrared (IR) laser pulse (Quantum Light Instruments Q2, wavelength  $1064\,$nm, energy of $(850 \pm 10)\ \mathrm {\mu }$J, 4 ns of duration) focused with a microscope objective (Zeiss LD Achroplan 20X, NA = 0.4) at a distance $h$ below the free surface of the water. The liquid was contained in an optical glass cuvette shaped as a rectangular prism with sides of 1 cm and a height of 5 cm (see figure 1a). The dimensions of the plasma spot created by the laser pulse were measured using a combination of optical filters to avoid the glowing effect and pixel saturation in the video frames, obtaining a repeatable elliptical spot with a length of $(92 \pm 2)\ \mathrm {\mu }$m in the incident direction of the laser beam and $(60 \pm 2)\ \mathrm {\mu }$m in the direction perpendicular to the beam. That plasma produced spherical bubbles with a maximum radius of $(585 \pm 5)\ \mathrm {\mu }$m when focused far away from the liquid surface (i.e. some millimetres). The position of the plasma spot geometrical centre fluctuated within an interval of 15 $\ \mathrm {\mu }$m in the direction of incidence of the beam.
The water level in the cuvette was continuously monitored and  $h$ could be adjusted with micrometric precision by modifying the relative distance between the liquid surface and the laser focusing position. When the bubble was produced a few tens of microns below the liquid surface, an accurate measurement of the plasma spot depth $h$ was not always possible, mostly due to the distortion of the image produced by the reflection (and diffraction) of rays on the inner side of the interface, and also caused by an imperfect camera alignment. Therefore, we determined $h$ with a pixel size precision from the distance between the shock wave emitted during the bubble generation and its reflection on the liquid surface (see Appendix A). When the latter was not possible, for example when the frame rate used was not fast enough to visualise the shock waves, $h$ was estimated from the geometrical centre of the plasma/initial bubble, although this alternative method is less accurate.
High-speed video recordings of the surface liquid splash produced after the laser dielectric rupture and also of the resultant bubble dynamics were taken with a Shimadzu XPV-X2 camera. The optical magnification was performed with a  $\times$5 long distance microscope objective (Edmund Optics) in combination with a macro lens (LAOWA f2.8) with a variable magnification of up to $\times$2. As the focal plane differs for objects above and below the liquid free surface, for instance the liquid curtain composing the splash and the details of the submerged gas cavity, a second high-speed camera (Photron AX-Mini 200) was used in some of the experiments. In those cases, the two cameras were set to obtain simultaneous video recordings of the same event, duplicating the magnified image by means of a 30 : 70 plate beamsplitter. As a measure to optimise the image quality, each one of the cameras were set to have a defined focus (and zoom level) in a region occupied just by one of the two media, the air or the liquid. Interestingly, this technique also allowed us to record distinct aspects of the phenomenon with different characteristic speeds, using two temporal resolutions and video lengths.
The light sources in the shadowgraphs were either given by a pulsed femtosecond laser (Ekspla FemtoLux 3, with a wavelength of  $\lambda = 515$ nm) emitting ultra-short pulses (230 fs) at a frequency of 5 MHz, or a continuous white LED lamp SMETec with 9000 lm. While the pulsed laser illumination was ideal to capture the ultra-fast dynamics of the shock waves and the liquid splash, the LED lamp was intense enough to visualise the internal structure of the jets using diffused back illumination.
3. Experimental results
It is well established in the literature that the dynamics of both the induced bubble and the subsequent jet (occurring after the cavity collapse), is strongly dependent on the nucleation distance  $h$ (Supponen et al. Reference Supponen, Obreschkow, Tinguely, Kobel, Dorsaz and Farhat2016; Li et al. Reference Li, Zhang, Wang, Li and Liu2019; Phan et al. Reference Phan, Nguyen and Park2020; Saade et al. Reference Saade, Jalaal, Prosperetti and Lohse2021). Figure 1 depicts the resulting dynamics for laser induced cavities produced at three decreasing distances (i.e. $h_1>h_2>h_3$). For the larger distance, here $h_1 = 580 \pm 10\ \mathrm {\mu }$m (i.e. $D^*_1 \simeq 1$), a concavity (with a curvature similar to the radius of the bubble) is observed on the bubble side closer to the liquid surface during the collapse. At the minimum bubble volume the concave side of the bubble hits the opposite bubble wall along a contact line similar to a ring, and a complex sequence of multiple shock waves are emitted (see last frame in figure 1b). When the nucleation distance $h$ is reduced to $h_2 = 194 \pm 10\ \mathrm {\mu }$m ( $D^*_2 = 0.33$) as in figure 1(c), a broad jet is visible within the bubble approximately 50 $\mathrm {\mu }$s after its generation (see inset). This jet penetrates the bubble along the direction normal to the liquid surface and impacts the lower side of the bubble, folding the whole cavity into a tubular shape. If the distance $h$ is progressively reduced, this is if the laser induced bubble is produced even closer to the liquid surface, the thickness of the jet piercing the gas cavity is also gradually reduced. A limit case is obtained when the laser is focused $\sim$100 $\mathrm {\mu }$m below the surface (here at $h_3 = 86 \pm 10\ \mathrm {\mu }$m; $D^*_3 = 0.15$) as shown in figure 1(d). In the figure inset a thin downward jet is clearly visible. This liquid jet penetrates the lower bubble wall with a speed of approximately $40$ m s $^{-1}$ and forms an elongated lower cavity. This cavity remains considerably more stable than in the cases with depths $h_1$ and $h_2$, and it also does not undergo a violent collapse.
Both the dynamics of the bubbles and the jets of cases similar to the ones shown in figures 1(b) and 1(c) have already been extensively discussed in the literature (e.g. Blake & Gibson Reference Blake and Gibson1987; Pearson et al. Reference Pearson, Cox, Blake and Otto2004; Koukouvinis et al. Reference Koukouvinis, Gavaises, Supponen and Farhat2016; Supponen et al. Reference Supponen, Obreschkow, Tinguely, Kobel, Dorsaz and Farhat2016; Li et al. Reference Li, Zhang, Wang, Li and Liu2019), therefore we will not discuss those cases in detail and will focus on the bullet jets instead, i.e. the one in figure 1(d). In what follows we will refer to the cases with  $h \gtrapprox h_3$ as ‘standard jets’.
Now let us study the underlying mechanisms behind the bullet jet formation. Figure 2(a) presents an image sequence taken at 72 kfps showing the complete jet dynamics, i.e. both the splash above the liquid surface and the temporal evolution of the submerged cavity. Those pictures reveal that the main difference between the bullet jet case (i.e. when the laser is focused very close to the liquid surface) and the standard cases described in figures 1(b) and 1(c) is caused by a shortly opened splash that is explosively ejecting the vapour produced from the laser plasma into the atmosphere (see Appendix B). The images also suggest that the thin downward jet observed in the bullet jet case of figure 1(d) is the result of the closure of a canopy formed during that initial splash. The canopy first takes the shape of a water bell and then collapses towards the liquid pool pushing the origin of the thin jet downwards. As the thin jet pierces the bottom of the cavity, the gas surrounding the central laminar jet is driven downwards, shaping a continuously growing cavity in the direction of the jet.

Figure 2. Overview of the resulting ‘bullet’ jet dynamics. (a) The image sequence was composed combining two different high-speed videos taken simultaneously with two cameras at 72 kfps. One of the cameras was set to focus on the splash above the water level, while the remaining one was set to focus on the submerged cavity. Here,  $D^* = 0.15$. (b) Long term bullet jet dynamics ( $D^* = 0.08$). The time between frames is 10 $\mathrm {\mu }$s. The solid blue line indicates the jet tip position extracted from the complete video. The liquid jet pierces the wall of the cavity with a speed of $35 \pm 2$ m s $^{-1}$. After $\sim$130 $\mathrm {\mu }$s, the jet slows down and dissolves at a depth of $\sim$3 mm. See online supplementary movie 4.
The later dynamics of this elongated cavity is depicted in figure 2(b). The bottom end of the cavity in the time series is connected with a solid blue line that has an initial slope of  $35$ m s $^{-1}$ and progressively slows down to a speed of $10$ m s $^{-1}$. As discussed below in § 3.5, the gas phase of the standard jets collapses shortly after the liquid jet passes through the submerged cavity, which results in a violent fragmentation of the gas phase and the ‘extinction’ of the jet. When compared with the standard jets, the elongated cavity found in the bullet jets is remarkably stable. As an example, the jet/cavity in figure 2(b) penetrates more than 3 mm deep before losing momentum, which is approximately 15 times the maximum radius of the laser induced cavity.
3.1. Details of the bullet jet formation
A closer inspection on the liquid splash behaviour above the surface reveals the precise way in which the canopy is sealed to form a water bell, and also how little liquid droplets are sprayed back into the cavity, as shown in figure 3(a) (i.e. in the frames between 8 and 26  $\mathrm {\mu }$s). These images confirm that the origin of the ‘bullet’ jets resides in the detail of the superficial splash dynamics.

Figure 3. Details of the bullet jet formation process. (a) High-speed video frame sequence composed from two equivalent measurements taken with 5 Mfps and 1 Mfps. Here,  $D^* = 0.14$. The numbers indicate the time in microseconds after the focused laser shot. Full video available in online supplementary movie 5. (b) Key moments in the bullet jet formation. The red arrows represent the motion of the liquid.
The key moments of the jet's temporal evolution are summarised in figure 3(b). Initially, the laser shot produces a fine liquid spray upwards immediately followed by a conically shaped splash curtain with a mean wall thickness of  $20 \pm 5\ \mathrm {\mu }$m (obtained from an inspection of the experimental images). As the hemispherical cavity below starts growing, the pressure of the gas in its interior is rapidly lowered. This pressure difference ( $\Delta p$) between the outside and the inside of the cone acts as the main driver of the splash, also influenced by the surface tension ( $\sigma$). Thus, the angle formed by the splash wall and the water surface ( $\theta$) is increased and the cone closes from the top forming a water bell (e.g. first row in figure 3a). Right before cavity sealing, a fine mist is sucked into the bell due to $\Delta p$ along the symmetry axis (Thoroddsen et al. Reference Thoroddsen, Takehara, Etoh and Ohl2009) at $r = 0$. Those liquid particles are followed by the formation of a thin liquid jet directed downwards, together with the vertical collapse of the water bell. As the water bell gets almost flattened the thin jet pokes the wall of the laser induced cavity and flows smoothly into the liquid pool dragging the gas around the cavity centre with it, and also driving the gas into the elongated part of the cavity by reshaping it with the jet tip.
3.2. Modelling the splash dynamics
The shape and closure of the splash can be modelled as an axisymmetric water bell following the analysis of Clanet (Reference Clanet2007) and Aristoff & Bush (Reference Aristoff and Bush2009). This formulation is derived from the Bernoulli equations for a flow in a stationary film. It takes into account the Laplace pressure from the local curvature of the film and an additional pressure difference  $\Delta p$ across the sheet. The equations in non-dimensional form are
 $$\begin{gather} \frac{{\rm d} \phi}{{\rm d} s'}=\frac{\alpha r'-\cos\phi}{We_s-r'}, \end{gather}$$
 $$\begin{gather}\frac{{\rm d} r'}{{\rm d} s'}=\sin \phi, \end{gather}$$
where  $\phi$ is the angle of the splash to the vertical (i.e. ${\rm \pi} /2 - \theta$ in figure 3b), $r'=r/R_{c}$ is the non-dimensional distance of the splash from the symmetry axis, $s'$ is the arc length along the central line of the sheet, $\alpha ={\Delta p R_{c}}/{2 \sigma }$ is the pressure coefficient and ${We_s}=\rho v_{s}^2\delta _0/(2 \sigma )$ is the Weber number of the sheet formed by a liquid with density $\rho$. The pressure difference between inside and outside the cavity is $\Delta p= p_0-p_{c}$ (i.e. the difference between the ambient pressure $p_0$ and the pressure inside the conical cavity $p_{c}$), $v_{s}$ is the speed of the splash and the average cavity radius at the surface level and sheet thickness are $R_{c}$ and $\delta _0$, respectively.
The closure of the splash may be caused by surface tension and/or the pressure difference between the outside and the inside of the splash curtain  $\Delta p$. Here, we model the pressure reduction with the expansion of the gas contained in the hemispherical shaped cavity below the splash. The dynamics of the gas within the splash is simplified to that resulting from the motion of a flat cylindrical piston moving downwards with velocity $v_{c}$, i.e. the velocity of the cavity bottom. This leads to a reduced pressure region between the modelled cylindrical cavity and the far field static pressure $p_0=1$ bar. From gas dynamics (Zel'dovich & Raizer Reference Zel'dovich and Raizer2002), the pressure at a planar piston surface $p_{c}$ is
 \begin{equation} p_{c}=p_0\left(1-\frac{\gamma-1}{2} \frac{v_{c}}{c_0}\right)^{2\gamma/(\gamma-1)}, \end{equation}
where  $\gamma$ is the ratio of specific heats and $c_0= \sqrt {\gamma \mathcal {R} T_0}$ is the speed of sound at temperature $T_0$. Now we insert this pressure term into the water bell model (Aristoff & Bush Reference Aristoff and Bush2009). First, let us investigate the shape of the splash around the time of closure, i.e. $t\approx 20\ \mathrm {\mu }$s. Then the velocity of the cavity wall has reduced to a measured $v_{c}=40$ m s $^{-1}$ and the splash velocity is approximately $v_{s}=20$ m s $^{-1}$, which can be determined by following the upward motion of the wrinkles of the liquid curtain (see figure 3(a)). The initial conditions for (3.1) and (3.2) are given by the radius of the cavity and an initial angle of $0^\circ$ to the normal. Additionally, we estimated the mean thickness of the splash in $\delta _0=20 \pm 5 \ \mathrm {\mu }$m and use as coefficient of surface tension $\sigma =0.07$ N m $^{-1}$. The remaining parameters going into the model are $\gamma =1.4$ and the liquid density $\rho =1000$ kg m $^{-3}$. The Weber number of the sheet at $t\approx 20\ \mathrm {\mu }$s is ${We_s} \approx 55$. Applying these values into the water bell model we obtain a shape that closely resembles the sheet in the experiment, see figure 4. In contrast, when the pressure difference $\Delta p$ is ignored, the simulations predict a nearly straight upward splash, as represented with dashed grey lines in figure 4(a). There, a potential closure of the splash would be only driven by surface tension, as investigated by Aristoff & Bush (Reference Aristoff and Bush2009).

Figure 4. (a) Comparison of the experimental splash of figure 3(a) at time  $t=20\ \mathrm {\mu }$s with the water bell model. The solid line accounts for a pressure drop from the piston-like expanding submerged cavity and the dashed line is the result in the absence of this pressure difference. (b) Development of the splash shape once it is closed and its velocity reduces. The splash velocities and Weber numbers of the sheet from top to bottom are $v_{s}=20, 17, 14, 11, 8$ m s $^{-1}$ and ${We_s}= 55.6, 40.1, 27.2, 16.8, 8.9$ respectively. The radial and vertical scale are non-dimensionalised with the cavity radius $R_{c}$.
In the experiment we find that, once the splash closes, the opening angle of the approximate cone shaped splash increases and eventually a downward jet forms at the apex. Using the splash model, this dynamics can be reproduced. For this we assume that once the splash has closed, the volume of the bubble remains approximately constant, i.e. while the hemispherically shaped lower part increases in volume, the volume of the conical region enclosed by the splash decreases. This assumption was verified with the computational fluid dynamics (CFD) simulations presented in figure 6 of § 3.4. As a result, the bubble pressure also remains constant. Yet, as the radial expansion of the cavity is decelerating, the upwards velocity is slowing down too. In figure 4(b) the shapes of the splash with the same parameters as in figure 4(a) are plotted for splash velocities ranging from  $v_{s}(t_0)=20$ to $v_{s}(t>t_0)=8$ m s $^{-1}$. Remarkably, the deceleration of $v_{s}$ transforms the shape of the closed splash from convex to concave, meaning that, at later times, i.e. for the lower values of the splash velocity, the liquid in the splash will be focused downwards. This may explain how the ‘bullet’ jet is injected and focused centrally into the cavity.
3.3. Numerical simulations of the jet dynamics using OpenFOAM
The water bell formation model implemented in the previous section provides an analytic interpretation of the cavity closure, and also gives a rough explanation of the origin of the water jet that produces the bullet jet. Although that simple model covers the very basics, it is insufficient to address the details of such a complex phenomenon. Accordingly, those details were studied by implementing numerical volume-of-fluid (VoF) simulations carried out using OpenFOAM-v2006 (2020). Specifically, a modified version of the numerical solver multiphaseCompressibleInterFoam suitable to simulate  $N$ compressible, viscous and non-isothermal fluids was used. For the sake of simplicity, temperature non-homogeneities are neglected in this work. The solver uses phase fractions to model interfaces between components by assigning a scalar field $\alpha _j$ to each component; $\alpha _j$ specifies the relative amount of each component in the respective cell, meaning that it assumes values ranging between 0 and 1, and $\sum _j\alpha _j=1$.
The present problem features 3 fluid components: a liquid domain (water), a gaseous domain (air) and the bubble contents, which are treated as a non-condensable gas for the lack of an implemented phase transition model. The properties of the gas inside the bubble are considered to be the same as in the gaseous domain, but computed as a separate component, to enable precise control over the amount of gas present in the bubble in its early expansion phase. The surface tension between these two gaseous components is kept at 0, making them physically the same type of gas; the distinction between them is purely computational. The surface tension between the liquid and the respective gaseous components is  $0.07$ N m $^{-1}$.
The compressibility is accounted for by the Tait equation of state
 \begin{equation} p=(p_0+B)\left(\frac{\rho}{\rho_0}\right)^\gamma-B,\end{equation}
with the values  $p_0=101325$ Pa, $\rho _0=998.2061$ kg m $^{-3}$, $\gamma =7.15$, $B=303.6$ MPa for water and $p_0=10320$ Pa, $\rho _0=0.12$ kg m $^{-3}$, $\gamma =1.33$, $B=0$ for the gas domains (i.e. atmospheric and inside the bubble), turning the equation of state into the ideal gas equation.
To counteract numerical errors that change the amount of gas within the bubble during its initial expansion, the mass of the bubble gas is kept constant by applying the correction  $\rho \rightarrow ({m_0}/{m}) \rho$ at every time step, $\rho$ being the density field of the gas component used to produce the bubble and the mass of this gas being calculated as $m=\sum _i^{cells}\alpha _{j,i}\rho _{j,i}V_i$. To account for condensation, 70 % of the bubble mass is removed when the cavity reaches its first maximum volume. For a closed bubble this gives a good approximation for the first and second bubble oscillation cycles. If the cavity opens, the gas/vapour initially inside the bubble is almost completely replaced by the atmospheric gas, meaning that the applied condensation correction is likely less accurate than for a closed bubble. Even so, the same correction is applied in all cases for the sake of consistency, although it has a negligible effect on the open cavity case. Another correction is imposed on the $\alpha _j$ fields to counteract tiny bubbles and droplets forming amidst the bulk of the fluid due to numerical errors by setting values of $\alpha _j<0.001$ and $\alpha _j>0.999$ to $\alpha _j=0$ and $\alpha _j=1$, respectively.
The computed domain describes a straight cylinder of length  $l=15$ mm and radius $r=5$ mm, which is filled to a height of 10 mm with water, the rest being filled with the gaseous component. Due to the axisymmetric nature of the present problem, the geometry is represented by a radial slice of the cylinder described above, creating an effectively two-dimensional simulation. Compared with the size of the bubble, the outer boundaries are far away and equipped with open, wave transmissive boundary conditions, representing an infinitely extended fluid domain.
The bubble is created along the axis of symmetry at a variable height and initial radius. The initial pressure is chosen to satisfy the condition  $\rho _{bubble}=\rho _{liquid}$ to resemble a plasma spot produced by a short laser pulse that has not had time to significantly expand yet, which with the fluid properties results in an initial pressure of $p\approx 16.8$ kBar. The initially spherical shape of the bubble tends to be perturbed by Rayleigh–Taylor instabilities, which are avoided by smearing the initial bubble interface. The energy of the bubble and thus its maximum radius can be modified by varying the initial bubble radius or pressure. In the experiments, this can be done by adjusting the energy of the laser pulse that produces the cavity.
3.4. Analysis of the bullet jets formation though numerical VoF simulations
The OpenFOAM simulations were set up to match the experimental conditions and then compare the dynamics of the simulated and experimental jets. Figure 5 presents an image sequence detailing the simulated bubble dynamics for a prototypical case with  $D^*= 0.155$. In general, the agreement between the simulation and the experiments (e.g. the ones in figure 2 and figure 3) is excellent. While the model is not able to reproduce the dynamics of the fine mist ejected after the plasma rapid expansion (Nykteri et al. Reference Nykteri, Koukouvinis, Gonzalez Avila, Ohl and Gavaises2020), the overall dynamics of the splash and the characteristic features of the bullet jets were captured by the model, as displayed in figure 5(a). Some of these features are: the closure of the splash/liquid curtain; the development of the elongated bubble with a central liquid jet that occurs after the piercing of the submerged cavity; and the shape of the upward jet produced after the water bell collapses towards the surface. The last frame of the sequence in figure 5(a) is represented using a VoF tracking technique to demonstrate that the liquid ‘injected’ into the liquid pool by the bullet jet is coming exclusively from the surface. This interesting feature may be relevant for certain applications, as discussed in § 3.8.

Figure 5. OpenFOAM simulation of the development of a bullet jet for a prototypical bubble with  $D^*= 0.155$. (a) Temporal evolution of the gas and liquid phases. The last frame is represented using a fluid volume tracing technique where the liquid has initially different colour at different depths (i.e. a Lagrangian ink map). The numbers indicate the time in $\mathrm {\mu }$s. (b) Comparison between the simulated results and an experimental case with similar parameters (i.e. $D^*$ and $R_{c}$). After the jet pierces the submerged cavity wall the simulated jet advances faster (approximately 25 %) than the experimental jet. Then, the matched frames in the sequence have an increasing temporal shift.
Figure 5(b) present a qualitative comparison between the simulated results and an experimental case with similar parameters (i.e.  $D^*$ and $R_{cm}$). The evolution of both the experimental and the simulated submerged cavities is similar until the jet pierces the submerged cavity wall. After that, the times of the experimental and simulated matching frames in figure 5(b) have an increasing shift. The simulated jet advances into the pool faster, differing from the experiment by 10 % at the beginning and ending the image sequence with a speed difference of approximately 25 %. This can be explained by the difference in the thickness and shape found on the simulated and experimental downward jets. A flat tip has a drag coefficient larger than one, for example, with a sharp conical or spherical tip (Bodily et al. Reference Bodily, Carlson and Truscott2014), and will also lose more energy during the cavity piercing. The jet tip is mostly defined by the specific way that the liquid converges to the centre of the water bell during the splash closure. As seen in figures 2(a) and 3, the initial part of the sealing of the water curtain might not be perfectly symmetric in some cases. Then, the jet tip might be thicker than in the numerical simulations and non-symmetrical at the moment when it pierces the bubble. Once the jet penetrates into the liquid pool it self-stabilises and a smooth front is observed in both the experiments and the simulations.
In the same way as we did for the analytical model of § 3.2, the OpenFOAM model was used to study the effect of surface tension ( $\sigma$) and gravity on the development of the bullet jets. This confirmed that $\sigma$ has a small impact on the water bell dynamics but plays an important role in stabilising the shape of the elongated gas cavity (i.e. prevent fragmentation) once it is flowing into the pool. Gravity has a small impact on the bullet jet in the range of bubble sizes investigated in this study (as shown in § 3.7), but according to the simulations its influence grows with increasing bubble size.
The numerical simulations also gave an insight into critical aspects involved in the jet formation that were not visible in the experimental trials, such as the pressure, velocity and vorticity fields around the cavity. Those are depicted in figure 6 for both gas and liquid phases. In figure 6(a) it is possible to see how the water vapour produced by the laser plasma (here modelled as a compressed gas) is explosively vented into the atmosphere, but as the submerged cavity grows rapidly, the pressure inside it suffers a dramatic drop and atmospheric air is driven into the cavity, replacing the water vapour originally in it. By the time the liquid curtain is sealed (here at  $\sim$28 $\mathrm {\mu }$s), a stagnation point is developed at its axis, where the radial and downward motion of the liquid splash converges. As shown in the last column of figure 6(a), the higher pressure at the stagnation point gives origin to the downward liquid jet which causes the bullet jets. At this instant, the submerged part of the cavity is still expanding, maintaining the pressure inside the trapped gas below the atmospheric, and at the same time provoking the collapse of the water bell. The CFD simulations make clear how the evolution of stagnation point and the water bell are directly linked to the expansion of the submerged cavity. It is important to remark that the previous mechanism of generation of the downward jet is not exclusive of the open splash case associated with the bullet jets. This means that once the canopy is closed and the water bell is formed, the downward jet observed on both vented and closed cavities originates in a similar way (i.e. from an stagnation point). That has been observed also in standard jetting bubbles (Blake & Gibson Reference Blake and Gibson1987; Robinson et al. Reference Robinson, Blake, Kodama, Shima and Tomita2001; Pearson et al. Reference Pearson, Cox, Blake and Otto2004; Koukouvinis et al. Reference Koukouvinis, Gavaises, Supponen and Farhat2016; Phan et al. Reference Phan, Nguyen and Park2020; Saade et al. Reference Saade, Jalaal, Prosperetti and Lohse2021), such as the case described in figure 1(c) and also shown in figure 12(e) included in Appendix B.

Figure 6. Details of the physical mechanisms involved in the bullet jet formation. The numerical simulations represent the pressure and vorticity fields of both phases (gas and liquid) along with the flow streamlines. The numbers indicate the time in microseconds. The frames composing the image sequence were divided in two halves. The half on the left always shows pressure amplitude. The right side shows the gas exchange between the original bubble and the atmosphere in (a), and the vorticity field in (b). See online supplementary movie 6.
The cavity evolution after the jet impingement can be followed from the image sequence of figure 6(b). The thin downward jet, driven by the stagnation pressure on its base, grows through the gas pocket and pierces the lower side of the cavity without losing its shape. When the jet impacts the bottom of the cavity, there is a transfer of impulse (via added mass) which removes part of the jet momentum and imparts a velocity to the cavity bottom. In the bullet jet case, the transfer of momentum is clearly less than for standard jets, where it is common to observe shock waves emitted when the piercing occurs. From that moment on, the liquid column starts driving the surrounding gas as it grows into the pool. This happens mainly because the jet tip pushes a section of the cavity wall downwards turning it into an increasingly elongated shape, but also due to the drag produced the liquid flow along the cavity axis. This, along with the action of the stagnation point on the neighbouring liquid, promotes the apparition of a vortex ring on the upper part, i.e. where the cavity folds, acquiring a toroidal shape. According to the numerical simulation, there are regions with a strong vorticity both inside the gas phase cavity and also close to the interface. The transport of liquid from the surface to deeper regions ceases when the water bell completes its collapse (at approximately  $\sim$100 $\mathrm {\mu }$s). At that moment, the stagnation point in the jet's base disappears. As a consequence of this collapse, the upward jet becomes significantly thicker and the elongated cavity flows downwards along with the bullet jet.
As discussed in the previous section, the model accounts for the condensation inside the elongated cavity by removing 70 % of the bubble mass when the cavity reaches its maximum volume. In the bullet jet case, the gas created by the breakdown (modelled as non-condensable air) is expelled and replaced by the ambient gas. Considering that the cavity never collapses, and thus the pressure never reaches a value far off atmospheric (as shown in figure 6b), the gas condensation has almost no effect on the bullet jet dynamics.
In summary, these simulations confirm that the main driver of bullet jets is the closure of the water splash, which in turn is provoked by a sudden pressure drop due the expansion of the submerged part of the laser induced cavity.
3.5. Critical stand-off distance for the formation of a bullet jet
One still unanswered question regarding bullet jets deals with the existence of a critical stand-off distance  $D^*$ at which this particular type of jet occurs. However, to shed some light on that question we first need to precisely define what a bullet jet is and what a standard jet is. To make such a classification of the jet's behaviour we will use four reference cases, namely the three cases introduced in figure 1 plus a case where no jet is observed. As the change in the rather complex evolution of the jets with $D^*$ takes place gradually, we will also identify the intervals where the transition from one regime to another happens. Figure 7 presents a parametric plot including 126 individual measurements classified according to the following criteria:
• Case of figure 1(b): this kind of standard jet occurs when $0.7\lesssim D^* \lesssim 4$. The liquid intruding the bubble does not always pierce the bubble. A fragmentation of the cavity is observed at collapse.
• Transition between cases of figure 1(b) and figure 1(c): for
$D^* \sim 0.7$ the situation is similar to the one in figure 1(b), but this time a thick cylindrical jet pierces the bubble and splits it in two toroidal halves. The two parts are atomised after collapse.• Case of figure 1(c): observed at
$0.25\lesssim D^* \lesssim 0.7$. As the piercing jet becomes thinner it produces a cylindrical cavity after piercing the bubble. Typically, the jet reaches a depth similar to the bubble radius before the gas phase collapses and breaks.• Transition between the case of figure 1(c) and the bullet jet case: around
$D^* \sim 0.25$, the piercing liquid jet is thin enough to pass through the hemispherical cavity and fold it into the elongated shape typically found in the bullet jets. However, the cavity tip detaches from its upper part before the folding is complete. Even when the jet tip reaches depths higher than 3 times $R_{cm}$, the structure breaks and dissolves.• Bullet jet case: the bullet jets were observed for stand-off distances in the range
$0.075\lesssim D^* \lesssim 0.25$. The folding produced by the central jet happens in a smooth way (see figure 6). The displacement of a section of the cavity drives the gas into its the elongated part. The jet tail can detach like in the transition case or not, the difference between the two is that the bullet jet can travel longer distances maintaining the structure of the elongated cavity.• No jet case: here, the laser is focused in the very surface of the water (i.e.
$D^* \lesssim 0.07$) and the liquid above the plasma spot is not sufficient to produce a water curtain splash. Then, only an open cavity is observed (without a later jetting).


Figure 7. Bubble jet behaviour as a function of the stand-off distance  $D^*$. The parametric plot includes 126 individual measurements (high-speed videos) classified as one of the cases described in figure 1. The image sequences exemplify each subgroup. Those measurements have the same $D^*$ as the mean value of the subgroup they represent. The piercing of the jets presents a sustained change for cases with $D^* \lesssim 3$. The bullet jets were only observed in a narrow band ( $0.08 \lesssim D^* \lesssim 0.22$). The numbers indicate time in $\mathrm {\mu }$s. The interframe time in the upper row is 10 $\mathrm {\mu }$s. The length of the scale bar is 500 $\mathrm {\mu }$m.
The classification performed in figure 7 makes clear that the difference between the bullet jets and the standard jets is not only given by the reduced diameter of the liquid jet. On top of that, there are at least four distinctive aspects observed exclusively in the bullet jet case: (i) the splash is always open to the atmosphere (see Appendix B); (ii) the gas cavity does not collapse but it folds into an elongated cavity; (iii) due to 2 the gas cavity shape is significantly more stable (it hardly fragments) and; (iv) the liquid jet reaches distances of several times the maximum radius of the initial cavity.
The differences in the shape stability observed for the distinct cavity types can be understood by analysing the maximum pressure reached within the gas phase in each case, estimated from the numerical simulations. In the case corresponding to figure 1(b), the full collapse of the cavity occurs 1  $\mathrm {\mu }$s after the jet touches the opposite wall (see figure 7), reaching a gas pressure of approximately 23 bar. For the case in figure 1(c), the collapse is completed approximately 15 $\mathrm {\mu }$s after the jet pierces the cavity wall, reaching a lower pressure of approximately 5.5 bar. In the case of bullet jets, the maximum pressure reached during the whole lifetime of the jet is barely above the atmospheric (i.e. 1.2 bar), explaining why the cavity remains as a single piece in most of the cases.
The values for  $D^*$ shown in figure 7 are strictly valid for $h > 50\ \mathrm {\mu }$m (i.e. $D^* \lesssim 0.085$). For smaller depths (blue dots) the portion of the laser plasma spot that is actually submerged changes, and then there is a loss of accuracy. As shown in Appendix B, the cavities start to be open to the atmosphere at $h \lesssim 175\ \mathrm {\mu }$m. This value is in agreement with the VoF simulations.
3.6. Shape factor of the bullet jets
The bullet jet formation dynamics is only dependent on the interplay of the inertially driven ejection of liquid and the pressure driven closure of the splash curtain. Therefore, we expect that this type of jet can be produced for a broad range of cavity sizes. To test this idea, we produced splashes/cavities of different sizes by adjusting the energy of the laser pulses. In order to observe a bullet jet in each case, the distance where the laser light was focused had to be corrected. Here, we define  $R_{cm}$ as the mean radius of the submerged hemispherical cavity just before the downwards jet crosses the water free surface level. Figure 8 shows a comparison of the shape of cavities with radii in the range of $150\ \mathrm {\mu }{\rm m} \leq R_{cm} \leq 600\ \mathrm {\mu }{\rm m}$. The upper row of figure 8 shows the submerged cavities at $R_{c}=R_{cm}$. The images in the lower row present the same cavities in a later moment when the bullet jet is fully developed, i.e. when the transition from a toroidal to a ‘cylindrical’ cavity is complete.

Figure 8. Bullet jet shape factor. Upper row shows the submerged cavity just before the liquid jet crosses the surface level. Lower row shows the same cavities at the moment when the bullet jet is fully developed; (a)  $R_{cm}=149\ \mathrm {\mu }$m, (b) $R_{cm}=229\ \mathrm {\mu }$m, (c) $R_{cm}=316\ \mathrm {\mu }$m, (d) $R_{cm}=393\ \mathrm {\mu }$m, (e) $R_{cm}=564\ \mathrm {\mu }$m, (f) $R_{cm}=592\ \mathrm {\mu }$m. See online supplementary movie 7.
To study the jet's shape we have defined two dimensionless quantities: a shape factor given by  $l_{bj}/w_{bj}$ and a ‘volume reciprocity’ factor $V|_{R_{cm}}/V_{bj}$. Here, $l_{bj}$ and $w_{bj}$ represent the length and the equivalent diameter of a cylinder computed from the area of the elongated cavity in the recordings. Here, $V|_{R_{cm}}$ and $V_{bj}$ are the volume of the hemispherical cavity at $R_{c}=R_{cm}$ and the equivalent bullet jet cylindrical volume (i.e. gas plus liquid) computed from $l_{bj}$ and $w_{bj}$, respectively. Interestingly, both factors remain approximately constant in the measurements included in figure 8, being $l_{bj}/w_{bj}=3.5\pm 0.1$ and $V|_{R_{cm}}/V|_{l_{bj}}=0.78\pm 0.03$. Similarly, we have found a proportionality constant of $\sim$3.5 between $l_{bj}$ and $R_{cm}$, then the diameter $w_{bj}$ of the bullet jets is similar to $R_{cm}$ (at least in the studied range). These values may not hold for much bigger bubbles, where the gravity and the buoyancy forces acting on the splash and the elongated cavity might play an important role in the jet dynamics.
Regarding the jet tip velocity, we found a clear correlation between the speed at full development of the jets and the average area of the cavity (which is proportional to the jet tip section). As a rule of thumb we observed that thinner bullet jets move faster than the thick ones. This is consistent with the simulated results for bubbles/cavities of different sizes (producing jets of different thicknesses). For the measurements included in figure 8, the jet tip speed decays approximately by 40 % when comparing the smallest bubbles with the bigger ones. The discrepancy on the speed of the jet tip exists also before the jet pierces the lower part of the cavity, but in a lesser proportion. This suggests that the energy loss responsible for the tip deceleration is mostly due to the impact of the jet on the wall and the posterior drag acting on the cavity front. In the long term, the higher speeds of the smaller jets would lead to increased drag forces which make them lose their momentum much faster as well. However, an extensive statistical study, supported by a theoretical analysis, would be required to establish a robust correlation between the main parameters involved in the jet's translational dynamics.
3.7. Surface curvature effect
Due to the ‘local’ nature of the phenomenon, the bullet jets can occur in a wide range of curvatures of the liquid surface (i.e. as long as the cavity size is lower than the curvature radius of the surface). Figure 9 presents a measurement of a bullet jet produced on the top of a water meniscus sitting on a 3.6 mm glass capillary illuminated by a white LED lamp. This configuration allows us to visualise the jet's internal structure with a remarkable clarity, although the proportions of the cavity might look distorted in the region close to the capillary surface due to its curvature (Koch et al. Reference Koch, Rosselló, Lechner, Lauterborn, Eisener and Mettin2021). The video corresponding to figure 9 makes evident how the initially rough surface, observed when the liquid jet tip emerges from the cavity lower wall, disappears as the jet penetrates further in the liquid. Both the gas and liquid phases turn into a smooth and stable front probably due to the stretching of their surfaces. The initial roughness is caused by the entrance of liquid drops (from the top) which happens during the downward jet formation. This feature is not well reproduced by the numerical simulations.

Figure 9. Bullet jet internal structure. The jet was produced on the curved surface of a water meniscus sitting on the top of a (filled) glass capillary. The image sequence reveals the details of the liquid jet inside the elongated cavity. (a) The width of the six upper frames is 4.6 mm. The zoomed images have a width of 1.15 mm. In addition to the clear view of the jet interior, the formation of an upward jet arising from the splash location is shown. The numbers indicate time in  $\mathrm {\mu }$s. See online supplementary movie 8. (b) Controllability of the jet direction. (c) Bullet jet on the side of a pendant drop of $\sim$2 mm.
When a slender object enters a liquid, the shape of the gas envelope around it is defined by its tip (Bodily et al. Reference Bodily, Carlson and Truscott2014). Interestingly, the tip of the bullet jet resembles that of a flat cylinder, and therefore displaces the water accordingly. Additionally, figure 9 depicts the characteristic shape of the upward jet arising from the cavity's initial location, which occurs shortly before the jet's tail detachment from the liquid surface. The shape of the upward jet is clearly related with the spherical form observed in the downward jet tail (see first frame of the lower row in figure 9). More details about the bullet jets induced within a drop are discussed below in figure 10.

Figure 10. ‘Bullet’ jet impacting a rigid surface. The numbers in the frames represent the times (after the laser shot) in  $\mathrm {\mu }$s. (a) The water drop had a height of 1.4 mm and it was sitting on paraffin tape fixed on a glass plate. (b) Illustration of the jet flow on the target surface. (c) Simulation corresponding to the case in (a). The frames were split to show the pressure (left) and velocity (right) fields. (d) Detailed view of the pressure/flow around the region of impact of the jet. The jet hits the wall with $U\sim 23$ m s $^{-1}$ and reaches a stagnation pressure of $\sim$3.4 bar. Full videos available in online supplementary movies 9 and 10.
Another interesting feature of ‘bullet’ jets is that they always point in the direction normal to the canopy at the moment of closure. Due to the fine focusing of the laser pulse achieved in our experiment, the resultant plasma is confined to a small region (i.e. with a size of tens of micrometres). As a consequence, the canopy/water bell axis points normally to the liquid surface in the spot the laser cavity is produced. Panels (b) and (c) of figure 9 show some examples of the latter. In figure 9(b) three ‘bullet’ jets were produced by focusing the laser at different locations along the surface of the water meniscus. The image is a superposition of these three experiments which demonstrates that for a hemispherical droplet they point towards the geometrical centre. The same behaviour was observed in a case where the laser was focused on the lower side of a pendant drop, as shown in figure 9(c). This last example gives an account of the weak effect of gravity in the dynamics of these millimetric cavities.
3.8. Jet impact on a solid surface and potential applications
As discussed in the previous sections, the bullet jet's evolution is mostly defined by the ‘local’ dynamics of the splash, instead of the boundary conditions outside of the region where the laser cavitation takes place (for instance a neighbouring solid wall). This, combined with the particularly long distances that the jet can reach ( $\sim$12 times $R_{cm}$) and the total length of the liquid stream ( $\sim$3 times $R_{cm}$), make bullet jets potentially useful for certain applications, specifically, applications dealing with the cleaning of millimetric surfaces (Ohl et al. Reference Ohl, Arora, Dijkink, Janve and Lohse2006), membrane poration (Gonzalez-Avila et al. Reference Gonzalez-Avila, van Blokland, Zeng and Ohl2020) or even micro-vaccination or drug delivery platforms (Cu et al. Reference Cu, Bansal, Mitragotri and Fernandez Rivas2020; Oyarte Gálvez et al. Reference Oyarte Gálvez, Fraters, Offerhaus, Versluis, Hunter and Fernández Rivas2020; Robles et al. Reference Robles, Gutierrez-Herrera, Devia-Cruz, Banks, Camacho-Lopez and Aguilar2020). The bullet jet could be particularly useful in systems with limited access, for example one which can only be accessed by optical means.
This feature is analysed in figure 10(a). There, the bullet jet is induced at the top of a drop placed on a rigid surface covered by paraffin tape (hydrophobic). The temporal evolution of the jet speed in this case is very similar to the one observed in figure 9 until the jet tip hits the rigid wall, meaning that the jet is not aware of the wall's presence during its formation. Once the jet impacts the target (i.e. the rigid bottom), it can produce a highly localised elevated pressure for a few microseconds. Taking into account the optical distortion produced by the drop curvature on the displacement of the jet, the water column hits the surface with a speed of  $\sim$11 m s $^{-1}$ in the example of figure 10(a). At this speed, the target surface experiences a quick transient overpressure (i.e. the water hammer effect) followed by a milder pressure given by the stagnation pressure (Huang et al. Reference Huang, Li, Zhao and Liu2018). A representation of the liquid jet flow on the solid boundary is given in figure 10(b). It is worth mentioning that the impact speeds observed during these trials should be high enough to produce the piercing of a soft material or biological tissue, as discussed in Cu et al. (Reference Cu, Bansal, Mitragotri and Fernandez Rivas2020), Oyarte Gálvez et al. (Reference Oyarte Gálvez, Fraters, Offerhaus, Versluis, Hunter and Fernández Rivas2020) and Robles et al. (Reference Robles, Gutierrez-Herrera, Devia-Cruz, Banks, Camacho-Lopez and Aguilar2020).
The simulated dynamics of a bullet jet produced at the top of a drop is depicted in figure 10(c). The bullet jet's internal structure in the simulations is in excellent agreement with the experimental observations presented in figure 9. The numerical results also confirm how the jet ‘ignores’ the presence of the solid boundary downstream until it gets very close to it, as observed in figure 10(a). Once again, we found some disagreement on the speed measured from the experimental jet and that computed for the drop in figure 10. In this measurement, the thickness of the jet front is visible in the images. The jet cross-section in the experiment of figure 10(a) was around 51  $\mathrm {\mu }$m, and just half that in the simulated jet.
From an applied point of view, the impact speed of a bullet jet is much slower than the one found in typical bubble jets used in particle removal (Ohl et al. Reference Ohl, Arora, Dijkink, Janve and Lohse2006; Lauterborn et al. Reference Lauterborn, Lechner, Koch and Mettin2018). The same goes for the overpressure they produce on a surface. In spite of that, the bullet jets exhibit an extended flow duration (between 100 and 250  $\mathrm {\mu }$s) compared with the $\sim$5–10 $\ \mathrm {\mu }$s usually observed in regular jets. This relative increment on the shear flow can be relevant for surface contamination removal. While the initial water hammer pressure can effectively detach particles from the surface, the extended flow coming afterwards would drive the particles away and prevent them falling on the same spot. A detailed view of this process is shown in figure 10(d). After impact the liquid jet spreads over the surface, presenting some hydraulic jumps (e.g. at 240 $\mathrm {\mu }$s). By the end of the sequence (i.e. at ${\sim}380\ \mathrm {\mu }$s) a laminar flow is established close to the stagnation point and a vortex ring flow is formed at its vicinity.
4. Conclusions
We have reported on a laser induced liquid jetting phenomenon that is caused by the closing of a splash sheet. This particular type of cavity is open to the atmosphere and does not collapse inertially, as observed in previous reports on cavitation bubbles near a free surface. Instead, a submerged gas volume is pierced by a liquid jet. Both, the gas and the liquid jet travel away from the free surface as a unit and go considerably deeper into the pool than typically observed in jetting bubbles.
The closure of the liquid curtain that leads to the formation of a water bell was first explained using a simple model in § 3.2. Those simulations revealed that the sealing and later collapse of the water splash is provoked by a pressure difference between the cavity interior and the atmosphere. Furthermore, they showed how the surface tension has an almost negligible influence on the splash dynamics. These conclusions were confirmed by the OpenFOAM simulations presented in § 3.3. The highly detailed numerical simulations allowed us to further understand the physical mechanisms behind the bullet jet formation.
In spite of the model's failure to account for the fine ‘mist’ initially expelled from the ablated liquid surface (and later observed during the water curtain closure), the formation and later dynamics of the bullet jets were in good agreement with the experiments. One aspect to improve on the simulations would be to reproduce the asymmetric splash observed in the initial phase of water bell sealing by implementing a full three-dimensional simulation scheme. As the radial inflow is initially not perfectly symmetric, the experimental downward jets are slightly thicker than the ones computed by the model. The latter has a significant impact on the later evolution of the jet, in particular after it pierces the submerged cavity and flows into the liquid pool. The simulations also explained the origin of the two liquid jets emerging from a stagnation point at the top of the water bell immediately after the closure of the canopy. While the upward jet grows away from the liquid surface, the downward jet impinges on the submerged cavity and gives rise to the toroidal bubble that evolves into the elongated gas cavity surrounding the bullet jet. That particular liquid flow induces a vortex ring on both the gas and liquid phases on the upper part of the cavity. The simulations proved that the bullet jet is solely a consequence of the water bell's inertial collapse, and not a vorticity driven jet.
The specific conditions necessary for the generation of this kind of jet were found through a parametric study, finding bullet jets only in a range of the normalised stand-off distance  $D^*$ between 0.075 and 0.25. Additionally, the parametric analysis has shown in detail the transformation happening in the bubble evolution when $D^*$ is gradually reduced, also confirming a variation on the downward jet thickness as the main changing factor.
We found within a small range of cavity sizes an invariability of the bullet jet's shape and expect that this holds for bubbles of larger volumes too. While bigger cavities would be difficult to achieve with lasers, electric breakdowns through sparks or even explosive charges at a proper shallow depth below the free surface may be used to explore this further. Since gravity would start playing a relevant role for bubbles with a diameter of the order of a metre, the bullet jets might occur in a different range of stand-off distances or even have a slightly changed shape factor. Related to the jet size, we also observed a clear difference in the jet speeds of bubbles with distinct thicknesses. While jets produced by small splashes are much faster at the instant of the jet formation, the increased drag forces make them lose their momentum much faster as well.
The bullet jets have many interesting properties such as: (i) the possibility of controlling their direction independently of the boundary conditions close to the inception point (e.g. objects or rigid walls); (ii) the relatively ‘long’ distances that the liquid jets can travel; and (iii) the sustained flow that they can deliver to an specific region of a surface accessible only by optical means. The combination of these features could be relevant for targeted cleaning through micro-jet applications, and also for the development of a micro-injection system.
Supplementary movies
Supplementary movies are available at https://doi.org/10.1017/jfm.2022.223.
Acknowledgements
The authors thank R. Mettin for providing helpful discussion on this topic. The authors would also like to thank the reviewers for their detailed remarks and constructive criticism, which have significantly contributed to improve this manuscript.
Funding
J.M.R. acknowledges support by the A. von Humboldt Foundation (Germany) through the Georg Forster Research Fellowship. The work was supported in part by the Deutsche Forschungsgemeinschaft (DFG, German Research Foundation) under contract OH 75/4-1.
Declaration of interests
The authors report no conflict of interest.
Appendix A. Variation of the maximum cavity radius $R_{cm}$ as a function of the depth $h$.


As discussed in § 1, the presence of a boundary of any kind greatly affects the shape taken by the laser induced bubble during expansion. Due to the lack of sphericity of the gas cavity, the maximum radius reached by a bubble produced with identical initial conditions might change with the distance to the boundary ( $h$). For the case of bubbles in the vicinity of a free surface the situation is more dramatic, since the bubble not only is deformed, but also a part of its gas content is ejected into the atmosphere. In general, the maximum radius achieved by the submerged cavity matches the definition of $R_{cm}$ given in § 3.2. The strong dependence of $R_{cm}$ on $h$ makes the adimensional parameter $\gamma _{so}=h/R_{cm}$ behave nonlinearly in shallow water, or even might take multiple values in extreme cases, e.g. if $R_{cm}(h)$ changes much faster than $h$.
$h$.
The measurement of the depth  $h$ is another factor that might introduce uncertainties on the definition of a stand-off distance. The distance $h$ is usually measured from the centre of the laser plasma captured through high-speed photography. However, a precise determination of the plasma centre might be difficult for some experimental conditions due to spurious reflection (and diffraction) of the plasma light on the surrounding media, combined with the long exposure times of typical cameras (at least $1\ \mathrm {\mu }$s). Additionally, $h$ has a strong dependence on how well defined the air–water interface is in the video frames, which in turn depends on the alignment of the liquid surface and the camera, the precise liquid level and the illumination characteristics. In order to overcome those issues, we have measured $h$ from the reflection of the shock wave produced by the plasma, as shown in figure 11(a). The early interaction of the reflected shock wave with the bubble seems to have a negligible effect on the bubble expansion dynamics, especially when compared with the effect of the boundary displacement on the liquid surface. In any case, every aspect affecting the bubble dynamics should be understood as a consequence of changing the bubble inception distance, and then those are considered in the system characterisation approach using $D^*$. In the inset of figure 11(a), the laser plasma spot was photographed using a combination of optical filters, setting the lowest exposure time available in the camera ( $200$ ns) and adjusting the camera trigger to stop the image acquisition just before the vapour starts to expand.

Figure 11. Characterisation of the cavities for different depths  $h$. (a) Measurement of $h$ using the shock wave reflection on the liquid surface. The inset shows an example of the laser plasma spot next to a scale bar with $100\ \mathrm {\mu }$m. (b) Relationship between the average maximum radius of the submerged cavities $R_{cm}$, the stand-off distance $D^*$ and the adimensional parameter $\gamma _{so}=h/R_{cm}$, for different depths ( $h$). The curves summarise 126 individual measurements. The vertical dashed line indicates the minimum depth producing a close cavity.
Figure 11(b) presents a measurement of the dependence of the average  $R_{cm}$ as a function of $h$. There, the nonlinear relationship between $R_{cm}$ and $h$ becomes evident. For depths below $800\ \mathrm {\mu }$m (i.e. $D^*\sim 1.4$) the cavity radius (measured as depicted in the figure inset) matches the unbounded bubble radius. For depths between $175$ and $800\ \mathrm {\mu }$m the cavity remains closed, but as part of the gas expands above the water level (see Appendix B), the maximum radius is significantly reduced. When the cavity is generated above $h=175\ \mathrm {\mu }$m the cavity starts to be open to the atmosphere, and then $R_{cm}$ gets smaller at an accelerated pace when the laser is focused closer to the surface. For $h<50\ \mathrm {\mu }$m the size of the plasma starts playing a major role, considering that part of the laser light might be focused outside the water, producing smaller amounts of vapour and thus smaller cavities. Figure 11(b) also presents a comparison between $D^*$ and $\gamma _{so}$. These two adimensional parameters are quite similar for $h>700\ \mathrm {\mu }$m ( $D^*\sim 1.2$), but for lower values of $h$ the values of the parameters are progressively different. For depths $h\lesssim 300\ \mathrm {\mu }$m the value of $D^*$ is around two-thirds that of $\gamma _{so}$ computed at the same $h$, and half when $h\lesssim 100\ \mathrm {\mu }$m.
Appendix B. Splash dynamics for different depths $h$.

As discussed in § 3.5, one of the conditions for the formation of a bullet jet is that the cavity is produced close enough to the surface to have a splash open to the atmosphere. Figure 12 presents high-speed video recordings of the splash produced by the laser on a water meniscus at different depths. The meniscus was produced by overfilling a 3.6 mm glass capillary with the liquid. The slight curvature of the water surface has no effect on the type of splash produced. The images show how the evolution of the splashes changes significantly with  $h$. Those can be related with the dynamics of the submerged cavities presented in figure 7. The transition from a closed to an open cavity can be seen in figure 12(d). Interestingly, the water ‘dome’ of the gas pocket becomes unstable during expansion and several small liquid filaments grow from it, as previously shown by Thoroddsen et al. (Reference Thoroddsen, Takehara, Etoh and Ohl2009). In all cases, the collapse of the cavities above the liquid surface, for instance the water bell, gives rise to an upward jet (not shown in figure 12) at approximately $120\ \mathrm {\mu }$s (Saade et al. Reference Saade, Jalaal, Prosperetti and Lohse2021). For the sake of completeness, we included an image sequence of this later vertical jet in figure 13. These measurements are the same ones presented in figure 12, taken using a second camera (simultaneously) set with a lower temporal resolution and an extended temporal window. The images show how the shape of the upward jet also depends significantly on the inception depth of the cavity, as reported by Chen et al. (Reference Chen, Yu, Su, Chen and Chen2013), Li et al. (Reference Li, Zhang, Wang, Li and Liu2019) and Bempedelis et al. (Reference Bempedelis, Zhou, Andersson and Ventikos2021).

Figure 12. Splashes produced on the top of a water meniscus by a laser focused at different depths  $h$; (a) $h \simeq 0\ \mathrm {\mu }$m, (b) $h \simeq 45\ \mathrm {\mu }$m, (c) $h \simeq 91\ \mathrm {\mu }$m, (d) $h \simeq 156\ \mathrm {\mu }$m, (e) $h \simeq 221\ \mathrm {\mu }$m, (f) $h \simeq 327\ \mathrm {\mu }$m. The gas cavity is open to the atmosphere for depths lower than ${\sim} 175\ \mathrm {\mu }$m. The time between frames is $1.8\ \mathrm {\mu }$s ( $25\ \mathrm {\mu }$s total duration).


 Open access