


1. INTRODUCTION
Changes to a marine-terminating glacier's dynamic state, caused by processes such as iceberg calving, increased ice discharge and ice shelf thinning or thickening, can lead to abrupt changes in mass balance and, thus, contribution to sea level rise. Long-term acceleration may be a response to ice front retreat and increased basal melting of the ice shelf (Paolo and others, Reference Paolo, Fricker and Padman2015). Frontal retreat and thinning would reduce the buttressing that ice shelves provide to the grounded ice upstream (Dupont and Alley, Reference Dupont and Alley2005). Once a retreat of ice sheet that sitting on a bedrock that is below sea level (termed the marine-based ice sheet) begins, a feedback between retreat, increased discharge and thinning, termed the Marine Ice Sheet Instability, tends to promote a continued retreat (Weertman, Reference Weertman1974; Schoof, Reference Schoof2007).
It is important to separate the trend in acceleration from seasonal speed variations because the interannual change may be falsely detected due to the artifact of measuring the flow in different seasons. Seasonal glacier velocity variations have been observed in Antarctica and may result from different mechanisms. At the Totten Ice Shelf, the seasonal ice shelf acceleration has been reported recently and is most likely mainly related to the loss of buttressing upon the breakup of rigid sea ice at the ice front (Greene and others, Reference Greene, Young, Gwyther, Galton-Fenzi and Blankenship2018). While the seasonal speed variations at Larsen B glaciers were attributed to the surface meltwater percolation to the bed and a reduction of basal resistance (Scambos and others, Reference Scambos, Bohlander, Shuman and Skvarca2004). It has also been shown by modeling that the ice mélange forcing against the ice front can prevent crevasse propagation and shut down calving at the terminus (Krug and others, Reference Krug, Durand, Gagliardini and Weiss2015; Robel, Reference Robel2017). However this mechanism, which could explain seasonal velocity variations on many outlet glaciers in Greenland (Howat and other, Reference Howat, Box, Ahn, Herrington and McFadden2010; Cassotto and others, Reference Cassotto, Fahnestock, Amundson, Truffer and Joughin2015), has not yet been confirmed in Antarctica.
Despite having several times the volume of marine-based ice compared with that of West Antarctica (Fretwell and others, Reference Fretwell2013), East Antarctica receives less attention because of its apparent relative stability, with a near-zero or slightly positive mass balance (Shepherd and others, Reference Shepherd2012; The IMBIE team, 2018). However, recent observations reveal that nearly half of East Antarctica's ice shelves began to thin after about 2003 (Pritchard and others, Reference Pritchard2012; Rignot and others, Reference Rignot, Jacobs, Mouginot and Scheuchl2013, Reference Rignot2019; Paolo and others, Reference Paolo, Fricker and Padman2015, Reference Paolo, Fricker and Padman2016), and some East Antarctic ice shelves, particularly the small to medium ice shelves, show negative mass balances as glaciers accelerate and termini retreat (Miles and others, Reference Miles, Stokes, Vieli and Cox2013, Reference Miles, Stokes and Jamieson2016; Liu and others, Reference Liu2015).
Polar Record Glacier (PRG, 69.75°S, 75.5°E) is a relatively small outlet glacier located on the east of the Amery Ice Shelf on the southern shore of Prydz Bay. It flows between Meknattane Nunataks and Dodd Island into the central part of the Publications Ice Shelf (Cruwys and Rees, Reference Cruwys and Rees2001). In 1973, PRG was comprised of a grounded outlet glacier and an ice tongue extending over 42 km from its grounding line to the ice front. Landsat Thematic Mapper (TM) images acquired in 1989 indicate that the southern section of the ice tongue broke away from the glacier, forming an iceberg ~26 km long and 16 km wide. The area of the iceberg progressively decreased through several small break-up events until it completely disintegrated and drifted away in 2015. Meanwhile, the ice flow velocity of PRG varied seasonally during the period 1996–2008 (Zhou and others, Reference Zhou2014). However, unlike the outlet glaciers in West Antarctica or the large glaciers drain the Aurora Subglacial Basin (e.g. Totten Glacier), the physical mechanisms behind this dynamic change and possible climatic and oceanic forcings, remain unclear.
In this paper, we present a remote-sensing investigation of the dynamic changes at the PRG for the period 2005–2015. We measure and analyze spatial and temporal variations in surface melting, flow velocity and ice front position at seasonal and interannual timescales, and compare these with variability in possible environmental forcings including air and ocean temperature and sea ice concentration.
2. DATA AND METHODS
2.1. Ice velocity
We obtained all available cloud-free panchromatic-band images from the Enhanced Thematic Mapper Plus (ETM+) aboard Landsat 7 and those from the Operational Land Imager (OLI) aboard Landsat 8 acquired from 2004 to 2015 from the United States Geological Survey (USGS). We measured the velocities from repeat imagery spanning 32, 48 and 368 days. Of these, the shorter values provide a balance between having enough displacement and optical coherence of the features. The annual separations (368 days) kept the solar altitudes almost the same for each image pair. We paired only images of the same path/row to reduce terrain-induced errors. Several Sentinel-1 images were acquired from June 2016 to April 2017, and these were used as a supplement to further constrain variations in winter velocity.
Ice surface velocity was mapped from Landsat using the Multi-Image, Multi-Chip (MIMC) Repeat-Image Feature Tracking (RIFT) software (Ahn and Howat, Reference Ahn and Howat2011; Jeong and others, Reference Jeong, Howat and Ahn2017), applied to pairs of Landsat images. This method uses multi-directional matching and a priori velocity information to constrain both the search area and postprocessing, improving the quality of the displacement measurements. Errors mainly result from the coregistration and ambiguity of the matches between images. The total displacement errors are typically 1/3 of a pixel. To identify the austral winter ice surface velocity, we performed offset tracking with Sentinel-1 SAR data (Strozzi and others, Reference Strozzi, Luckman, Murray, Wegmuller and Werner2002).
2.2. Ice front position
The Landsat images were also used to map the ice front positions. The images acquired during the austral summer were chosen when sufficient coverage was available. We manually traced the coastlines in each image. Each scene was coregistered to the earliest one using stationary control points over exposed rock. From the coregistered images, the glacier terminus changes were tracked using the curvilinear box method (Lea and others, Reference Lea, Mair and Rea2014), which is a modification of the rectilinear box method (Moon and Joughin, Reference Moon and Joughin2008; Howat and Eddy, Reference Howat and Eddy2011). For the rectilinear box method, the ice front is manually traced between two parallel lines approximating the glacier shear margins. With each measurement, a polygon is formed around the traced ice front, with the stationary lateral sides and a stationary bounding line perpendicular to the lateral bounds set at an arbitrary distance up the glacier. Differences in multiple polygons show the change in the area of the ice front, and dividing that change in area by the distance between the lateral bounds gives the average change in distance of the ice front. To better characterize the front position changes for fjords that curve, the curvilinear box method generates a fixed-width box parallel to the glacier's center streamline.
2.3. Daily air temperatures
To evaluate the impact of climate forcing on ice velocity, we calculated the daily average air temperatures using the meteorological data from the automatic weather station at Zhongshan Station, 50-km east of PRG. The automatic weather station has recorded hourly air temperatures since 1989. Furthermore, we calculated the Cumulative Positive Degree Days (CPDD), which is the total sum of daily average temperatures above 0 °C, from the daily air temperature data over the austral summer season.
2.4. Glacier surface melt
Using the cloud-free Landsat 7 ETM+, Landsat 8 OLI and ASTER (Advanced Spaceborne Thermal Emission and Reflection Radiometer) images for the period 2005–2015, we measured the areas of meltwater lakes visible in the images. Since the meltwater lakes only formed during austral summer at PRG, only images from December to February were used. To precisely identify water-covered pixels, we first employed a band thresholding method that uses the ratio of blue to red band reflectance values. For each image, the thresholding was determined manually. Meltwater features were then manually checked to eliminate false identifications with multiple band combinations.
2.5. Ocean model output
To investigate potential oceanic forcing on the PRG ice shelf, we obtained time series of the monthly ocean temperatures between 2005 and 2015 from the Estimating the Circulation and Climate of the Ocean, Phase II (ECCO2) (Menemenlis and others, Reference Menemenlis2008) ocean model. We calculated the mean vertical ocean temperatures between 250 and 600 m depth, which correspond to the depths of the modified Circumpolar Deep Water (mCDW) that has been linked to variability in the ice-shelf basal melt (Herraiz-Borreguero and others, Reference Herraiz-Borreguero2015; Williams and others, Reference Williams2016). To fully cover the range of mCDW and reduce the uncertainty of the cavity geometry and ocean bathymetry data used by ECCO2, ocean temperatures were averaged over the area shown in Figure 7a (68.5–69.75°S, 74–78°E).
2.6. Sea ice concentration
We calculated daily sea ice concentrations at the glacier front from the sea ice concentration products derived from the ARTIST sea ice algorithm (Spreen and others, Reference Spreen, Kaleschke and Heygster2008). These products provide complete coverage from 1 Jun 2005 to 31 May 2015 by using AMSR-E, SSMIS and AMSR2 data, with a spatial resolution of 6.25 km. We extracted sea ice concentrations from 91 gridcells at the glacier fronts (shown in Fig. 7a), where the fast ice usually forms (Fraser and others, Reference Fraser, Massom, Michael, Galton-Fenzi and Lieser2011).
3. RESULTS
3.1. Ice front position changes
The ice front of the PRG continuously advanced from 2004 to 2012 at a rate equal to the ice flow speed of ~600 m a−1 (Fig. 1b), in agreement with the findings of Liu and others (Reference Liu, Niu and Yang2017a). A small calving event in 2012 slightly reduced the total advance for that year. In 2015, a large rift opened in the ice tongue at ~3 km from the ice front, leading to the calving of an iceberg and a large ice front retreat (Fig. S1).
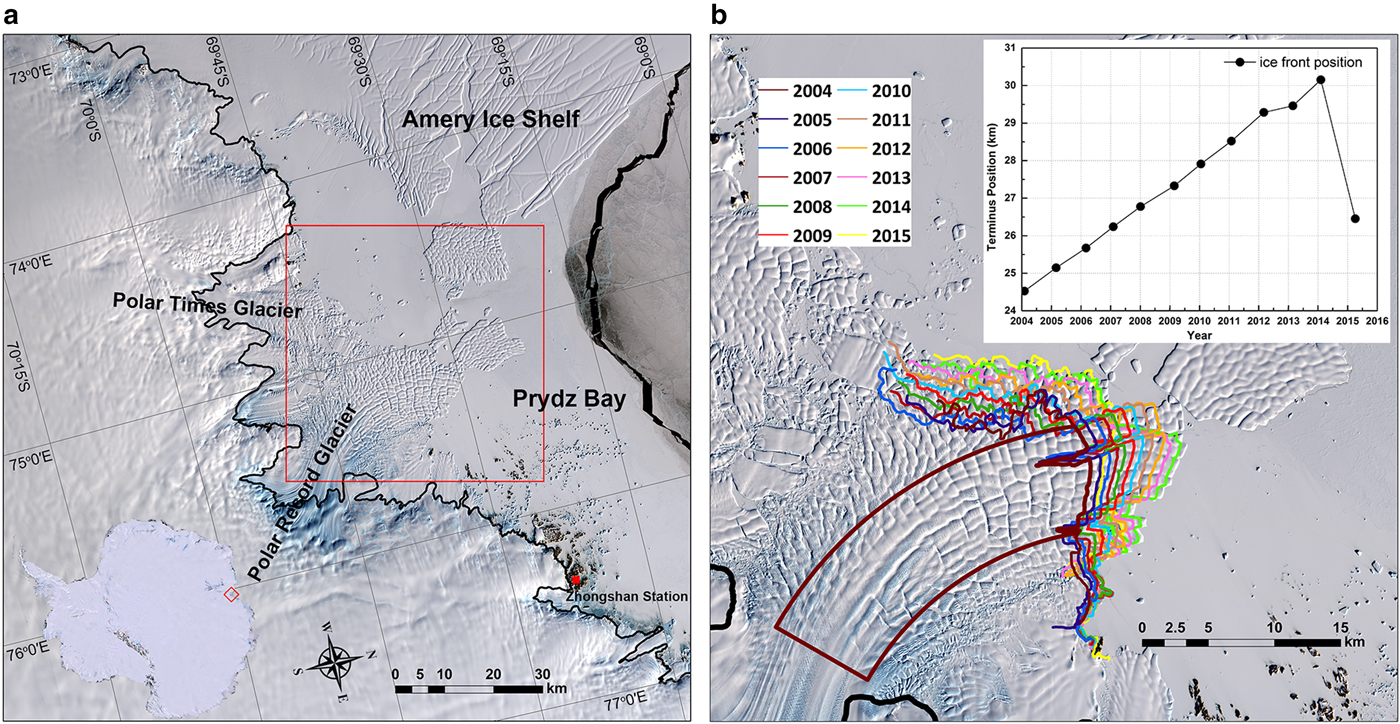
Fig. 1. (a) Landsat-8 image of the PRG acquired on 25 September 2014. The black curve shows the ASAID grounding line (Bindschadler and others, Reference Bindschadler2011). (b) The variations of the ice front position from 2004 to 2015. The background is the area in (a) indicated by the red box. The dark red polygon is the curvilinear box used for obtaining an average front position change as described in the text. The initial 2004 polygon is shown as an example. The inset plots the change in ice front position as the mean distance between the ice front and the reference line.
3.2. Ice surface velocity from 2005 to 2015
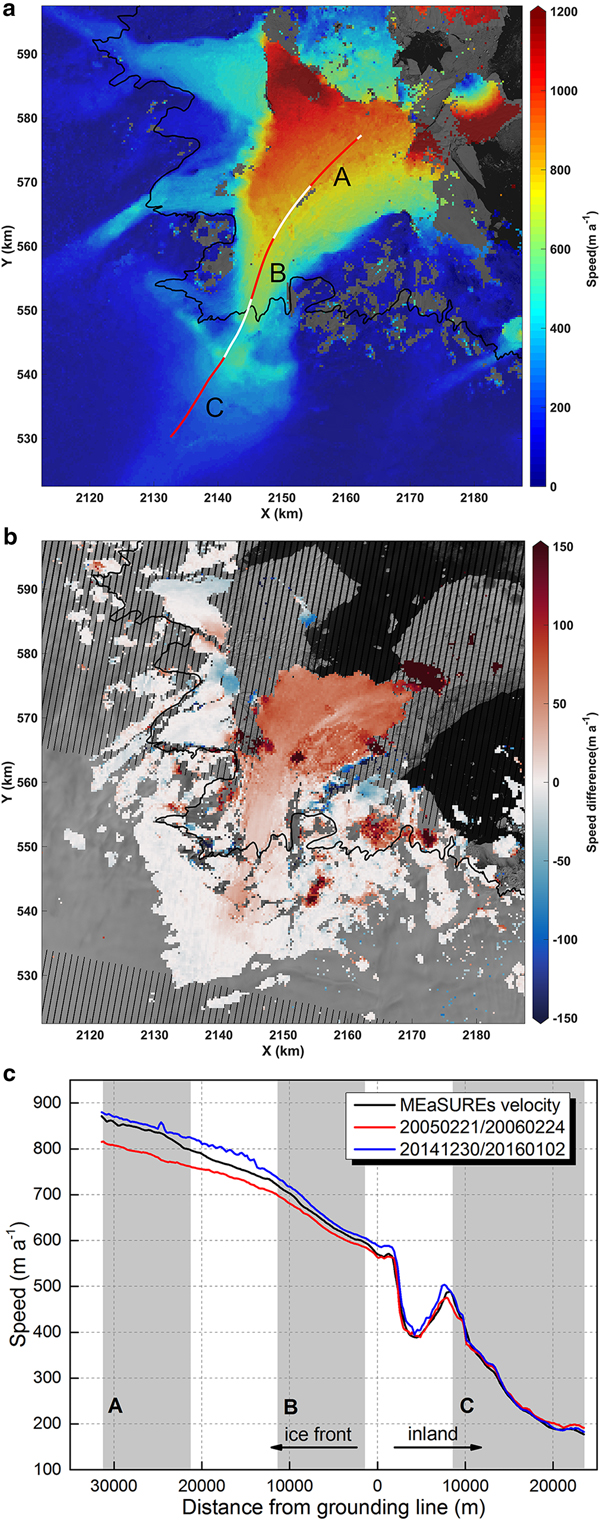
The map of the average annual ice flow speed (Fig. 2a) shows that speeds increase toward the ice front, reaching ~900 m a−1. Speed differences obtained by using the speed derived from the image pair from 30 December 2014/2 January 2016 minus the result derived from image pair from 21 February 2005/24 February 2006 are also shown in Figures 2b, c, along with observations from the MEaSUREs InSAR-Based Antarctica Ice Velocity Map (Version 2) (Rignot and others, Reference Rignot, Mouginot and Scheuchl2011; Mouginot and others, Reference Mouginot, Scheuchl and Rignot2012), which are used for reference. We find that the ice speed increased by up to ~80 m a−1 at the ice front and by ~30 m a−1 at the grounding line, with no resolvable change above.
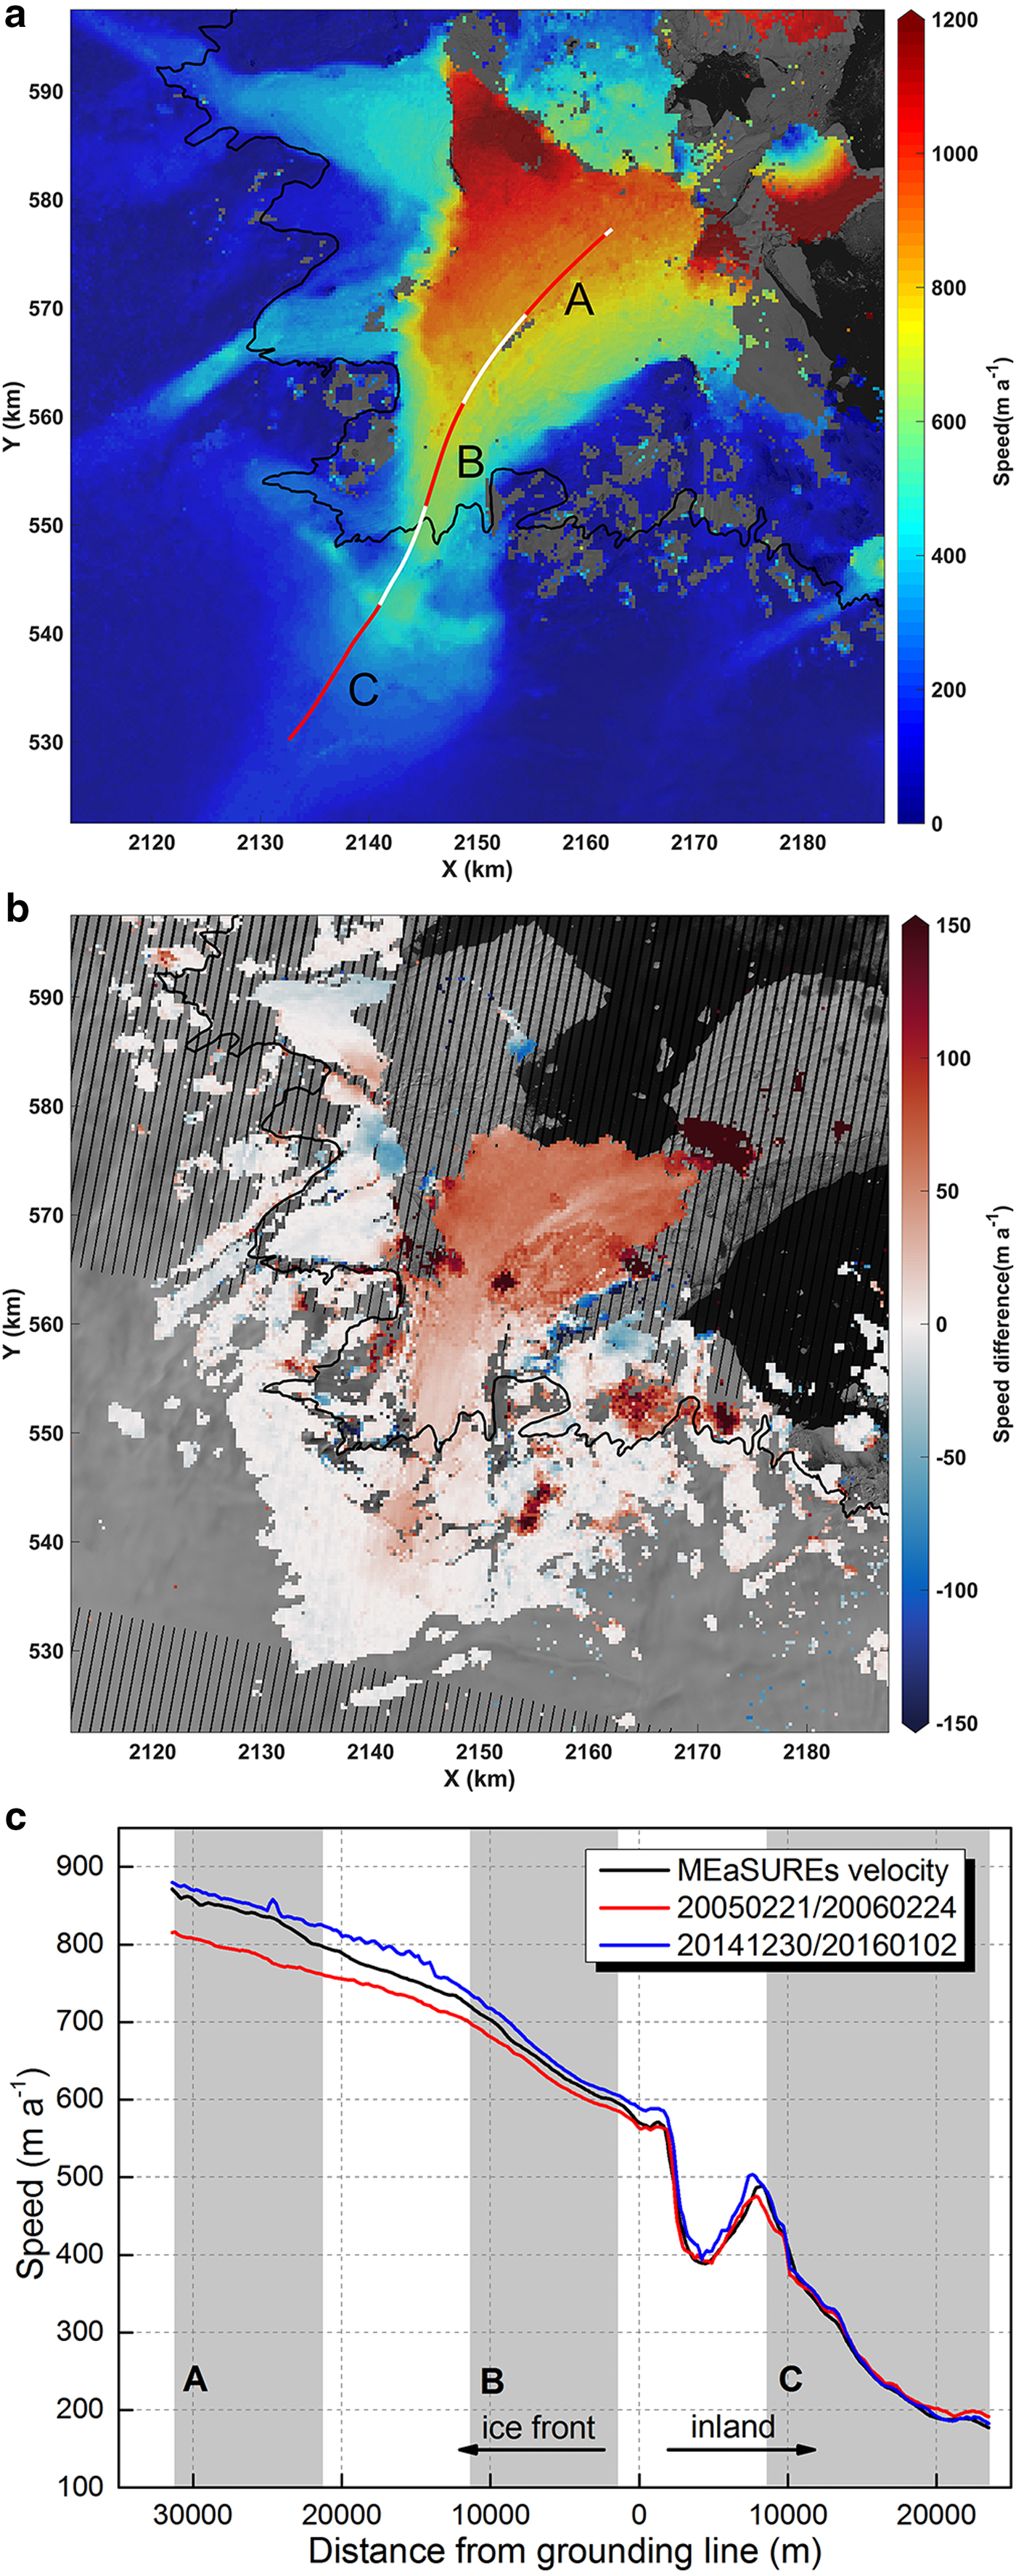
Fig. 2. (a) Ice flow speed map derived from Landsat-8 image pairs from 14 December 2014/31 January 2015. The white line indicates the position of the central flowline. The red lines A, B and C indicate the sections of the streamline used to calculate the speed shown in Figure 3. (b) Maps of the speed differences between 2005 and 2015. The background is the Landsat-7 image acquired on 24 February 2006. (c) Speed profile along the streamline in (a). The gray shading indicates the position of the three chosen sections.

Fig. 3. Interannual (a, c, e) and seasonal (b, d, f) variations in the PRG flow speeds along the three chosen sections over the profile shown in Figure 2c. Velocities in black with vertical error bars are the 1-sigma measurement errors and the horizontal bars are the temporal baselines of the image pairs. The lines that best fit the temporal subsets of the data are shown in red. The blue bars in (a), (c) and (e) are from the MEaSUREs Annual Antarctic Ice Velocity Maps. The vertical dashes denote the timings of large calving events occurring in March 2015. The plots (b), (d) and (f) show measurements from all years by the time of year.
To further examine interannual changes in ice speed, we plot the time series of the averaged speeds of the three chosen sections over the profile shown in Figure 2a, located between ~21 and 31 km, 1 and 11 km and 9 and 24 km from the grounding line, respectively (Figs 3a, c, e). Compared with the MEaSUREs annual ice velocity (Mouginot and others, Reference Mouginot, Rignot, Scheuchl and Millan2017), the Landsat estimates are slightly higher. This may be attributed to the different sampling times between our results and the MEaSUREs annual speeds. A secular speed increase over the ice shelf from 2005 (Figs 3a, c) is, however, confirmed by both results. While we clearly resolve acceleration over sections A and B on the ice shelf, no speed increase over the grounded ice (section C) is resolved. From 2005 to 2010, there was an insignificant increasing trend of ~2 m a−1 over both sections. In 2010, the speeds abruptly increased by 40 m a−1 and 20 m a−1, or by 3–5%, for the sections A and B, respectively. The speeds then increased at a similar rate as before 2010 in both sections, with another abrupt increase of 10 m a−1 after the 2015 calving event in section A, but not in section B.
To detect seasonal variations in speed, we analyzed all speed measurements from 2005 to 2017, including both those derived from Landsat image pairs with 32 or 48-day baselines or from Sentinel-1 scenes (Figs 3b, d, f). As before, we averaged the speeds over the three sections of the profile and removed the interannual trends. We find that both sections A and B of the glacier show similar seasonal patterns, with initial speedups typically start from September/October, reaching a maximum in December that is maintained into January, and a rapid decrease from February to April, reaching a minimum below the October speed. The upstream section (section B) speeds up by ~50 m a−1 or ~8%, while the downstream section (section A) shows a larger amplitude speedup of ~65 m a−1, but a similarly large decrease from January to April of ~100 m a−1. Plotting the seasonal speed above the grounding zone (i.e. on grounded ice), we find no resolvable seasonal variability (Fig. 3f).
3.3. Air temperatures and glacier surface melt
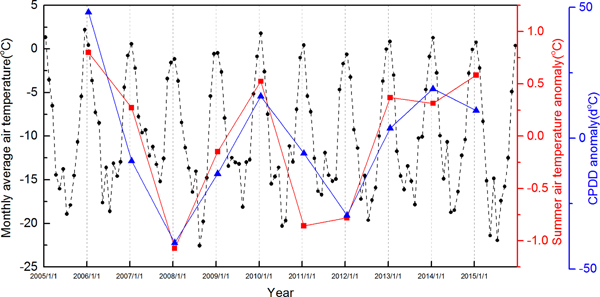
The monthly average air temperatures (Fig. 4) from 2005 to 2015 show that January was usually the warmest month of the year. The only exception was 2005, which had a higher average air temperature in December. The years 2006, 2015 and 2010 had the top three highest average austral summer (December to next February) air temperatures (−0.22 °C, −0.44 °C and −0.50 °C, respectively). The CPDD anomaly fluctuated between 2006 and 2015, similar to the austral summer air temperature trend (Fig. 4).

Fig. 4. Monthly average air temperatures (black), summer air temperature anomaly (red) and CPDD anomaly (blue) from 2005 to 2015 obtained from the AWS at Zhongshan Station.
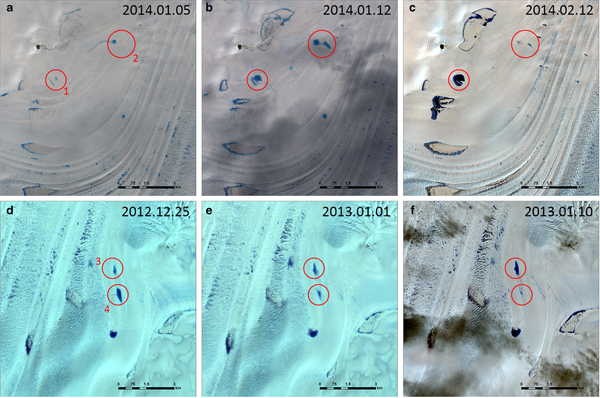
Glacier surface melt typically increases with higher air temperatures (Lenaerts and others, Reference Lenaerts2017). We find that the meltwater lakes on PRG typically appear in early December and then expand rapidly in late December and January (Fig. 5b), peaking at the end of January and declining throughout February. Most meltwater lakes are distributed near the grounding line (Fig. 5a). Similar to previous observations at Langhovde Glacier in Dronning Maud Land (Langley and others, Reference Langley, Leeson, Stokes and Jamieson2016), we detect a substantial number of lakes on the ice shelf that shrink while other lakes grow. Furthermore, some lakes (e.g. Lake 4 in Fig. 6) shrank from the outside in, suggesting potential englacial drainage.
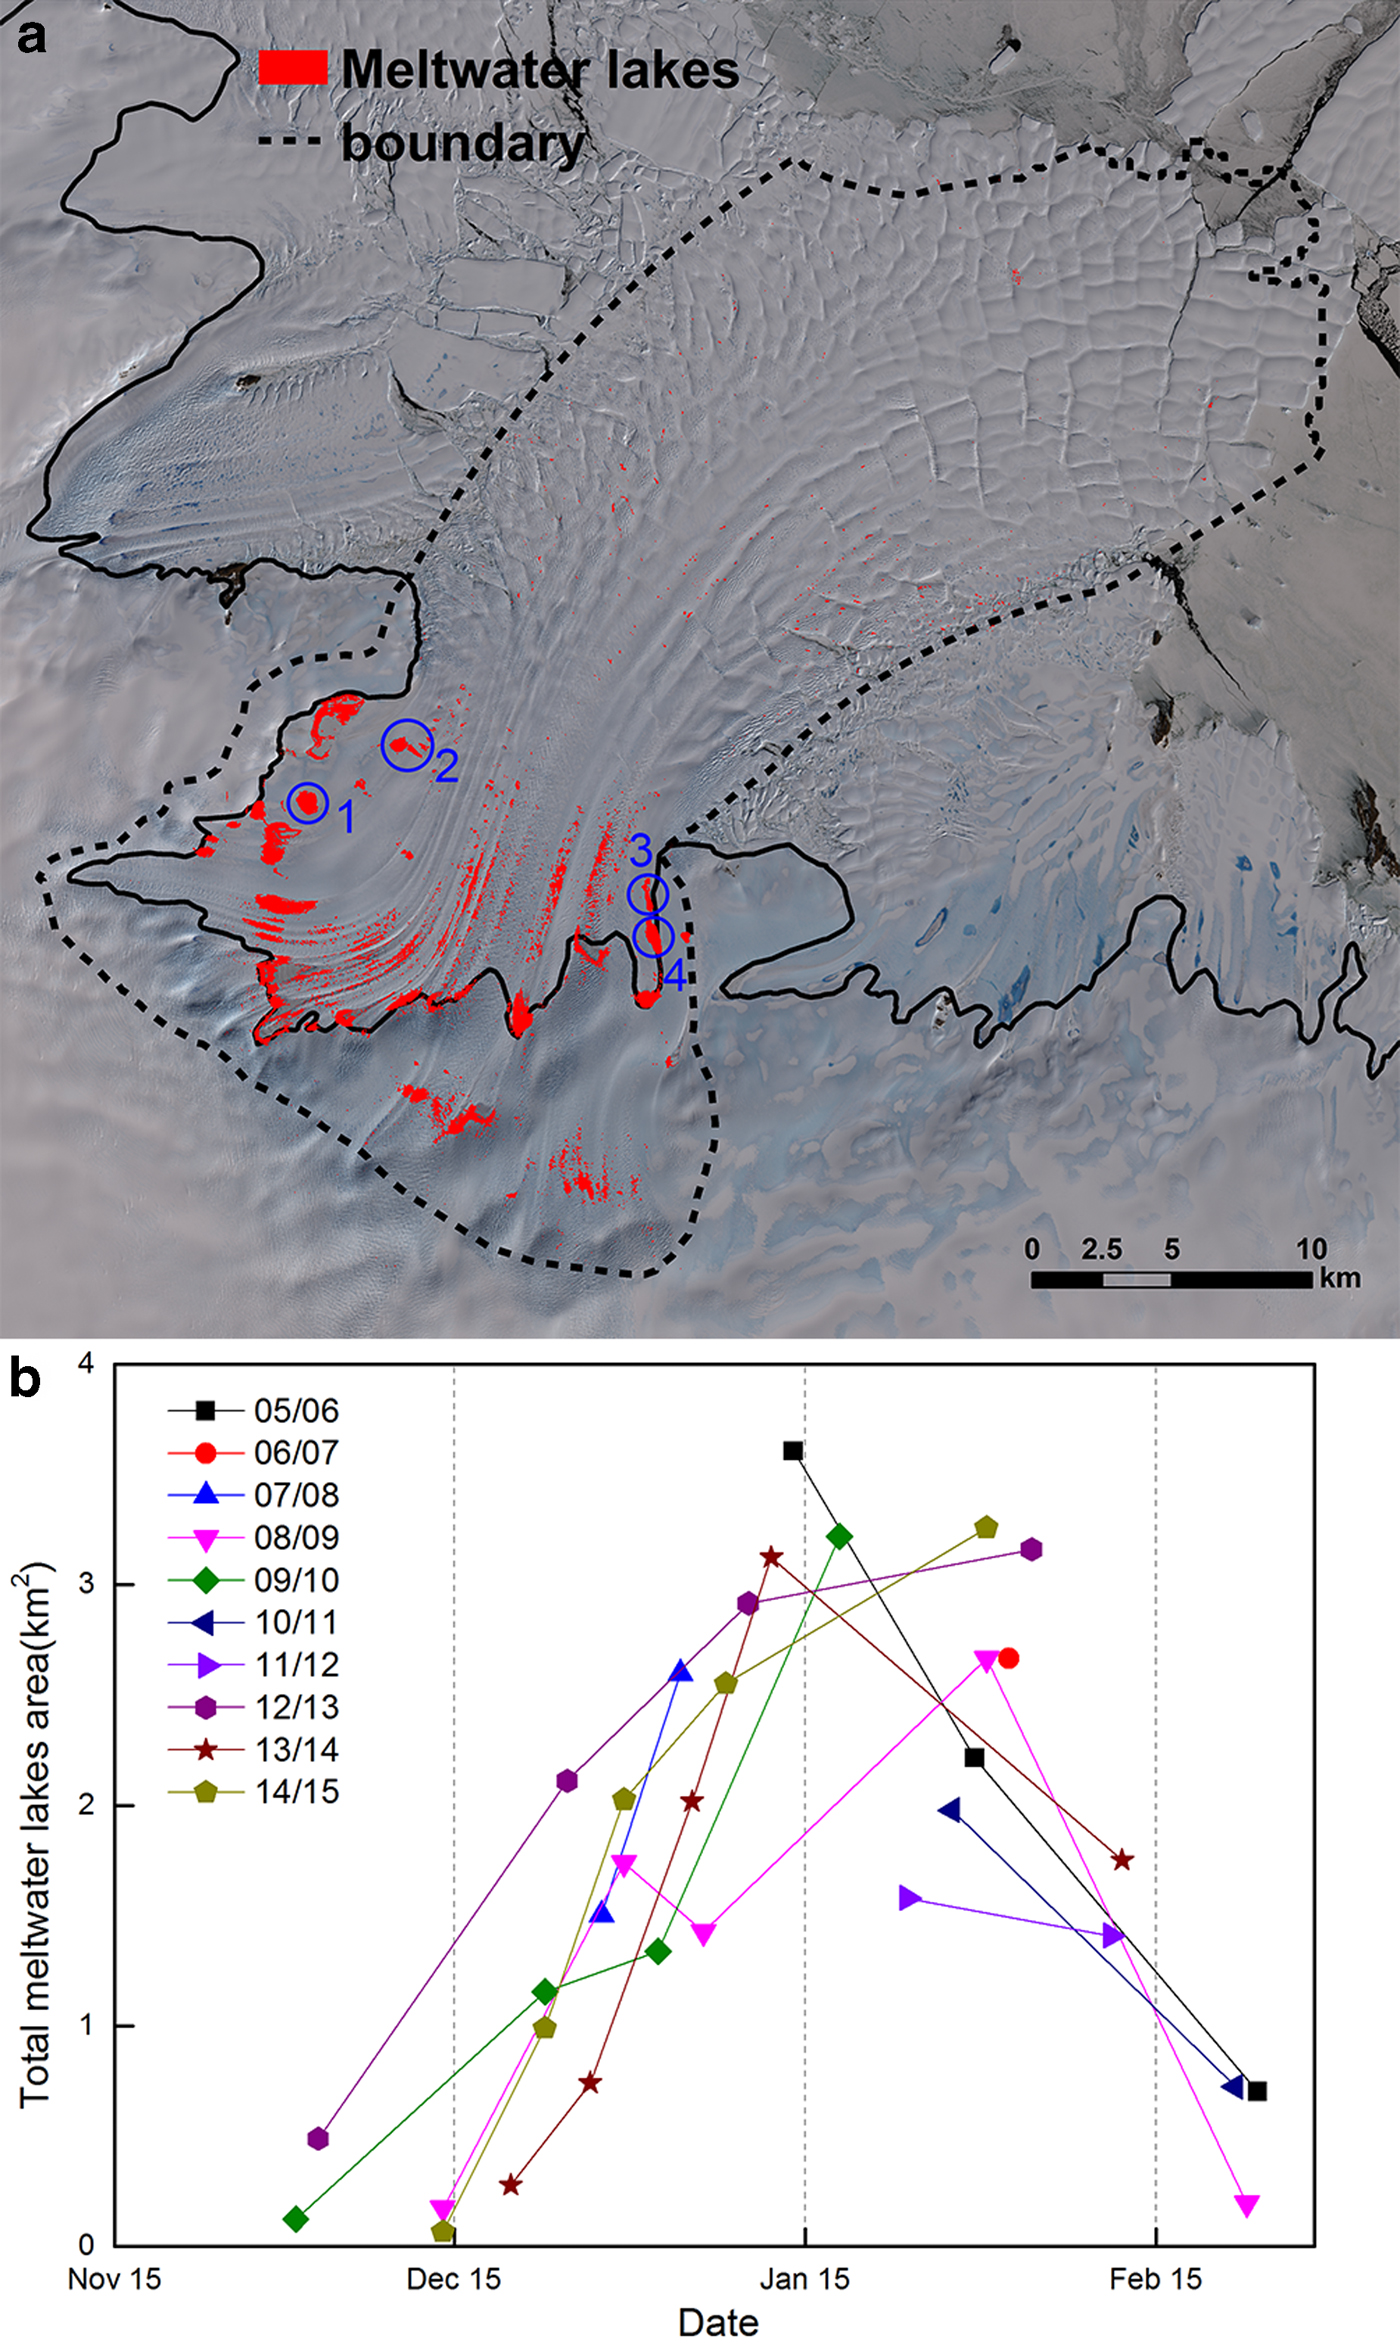
Fig. 5. (a) The distribution of the surface meltwater lakes observed from 2005 to 2015. All the lakes inside the polygon boundary were manually digitized using either Landsat or ASTER images. The blue circle marked the location of lakes investigated in Figure 6. (b) The area evolution of the meltwater lakes in the PRG for the austral summer mapped from sequential Landsat and ASTER images.

Fig. 6. (a–c) The evolution of Lake 2 from its formation to its disappearance, concurrent with Lake 1's continual growth. (d–f) Occasionally, neighboring lakes shrink (Lake 4) and grow (Lake 3) simultaneously.
3.4. Ocean temperatures and sea ice concentration
The ECCO2 time series of monthly ocean temperatures and temperature anomalies offshore of the PRG are shown in Figure 7b. In contrast to air temperatures, ocean temperatures peaked in April between 2005 and 2015. From 2005 to 2009, the temperatures steadily declined and a negative anomaly was detected during the years 2007–2009. In 2010, however, ocean temperatures experienced a large increase of ~0.3 °C (a positive anomaly of ~0.2 °C), reaching its highest recorded value. After 2010, the ocean temperature fell in 2011 and trended upward from 2011 to 2015. The positive temperature anomaly between 2013 and 2015 indicates the ocean temperature was higher than the 11-year average.
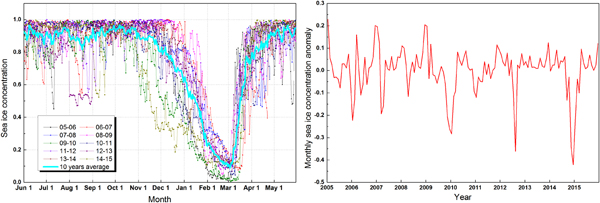
Daily sea ice concentrations from 1 June 2005 to 31 May 2015 at the glacier front are shown in Figure 8a. Sea ice concentration typically begins to decrease in late November, reaching a minimum in late February, and then rapidly increasing afterward. This late February sea ice minimum follows the January peak in air temperature and occurs just before the air temperatures drop below freezing. Besides, the analysis of monthly sea ice concentration anomaly indicates there was a significant negative sea ice anomaly from November to December 2014 (Fig. 8b). During this time, the sea ice concentration was 30% below the 10 years average, coinciding with the following 2015 calving event.
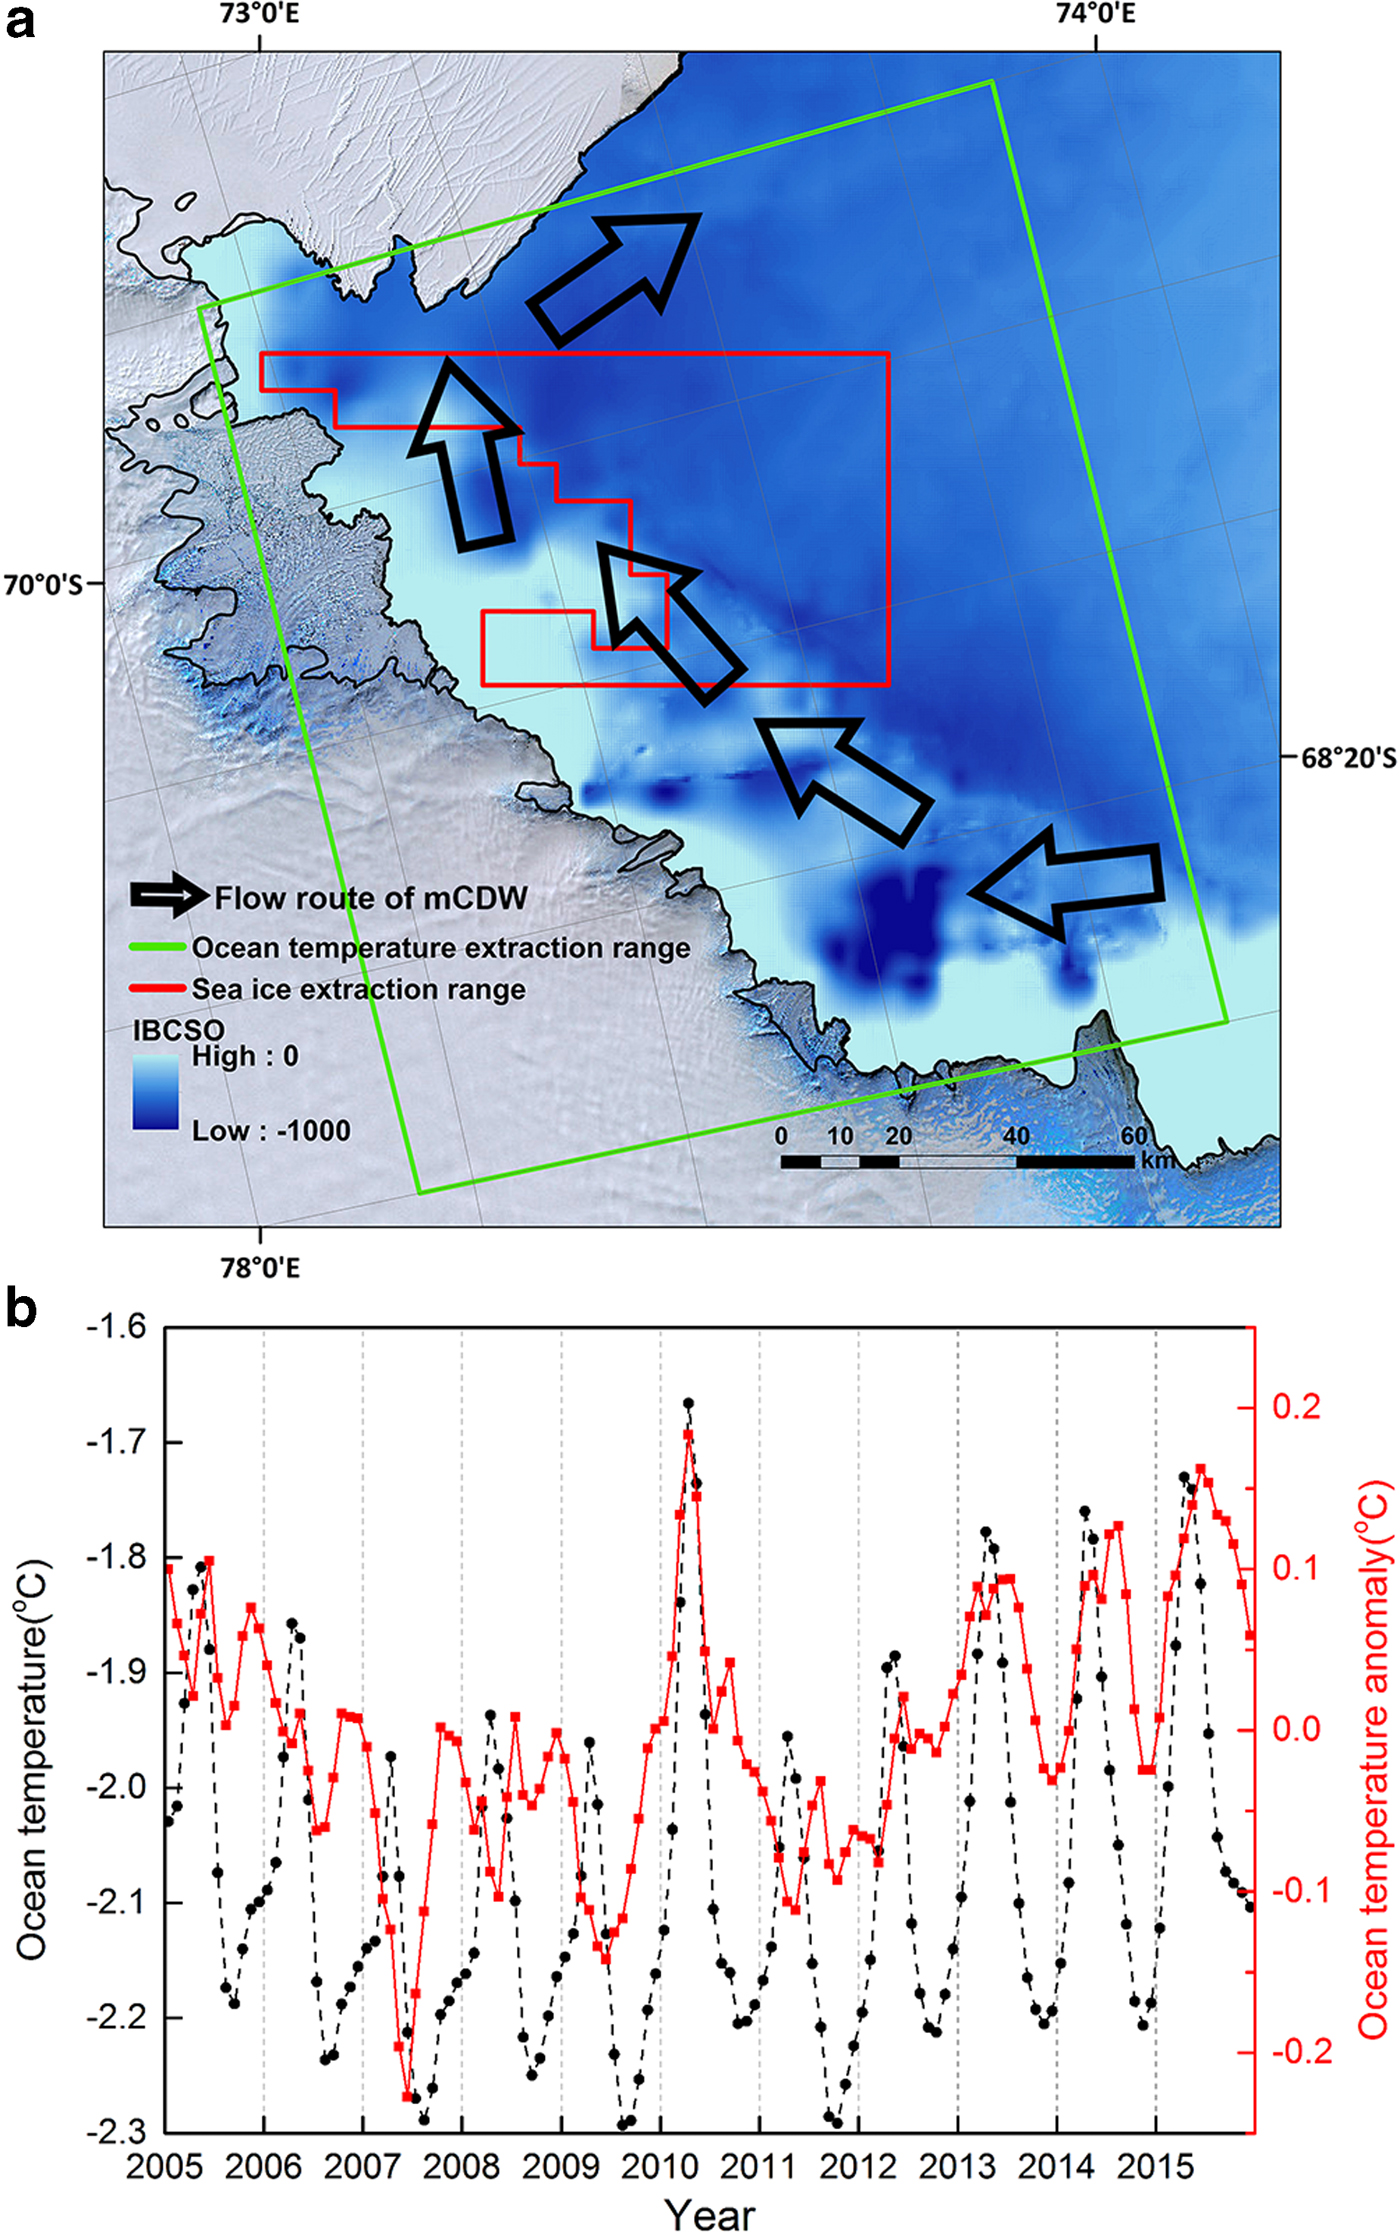
Fig. 7. (a) The ocean temperature and sea ice extraction range. The black arrows demonstrate the flow route of mCDW at the glacier front (Williams and others, Reference Williams2016; Liu and others, Reference Liu2017b). (b) The ECCO2 ocean potential temperatures and temperature anomaly (250–600 m depth) from 2005 to 2015.

Fig. 8. (a) Daily sea ice concentration from 1 June 2005 to 31 May 2015 in Prydz Bay. Each line represents sea ice concentration from 1 June to the next 31 May. The thick cyan line indicates the 10-year mean sea ice concentration of each day. (b) The monthly sea ice concentration anomaly from January 2005 to December 2015.
4. DISCUSSION
Our observations reveal substantial variation in the flow of PRG's ice shelf on both interannual and seasonal time scales between 2005 and 2015 (Fig. 3). The finding of a long-term increase in speed is contrary to the results of Liu and others (Reference Liu, Niu and Yang2017a) who found no significant speed changes from 2004 to 2015. This interannual speedup was highest at the ice front, decreasing to near zero at the grounding line, with no detectable change upstream. There were distinct increases in speed across the entire ice shelf in 2010 and at its seaward end in 2015.
Acceleration of an ice shelf can result from (1) increased flux into the shelf at the grounding zone, (2) thickening of the ice shelf due to decreased basal melting, which increases the hydrostatic stress and increases the ice shelf flow rate, (3) thinning and/or retreat from areas of resistance, such as islands, lateral shear margins and sea ice or (4) weakening of the ice shelf and its shear margins from surface meltwater. The first mechanism would require an increase in flow speed and thickening inland of the grounding zone, which we do not detect and is corroborated by the results of Gardner and others (Reference Gardner2018). Paolo and others (Reference Paolo, Fricker and Padman2015) found no significant change in shelf thickness based on radar altimetry. Therefore, we assess the possibility of a change in flow resistance as an explanation for the observed speed increase.
Acceleration of the PRG ice shelf occurred during a period of sustained ice front advance, eliminating a loss of buttressing due to retreat as a possible cause of interannual acceleration. When the ice front calved and retreated in 2015 (Fig. S1), a small acceleration, localized to within ~10 km of the ice front (Fig. 3a) was detected. Oceanic forcing is another possible cause of the interannual speed increase in the PRG. Intrusion of warm mCDW into Prydz Bay, as has been observed for the Amery Depression (Herraiz-Borreguero and others, Reference Herraiz-Borreguero2015; Reference Herraiz-Borreguero2016) and Totten Glacier (Rintoul and others, Reference Rintoul2016), would increase the basal melt rate of ice tongue. Ice thinning would reduce the back-stress generated by the ice shelf, initiating acceleration. The pattern of acceleration is consistent with ECCO2 ocean temperatures, showing a strong peak in temperatures in 2010, the same year we observe an abrupt increase in speed, followed by sustained interannual ocean warming. Furthermore, we calculate the mean ocean temperatures for April–August each year, which correspond to the general duration of the inflow of mCDW (Herraiz-Borreguero and others, Reference Herraiz-Borreguero2015). A significant (r 2 = 0.57, p < 0.05) correlation exists between the annual speed and those mean ocean temperatures.
We find a distinct seasonality in ice flow speed with a maximum amplitude at the ice front, declining to near zero at the grounding line. The lack of seasonal acceleration over grounded ice eliminates variations in subglacial hydrology as a possible mechanism. Sea ice could also play an important role in ice shelf stability. On the one hand, the back-stress provided by sea ice can stabilize the ice front, shut down iceberg calving and prevent ice shelf crack propagation entirely (Walter and others, Reference Walter2012; Moon and others, Reference Moon, Joughin and Smith2015; Robel, Reference Robel2017). On the other hand, sea ice can alter the water column properties, e.g. sea ice formation in a polynya often accompanied by cold and saline water production. This could alter the winter water layer and link to basal melt rate variability (Khazendar and others, Reference Khazendar2013; Dutrieux and others, Reference Dutrieux2014). In our case, the sea ice consolidates and grows thick in winter, which will provide an increasing amount of back-stress to the ice shelf and potential energy builds up in the ice shelf. Then sea ice begins to lose its rigidity and gradually break up in spring, leading to the release of stored energy. This will initiate the ice shelf acceleration in September/October. After that, the ice flow acceleration may mainly relate to the glacier surface meltwater. The timing of acceleration appears to be most consistent in timing with air temperatures. Both flow speed and air temperatures reach a maximum in early January, resulting in a maximum in the area of supraglacial melt lakes at the same time, which indicate peak meltwater production. We therefore hypothesize that the summer acceleration is due to weakening of the ice shelf by englacial penetration of meltwater and/or filling of crevasses, raising the ice temperature. This would soften the ice, causing locally faster flow without changing the large-scale stress regime of the ice shelf and impacting flow on grounded ice.
5. CONCLUSIONS
We measured both the long-term and seasonal ice velocities of the PRG from 2005 to 2015. Ice flow accelerated by up to 10% since 2005, with the acceleration increasing from zero at the grounding zone to a maximum at the ice front, and with the largest increase occurring in 2010, which we attribute to increased basal melting due to warm mCDW intrusions. We also detect a seasonal variation in velocity, increasing from approximately zero at the grounding zone to a maximum amplitude at the ice front. The timing of this seasonal variability agrees with sea ice break up in spring and the following onset of surface melting, which inferred from the extent of supraglacial lakes. This suggests that the seasonal speedup may initially result from the lost back-stress provided by the sea ice in the austral spring and then due to weakening of the ice shelf by warming and infilling of crevasses. While our results add to the growing body of evidence suggesting substantial variability in the dynamics of East Antarctic outlet glaciers, they also underscore how little is known about the behavior of these glaciers on seasonal to interannual timescales, particularly in regard to forcing from ocean warming and surface melt. The increasing spatial and temporal resolution of observations available from spaceborne remote sensing, such as from ESA's Sentinel constellations and NASA's Landsat and upcoming ICESat-2 missions, will enable better understanding of multi-scale dynamics of these poorly known systems.
SUPPLEMENTARY MATERIAL
The supplementary material for this article can be found at https://doi.org/10.1017/jog.2019.6
ACKNOWLEDGEMENTS
This research was funded by the National Natural Science Foundation of China (NSFC) (41776200, 41531069 and 41376187), the Fundamental Research Funds for the Central Universities (2042015kf0189) and the China Scholarship Council (201506270085).


 Open access