


Introduction
Crop yield variability within and between farms attracted research attention in Sub-Saharan Africa in the last decades (Phiri et al., Reference Phiri, Kanyama-Phiri and Snapp1999; Vanlauwe and Giller, Reference Vanlauwe and Giller2006; Wolde et al., Reference Wolde, Veldkamp, Haile, Nyssen, Muys and Gebrehiwot2007; Zingore et al., Reference Zingore, Murwira, Delve and Giller2007; Moges and Holden, Reference Moges and Holden2008; Tittonell et al., Reference Tittonell, Vanlauwe, Corbeels and Giller2008; Tittonell and Giller, Reference Tittonell and Giller2013; Vanlauwe et al., Reference Vanlauwe, Descheemaeker, Giller, Huising, Merckx, Nziguheba, Wendt and Zingore2015; Kihara et al., Reference Kihara, Nziguheba, Zingore, Coulibaly, Esilaba, Kabambe and Huising2016). In fact, the attempt to understand soil variability and its potential effect on crop productivity has been ongoing since the time of Dokuchaev in the early 1900, who divided soils as normal, transitional and abnormal based on topography-related patterns (cited from Krupenikov, Reference Krupenikov and Dhote1993). However, soils with undulating landscapes or imperfectly developed profiles were treated as exceptions to the more common, generalized trends of ‘normal’ soils in the US or Russia (Miller et al., Reference Miller, Burras and Crumpton2008).
The development of the ‘Catena’ concept, introduced by Geoffrey Milne (1898–1942), was a breakthrough in recognizing topographic differential and its implication on soil types and vegetation patterns. The concept came to light while attempting to develop soil maps for ‘abnormal’ East African soils, whereby topographic variability dictates soil types and associated soil cover patterns (Milne, Reference Milne1935). Milne (Reference Milne1935) identified the process of erosion–deposition and changes in parent material at the surface corresponding with topography, which was used for mapping soil complexes with repeating internal patterns. The effect of topography on hydrologic flows resulting in variable soil properties was also recognized (Dahlgren et al., Reference Dahlgren, Bottinger, Huntington and Amundson1997).
The topography of the East African agricultural landscapes comprising high elevation hillslopes, midslopes and foot slopes, which are appearing within short distances, requires differing agronomic management and various levels of inputs. The effect of the landscape position on soil nutrient status has been reported in Vietnam (Wezel et al., Reference Wezel, Steinmüller and Friederichsen2002), Malawi (Phiri et al., Reference Phiri, Kanyama-Phiri and Snapp1999), northern Ethiopia (Wolde et al., Reference Wolde, Veldkamp, Haile, Nyssen, Muys and Gebrehiwot2007) and southern Ethiopia (Amede and Taboge, Reference Amede, Taboge and Bationo2007; Moges and Holden, Reference Moges and Holden2008). Soils can be more gravelly and thinner with rock outcrops close to hill tops, with more fertile soils in mid-slope positions and fertile, alluvial soils in the valleys. Given erosion risks, farmers' decisions in terms of input application and management are also in favor of footslopes and midslopes.
Landscape variability also creates soil fertility variability between farms and within farms in terms of soil nutrient status (Wezel et al., Reference Wezel, Steinmüller and Friederichsen2002; Balasundram et al., Reference Balasundram, Robert, Mulla and Allan2006; Wolde et al., Reference Wolde, Veldkamp, Haile, Nyssen, Muys and Gebrehiwot2007; Moges and Holden, Reference Moges and Holden2008), soil organic matter (Gebrelibanos and Assen, Reference Gebrelibanos and Assen2013), soil water holding capacity (Wang et al., Reference Wang, Fu, Gao, Yao and Zhou2012) and agronomic management requirements (Tittonell et al., Reference Tittonell, Vanlauwe, Corbeels and Giller2008). The variability is increased further by soil erosion (Hurni et al., Reference Hurni, Zeleke, Kassie, Tegegne, Kassawmar, Teferi, Moges, Tadesse, Ahmed, Kebebew, Hodel, Amdihun, Mekuriaw, Debele, Deichert and Hurni2015), which commonly degrades the hillslopes and midslopes and depositing it on the footslopes (Balasundram et al., Reference Balasundram, Robert, Mulla and Allan2006; Moges and Holden, Reference Moges and Holden2008).
Three different crop response categories to fertilizer application have been identified, namely responsive, fertile non-responsive and degraded non-responsive to indicate yield variability in small scale farming (Tittonell et al., Reference Tittonell, Vanlauwe, Corbeels and Giller2008; Tittonell and Giller, Reference Tittonell and Giller2013; Kihara et al., Reference Kihara, Nziguheba, Zingore, Coulibaly, Esilaba, Kabambe and Huising2016). In non-responsive soils, higher rates of fertilizer application did not necessarily guarantee higher crop yield (Kihara et al., Reference Kihara, Nziguheba, Zingore, Coulibaly, Esilaba, Kabambe and Huising2016; Vanlauwe et al., Reference Vanlauwe, Descheemaeker, Giller, Huising, Merckx, Nziguheba, Wendt and Zingore2015; Tittonell et al., Reference Tittonell, Vanlauwe, Corbeels and Giller2008; Fu et al., Reference Fu, Liu, Chen, Lu and Qiu2004; Wang et al., Reference Wang, Fu, Gao, Yao and Zhou2012). There is evidence that marginal soils produce low yields compared to moderately fertile soils, even after application of higher rates of fertilizers (Vanlauwe et al., Reference Vanlauwe, Descheemaeker, Giller, Huising, Merckx, Nziguheba, Wendt and Zingore2015; Agegnehu and Amede, Reference Agegnehu and Amede2017; Tamene et al., Reference Tamene, Amede, Kihara, Tibebe and Schulz2017). However, there is limited understanding of why there was a positive response in some farms while there was limited crop response in the others within the same locality. Even in occasions when farmers did apply higher rates of mineral fertilizers, they rarely got positive crop response and economic incentives (Spielman et al., Reference Spielman, Alemu and Kelemwork2013; Tamene et al., Reference Tamene, Amede, Kihara, Tibebe and Schulz2017). A low crop response to application of fertilizers could be partly due to the mosaic of farms and landscapes and the failure in identifying the right type and the amount of nutrient required for a specific landscape niche (Phiri et al., Reference Phiri, Kanyama-Phiri and Snapp1999; Thelemann et al., Reference Thelemann, Johnson, Sheaffer, Banerjee, Cai and Wyse2010). Moreover, fertilizer recommendations have rarely considered the ability of resource constrained smallholder farmers to invest in expensive and often hard to obtain inorganic fertilizers.
Generally, there is limited information on how landscape positions could be used for fine tuning fertilizer recommendations. In this study, we used wheat as a test crop, which was becoming an increasingly important crop, to understand the factors affecting the crop response to combination of fertilizers in the undulating setting of ‘abnormal’ soils of the Ethiopian highlands across the catena. The major objectives of the research were to (1) quantify effects of landscape positions on crop-nutrient responses, and resources use efficiency (nutrient recovery fraction and crop water productivity (CWP)) and (2) identify wheat yield limiting nutrients (N, P, K, S and Zn) across the catena.
Materials and methods
Geographic location and physiognomic characteristics of the research sites
Ethiopia is administratively divided into regional states and chartered cities, Zones, Woreda (districts) and Kebele (wards), with Kebele being the smallest administrative unit. The experiments were conducted in three wheat growing kebels in Ethiopia, namely upper Gana, Tsibet and Yewol kebeles in Lemo, Endamohoni and Worreilu districts, respectively (Fig. 1). Endamohoni and Worreilu represent undulating, hilly wheat belts, while Lemo represents relatively flat wheat growing belts.

Fig. 1. Locations and DEMs of the landscapes of the respective kebeles in Endamohoni, Lemo and Worreilu districts in Ethiopia.
Characteristics of Lemo site
Upper Gana Kebele is found in Lemo Woreda in the Southern Nations Regional State, 12–15 km North West of Hosaena town. The experimental farms are located at a geographical coordinate of 7.54300–7.59100°N latitude and 37.74500–37.77600°E longitude at altitudinal ranges of 2140–2290 m above sea level. The predominant soil feature in the area is deep Nitisols with 5–10 cm top black colored soil at flatter landscapes and Luvisols with bleached top soil having medium to poor productivity at rolling and undulating landscapes. Lemo has a bimodal rainfall pattern, with an annual average rainfall of 1079.3 mm (Fig. 2). The mean annual maximum and minimum temperature is 23 and 18°C, respectively. The growing period in Lemo starts early March and continue to the end of September, with a short dry spell in June. Lemo is a relatively flat landscape (Fig. 1) with 53, 46 and 1% of the landscape lies with a slope of <5, 5–30 and >30%, respectively.
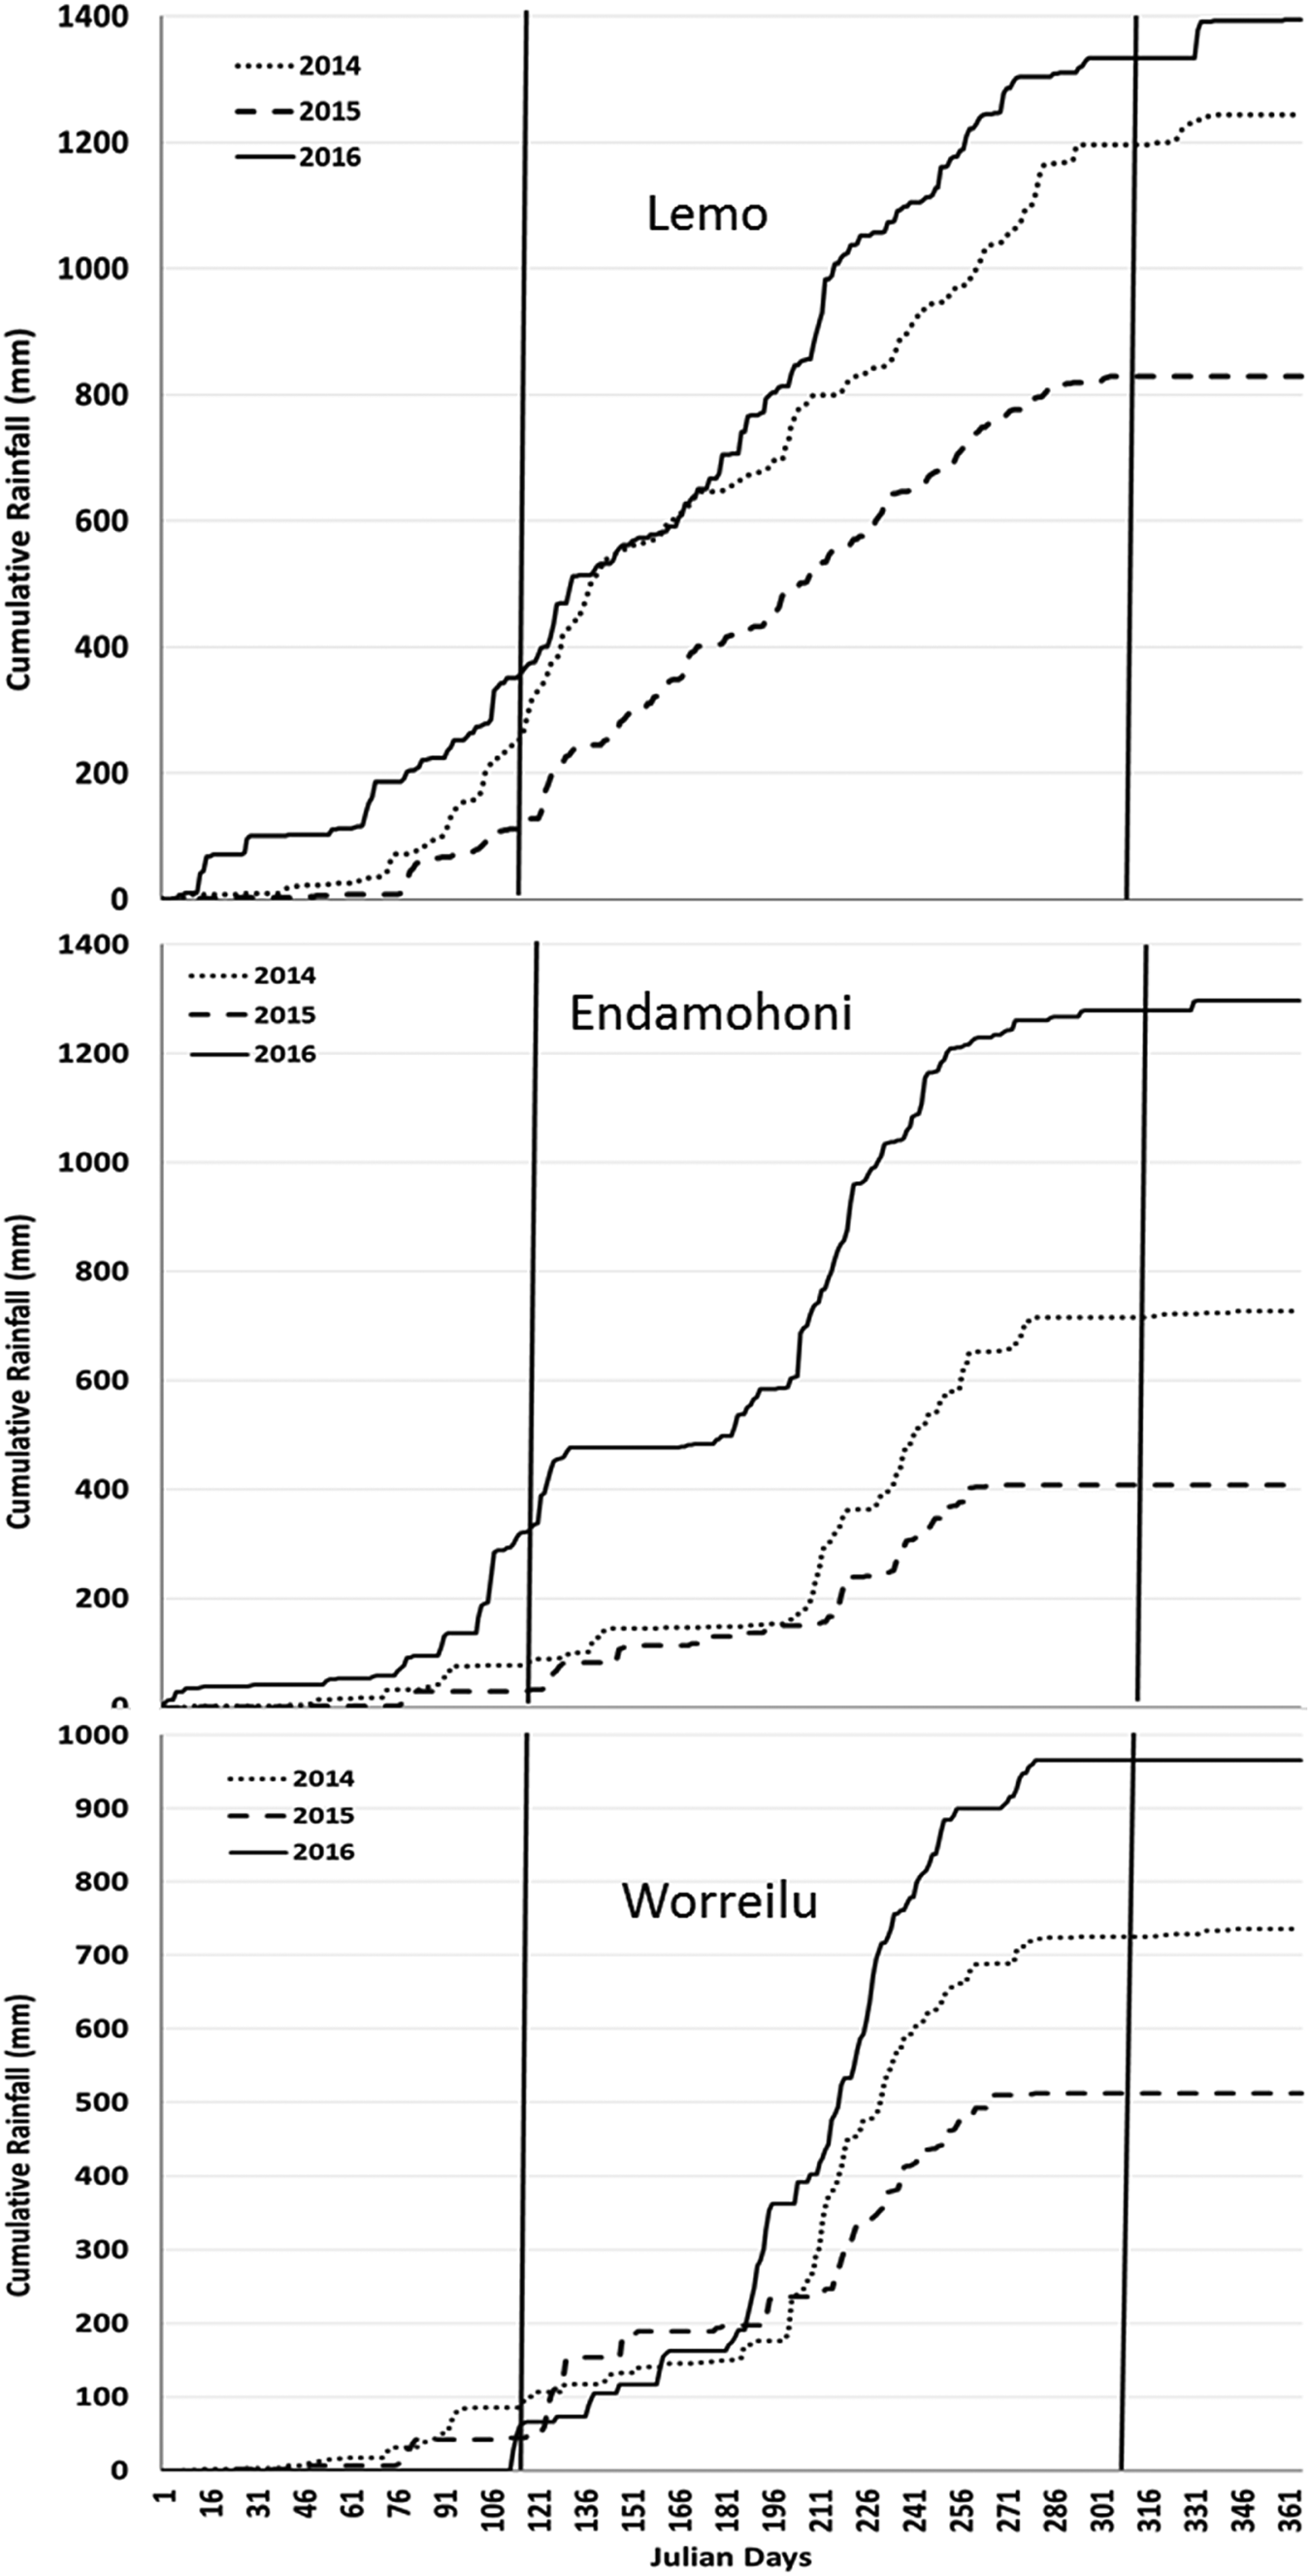
Fig. 2. Rainfall annual distribution in three research sites, Ethiopia (2014–2016).
Characteristics of Endamohoni site
Tsibet Kebele is located in Endamohoni District, Tigray Region 10–12 km north of Maichew town where the experimental farms were found at a geographical coordinate of 12.83500–12.84700°N latitude and 39.50900–39.53200°E longitude and at altitudinal ranges of 2975–3089 masl. The dominant soil types include Leptosols dominating the hillslopes and deep alluvial Vertisols in valley bottoms. The general slope range on which the farmlands occur varies between 0 and 30%, but could also be found on >30% slope range too. The annual average rainfall of Endamohoni is 681 mm and mean annual maximum and minimum temperature is 25 and 16°C, respectively. The rainfall characteristic of Endamohoni is also bimodal with July, August and September designating the main rainy seasons, and August is the month receiving the highest rainfall (Fig. 2). Endamohoni is characterized by undulating landscapes (Fig. 1) with 23, 67 and 10% of the landscape lies with a slope of <5, 5–30 and >30%, respectively.
Characteristics of Worreilu site
Yewol in Worreilu district is located in the Amhara region, about 60 km from Dessie town, 460 km north of Addis Ababa. It is located between 10.082 – 10.087 N latitude and 39.041 – 39.047 E longitude. Worreilu has an average altitude of 2730 m above sea level. Similarly, the dominant soil types include Leptosols dominating the hillslopes and Vertisols in valley bottoms. It is a cool highland with the maximum and minimum temperature of 23 and 9°C, respectively with a bimodal rainfall of about 700 mm per year, with most of the rain falling between July and September (Fig. 2). It has also undulating landscapes with various slope and landscape positions (Fig. 1).
Experimental design and procedures
Two complementary experiments were conducted for 3 consecutive years (2014, 2015 and 2016) to evaluate effects of three landscape positions on crop-nutrient responses and to identify the most limiting nutrient (N, P, K, S and Zn) in the respective landscapes.
Experiment 1
On-farm experiments were conducted in 2014 and 2015 cropping seasons by identifying volunteer farmers residing in various landscape positions. Through discussions with farmers, information about the history of the farm and management were documented and representative, low input farms were selected. The average fertilizer application in these locations is reported to be very low and only 10–20% of the farmers are using mineral fertilizers (Haregeweyn et al., Reference Haregeweyn, Poesen and Deckers2008). This combined with on-site observations enabled suitable on-farm sites to be selected. Farms around homesteads and gully-affected farms were excluded from the experiment to minimize variability within the landscape position. The landscapes were divided into various zones following Catena sequences (footslopes, midslopes and hillslopes) with slope ranges of 0–5; 5–15 and >15%, respectively. The experiments were conducted in two locations (Lemo and Endamohoni) with 45 farmers' fields per location. We have applied the same treatments in the same plots in 2014 and 2015. The 45 fields include three differing landscape positions and 15 farmers' replications per landscape position. However, only 12 farms per landscape position were considered for analysis. The analysis excluded three fields extensively damaged by animals (footslopes) or destroyed by severe erosion (hillslopes).
Each farm had five and six treatment plots in 2014 and 2015, respectively (Table 1). Each plot had a plot size of 25 m2 (5 × 5 m2) per treatment. Fertilizer treatments were designed based on an earlier study on wheat responses to different rates in the Ethiopian highlands (Habtegebrial and Singh, Reference Habtegebrial and Singh2009). The different nutrient combinations (N, P, K, S and Zn) (Table 1) were applied in the form of urea, diammonium phosphate (DAP), potassium nitrate, potassium sulfate and zinc sulfate. Half of urea and full DAP were applied as a basal application in the planting rows during sowing. The remaining urea, along with potassium nitrate, potassium sulfate and zinc sulfate was side dressed 45 days after planting.
Table 1. Types of treatments, and planting and harvesting dates of experiments 1 and 2 in Lemo, Endamohoni and Worreilu, in the years 2014, 2015 and 2016
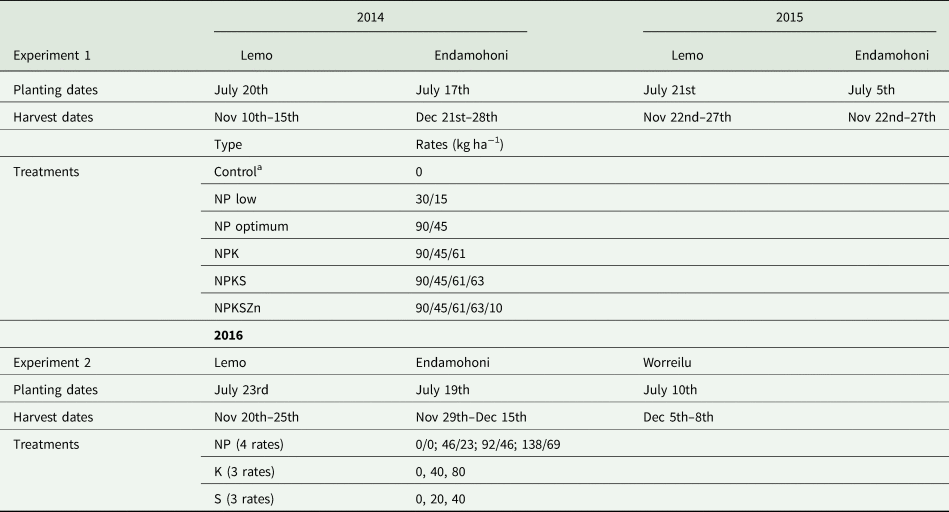
a Control with no fertilizer was included only in 2015.
In both locations, land was tilled three times by a pair of oxen before planting to minimize weed infestations. Planting was done by hand, making rows using a traditional hoe. The planting and harvesting dates, types of treatments and fertilizer rates are presented in Table 1. We used the same nationally released, widely adopted wheat variety, Hidasse, in all locations. Hand weeding was done three times during the cropping season starting from the 3rd week, mainly 43–44 days after planting. The seeding rate was 125 kg ha−1 across locations and treatments. Grain and biomass yield from each plot was determined by harvesting the central 20 rows, from a plot area of 12 m2 (4 × 3 m2). Threshing was done manually. Grain yield was measured after drying to 13% moisture content.
Experiment 2
Based on the results of 2014 and 2015 researcher managed follow-up, replicated experiments were conducted in 2016 in Endamohoni, Lemo and Worreilu to establish nutrient rates per landscape positions. There were four replications per treatment under each of the three landscape positions (hillslopes, midslopes and footslopes), and differing nutrient rates. The experimental design was a randomized complete block, comprising a factorial of four variables. The differing treatments of N, P, K and S are presented in Table 1. Potassium and sulfur had not been used in these landscapes in the past. The agronomic management, weeding, seed rates, timing and modes of application of all nutrients, size of harvested rows, harvesting methods and threshing followed similar procedures like that of Experiment 1.
Soil and plant analysis
Composite soil samples were collected from each landscape at six representative spots (one composite sample per representative farm), following the landscape strata. Soil samples were taken before planting to 25 cm soil depth using a standard auger. The upper litter materials were removed. Samples were oven dried, ground and passed through a 2 mm sieve for laboratory analysis. Mehlich-3 extraction was used for all essential elements for soil samples (nitrate nitrogen, ammonium nitrogen, phosphorus, potassium, sulfur, calcium, magnesium, sodium, copper, zinc, boron and aluminum), analyzed using multi-elemental ICP (inductively coupled plasma) in three replicates (Mehlich, Reference Mehlich1984). In addition, total nitrogen (Kjeldahl method) (Bremner, Reference Bremner1960), soil texture (Boycous Hydrometer Method), soil pH (pH meter 1:2 soil water ratio), electrical conductivity and organic carbon (Walkley and Black, Reference Walkley and Black1934) were determined. Organic matter was calculated by multiplying organic carbon by 1.724. Additional data on the soil carbon, clay content and soil water capacity of the target districts were extracted from the database of Soil Information Services (Hengl et al,. Reference Hengl, Heuvelink, Kempen, Leenaars, Walsh and Shepherd2015). Using GIS spatial analysis tools, data of soil properties was extracted from each grid (250 × 250 m2) within the study sites. The corresponding slope data for each grid were also extracted from the digital elevation model (DEM) of each site.
Quantification of nitrogen recovery fraction and crop water productivity
Nitrogen recovery fraction (NFR) was done following Moll et al. (Reference Moll, Kamprath and Jackson1982).
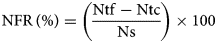 $$ {\rm NFR}\,( \% ) = \left({\displaystyle{{{\rm Ntf}-{\rm Ntc}} \over {{\rm Ns}}}} \right)\times 100$$
where Ntf (kg ha−1) = total above-ground N content at maturity of fertilized treatment, Ntc (kg ha−1) = total above-ground N content at maturity of control treatment, Ns (kg ha−1) = N supplied.
We estimated CWP using the water accounting principle (Molden et al., Reference Molden, Oweis, Steduto, Kijne, Hanjara, Bindrban and Molden2007), as follows:
 $${\bf CWP = }\displaystyle{{{\rm Kg}\,{\rm DM}{\rm ( grain) + Kg\,DM\,( stover) }} \over {{\rm Water}\,{\rm Used}}}$$
where: KgDM = weight of produce (in kilograms)
Water Used = crop water use to grow the crop (ET) (m3).
To calculate ET we used the reference evapotranspiration (ET0, mm day−1) and crop coefficient (K c) (FAO, 1998). The Penman–Monteith method was used to estimate ET0 and applied Angstrom's coefficients of 0.25 and 0.5 as presented in LocClim, version 1.06 (FAO, 2005). We used climatic data from the respective closet met stations, within 20 km radius. We used literature values for wheat crop coefficient to relate crop ET to ET0 and calculated ET (m day−1) from land use ß (m2) as given below:
 $${\rm ET@c}{\rm}= {\rm Kc } \times {\rm E}{\rm T}_{\rm O}{\rm {\ss}}$$
We assumed a composition of 50% grasses and legumes on grazing lands and applied mean K c values of known grasses growing in the study areas. The length of growing period was also estimated using LocClim (FAO, 2005) validated by key informants.
Statistical analysis
After checking the normality of the data using the normality test and scatter plot, the effects of fertilizer types, rates and landscape positions on crop yield, the data was analyzed using the SAS (9.0 version) ANOVA PROC-GLM procedure. Using PROC-CORR procedures, we have estimated relationships between the various crop, soil and landscape parameters, including slope, soil water content, soil organic matter, grain yield and biomass yield. Whenever treatment effects were significant, means were compared using Duncan's multiple range test (0.05). All graphs were designed using SigmPlot 12.0 procedures. The coefficient of variation (CV) was used to assess the spatial variability of soil parameters within landscape using SigmaPlot procedures. The crop response was calculated as the yield differences between high and low NP fertilizer rates within the same landscape position and location.
Results
Landscape and soil properties
The landscape features were highly variable (Fig. 1). There was a significant difference (P < 0.05) in CEC, pH, organic matter, N, P, K and Zn between landscape positions, regardless of locations (Table 2). Soils in the footslopes and midslopes had larger amounts of organic matter, N, K, P and Zn compared to hillslopes. The difference in soil characteristics between the landscape positions was more apparent in Endamohoni than in Lemo or Worreilu sites. Lemo soils, which were predominantly Nitosols, had significantly higher soil organic matter (4.8–5.5%) than Endamohoni or Worreilu soils regardless of landscape positions. Soil N content was generally low, though Lemo had significantly higher nitrogen content than soils in Worreilu or Endamohoni. On the other hand, CEC and exchangeable cations in Lemo were by 50% lower than the other two sites (Table 2). Moreover, soil K in Worreilu was the lowest, including in foot slopes, and by international standards close to the critical level (Hackmann, Reference Hackman2006).
Table 2. Selected soil parameters of Lemo, Endamohoni and Worreilu sites
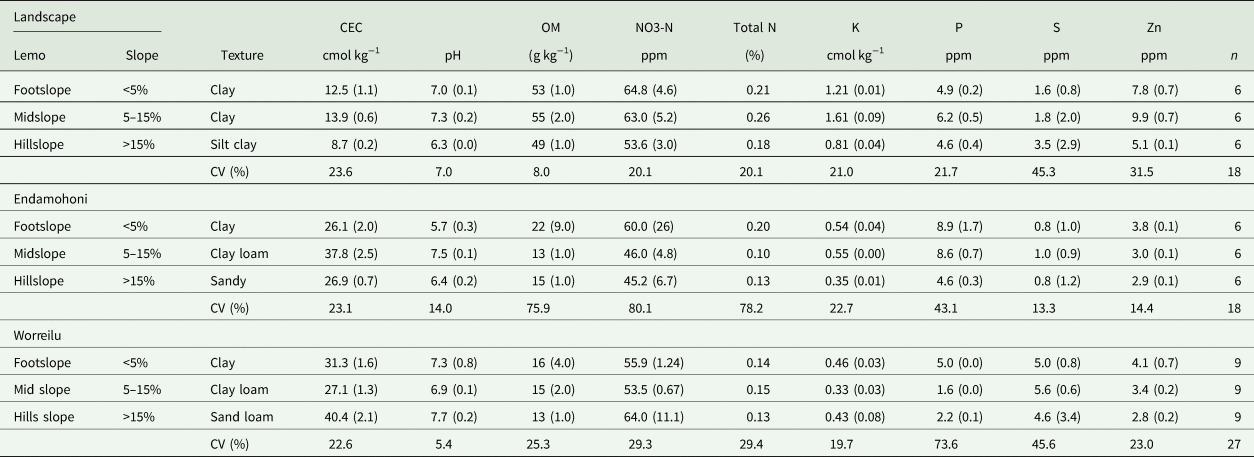
Mean values (SE) and CV (%).
There was a significant correlation between slope and clay content (Fig. 3a), slope and organic carbon (Fig. 3b) and slope and soil water content (Fig. 3c). A decrease of 10° of slope led to about 0.5% decrease in soil carbon content. The clay content of the soils was also affected by the slope, with clay content decreasing with increasing slope, with r 2 values of 0.86 and 0.60 in Endamohoni and Lemo, respectively. There was an increasing crop response with increasing organic matter content up to OM content of 4% but the further increase did not guarantee yield benefits (data not presented).
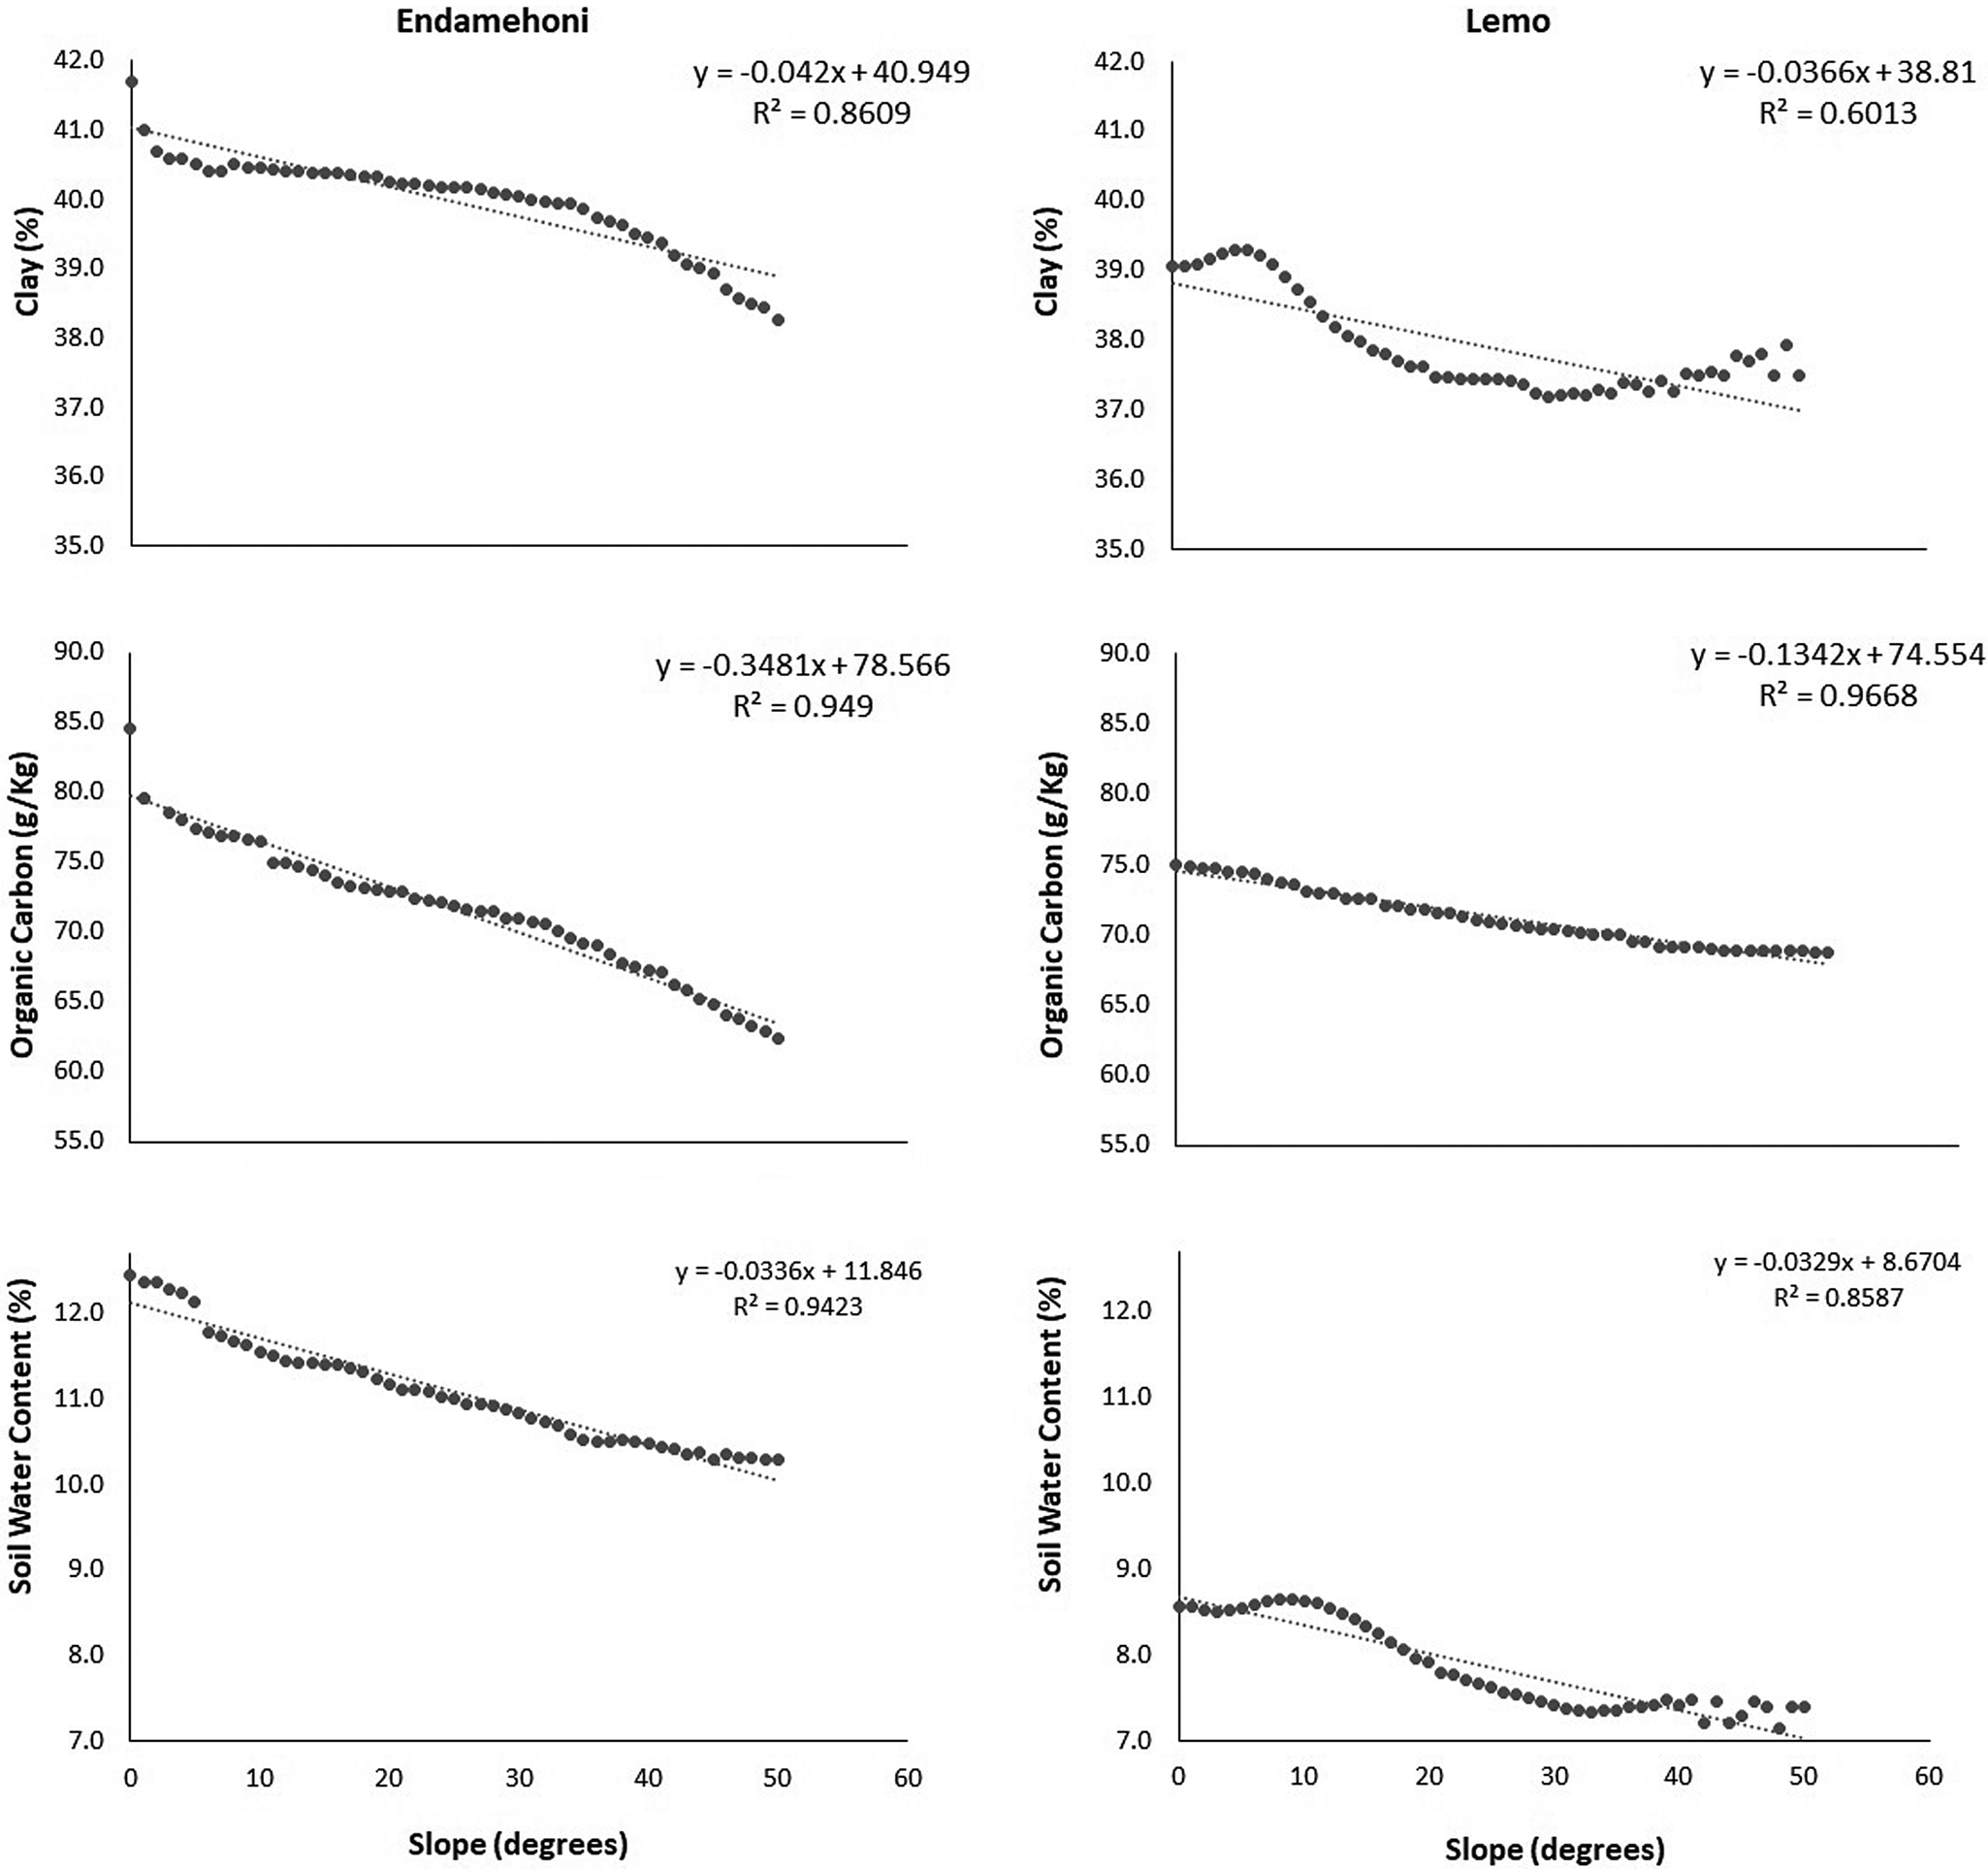
Fig. 3. Relationships between slope and clay content (a), slope and organic matter (b) and slope and soil water content (c) at district scales.
Crop response to nutrient applications
Experiment 1
The yield was significantly increased (P < 0.01) by application of NP nutrients, regardless of locations. Yield reduction due to low NP application was the highest in Endamohoni, with 53.4% and the lowest in Lemo with 37.4% (Fig. 4). The yield benefits of applying K was significant only in the dry years of 2015 in Endamohoni (P < 0.05), while the yield benefit of application zinc and sulfur fertilizers was not observed in both locations (Fig. 4). The variability (CV) in crop yield within location ranged from 24% in Lemo to 53% in Endamohoni. There was a statistically significant yield difference between locations (P < 0.001) and treatments (P < 0.001), though there was no significant interaction between locations and treatments. Yield differences between years were significant (P < 0.05). The year 2015 was a dry year (Fig. 2) with significant yield reduction in Endamohoni compared to 2014, with the highest reduction observed in the Footslopes (Fig. 4). Yield in Lemo was not affected by the reduced rainfall as there was still enough rain during the critical growth stages.
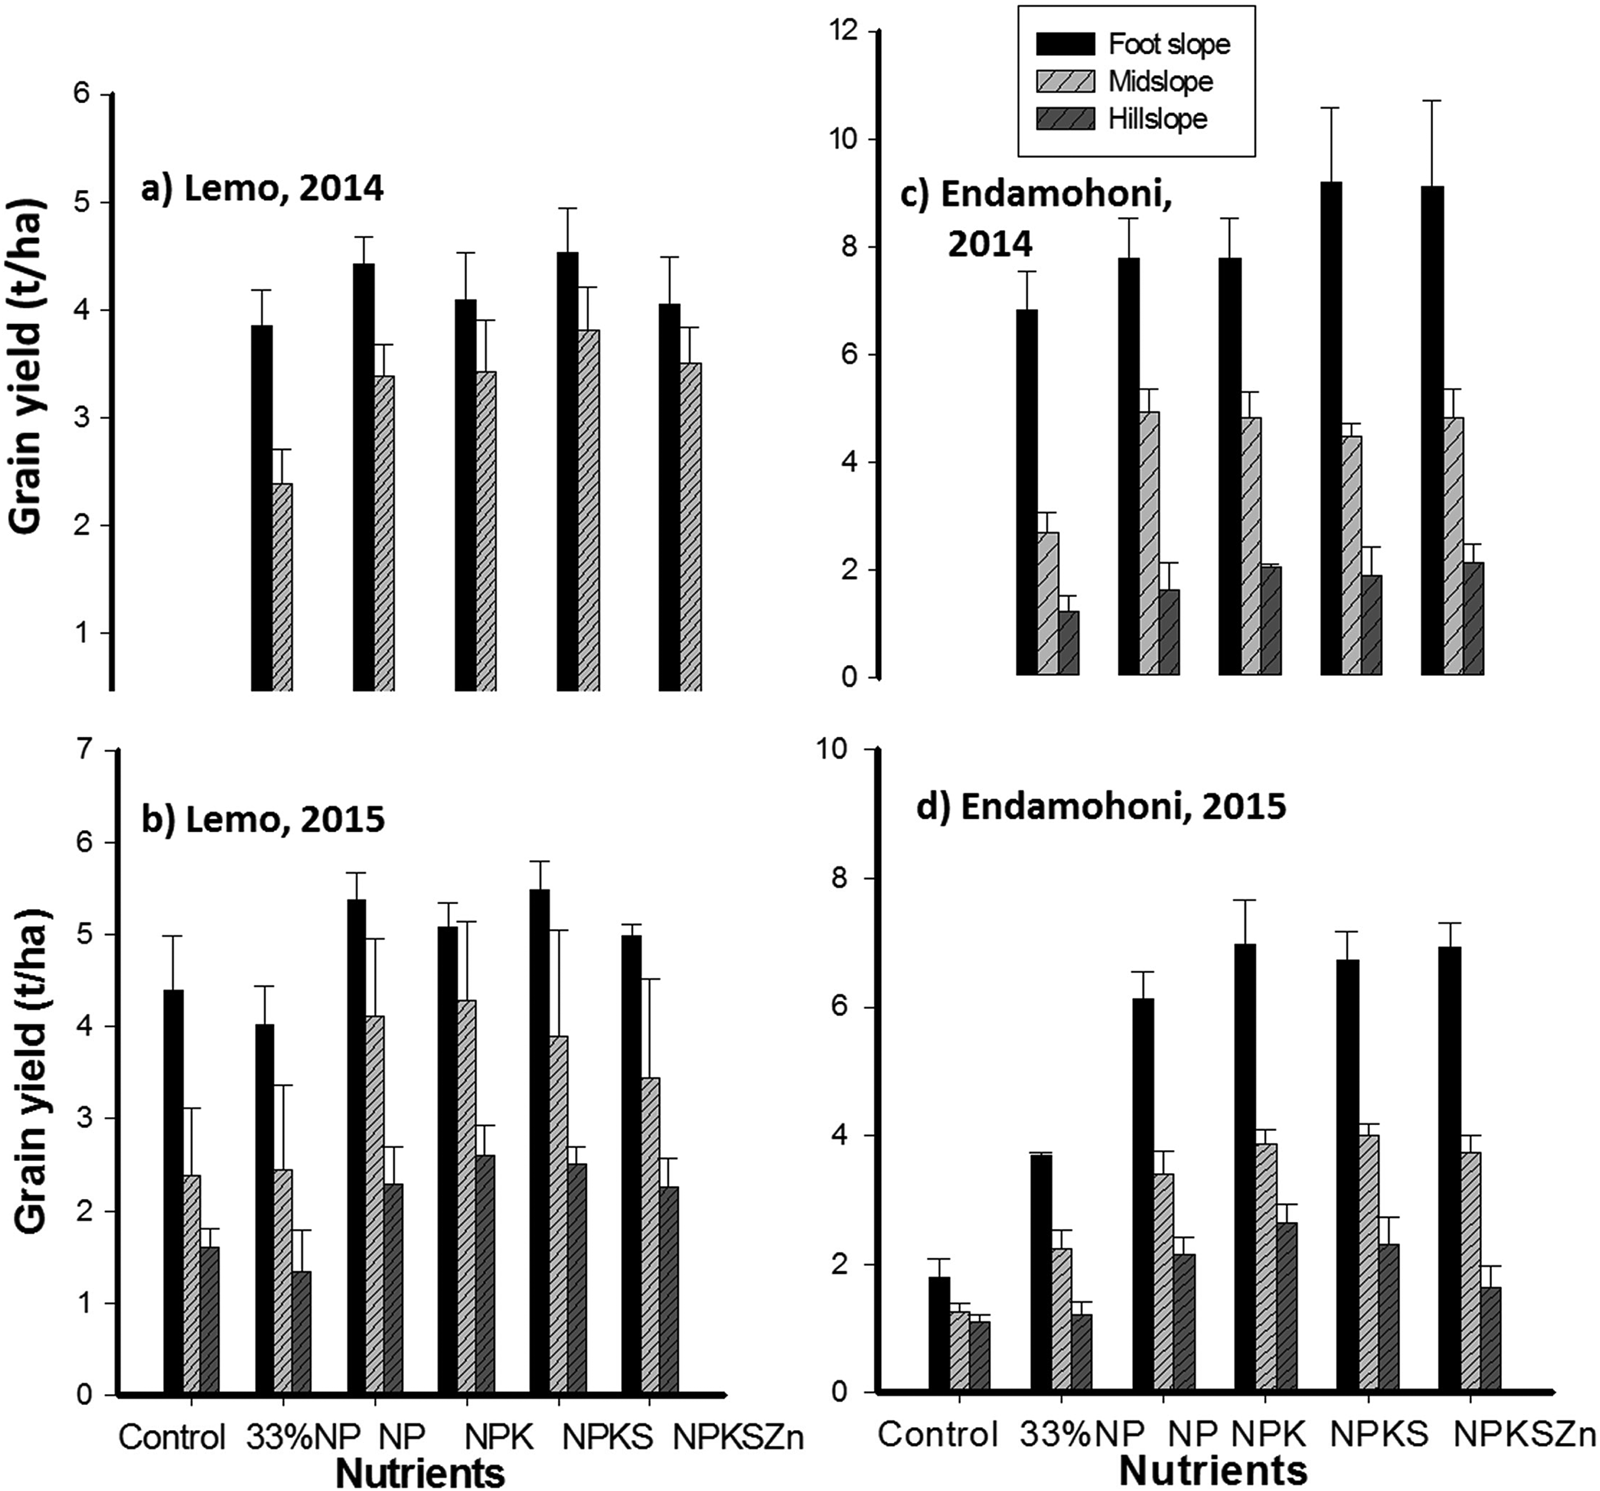
Fig. 4. Wheat grain yield in response to different combinations of fertilizers. Treatments include control (30/15 NP), NP (90/45), NPK (90/45/61), NPKS (90/45/61/63) and NPKSZn (90/45/61/63/10) in various landscape positions and years Lemo and Endamohoni 2014 and 2015 (N = 12).
The landscape position was the most dominant factor dictating crop fertilizer responses (P < 0001). The productivity in the hillslopes was significantly less (P < 0.001) than both mid slopes and foot slopes. The yield advantages of application of fertilizers were significantly higher (P < 0.001) in midslopes and footslopes than hillslopes, regardless of locations (Fig. 4). Yield in footslopes was mostly double compared to hillslopes and reached up to 3 times, as observed in Endamohoni (Fig. 4). The influence of landscape positions was significant even in the control plots (Figs. 4 and 6). This differential yield could be partly explained by the strong correlation between slope and factors that determine soil water supply (Fig. 3).
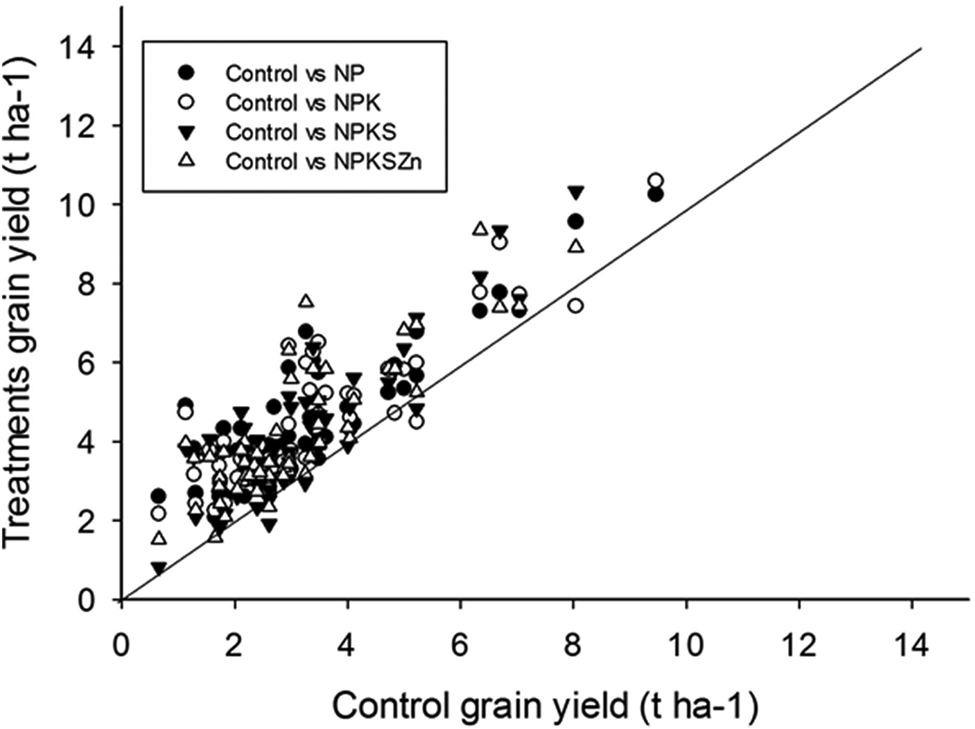
Fig. 5. Effects of different nutrient combinations on wheat yield across a range of controls in Lemo and Endamohoni. The control did not receive any amounts of nutrients.
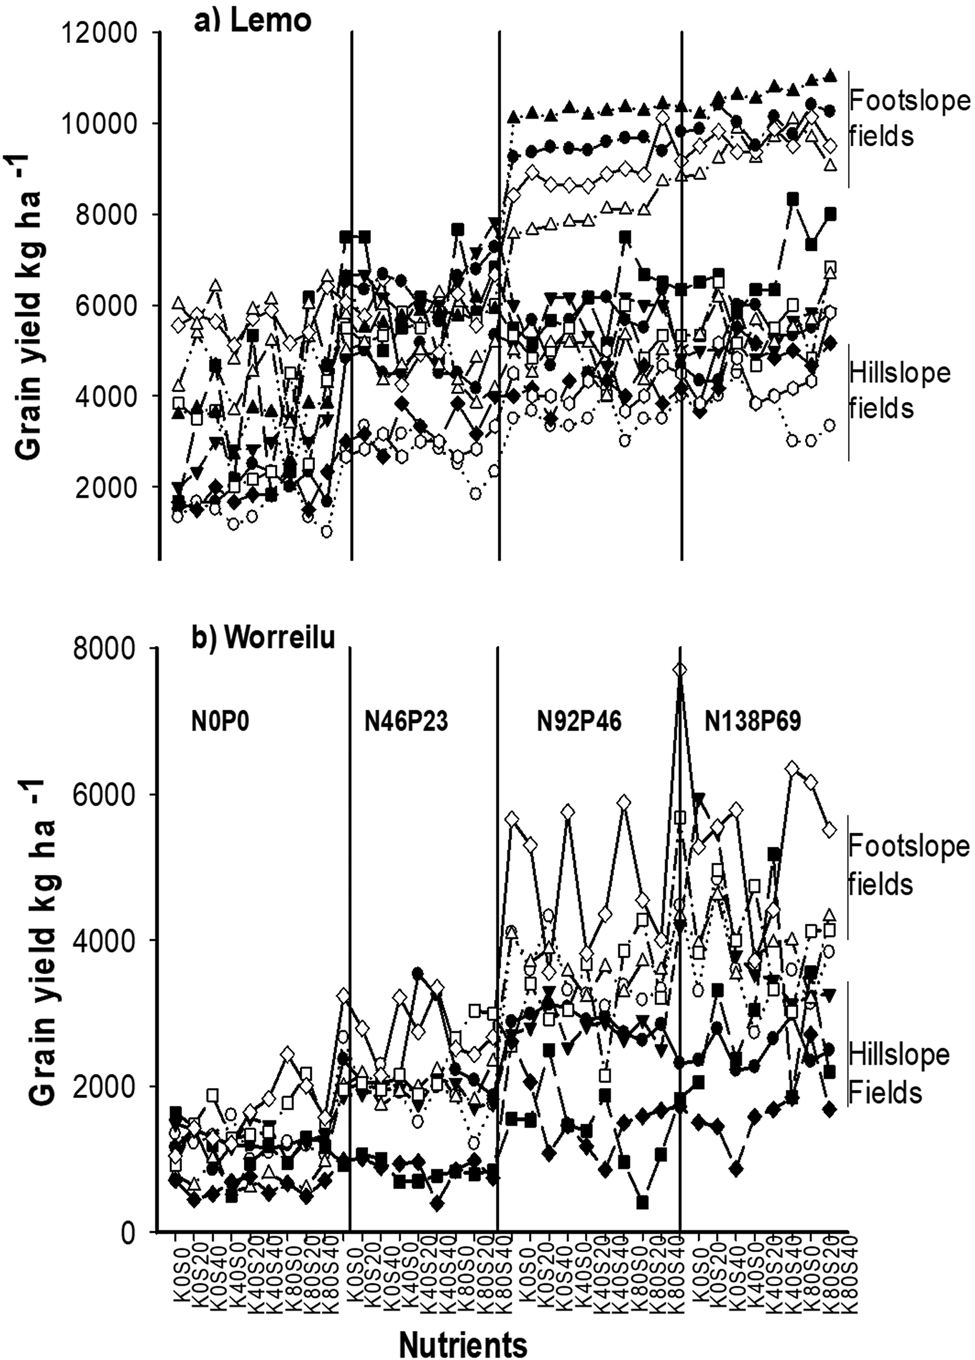
Fig. 6. Crop response curves to fertilizer application in Lemo, and Worreilu, 2016 across different fertilizer types, fertilizer rates and landscape positions.
Experiment 2
Similarly, yield was significantly increased by increasingly higher application rates of NP nutrients (Fig. 6). There was also a significant yield difference (P < 0.001) between landscapes, locations and nutrient types and rates (Table 3). Landscape positions have significantly affected yield response to differing NP (P < 0.001) and K (P < 0.05) application rates. A significantly larger yield increase was obtained by the application of NP 138/69 followed by NP 92/46 kg ha−1 across locations (P < 0.05), regardless of the landscape position (Fig. 6). The application of sulfur did not also increase grain yield in Endamohoni and Lemo (Fig. 4) but in the Worreilu location, particularly in the footslopes and when applied with N92P46 (Fig. 6).
Table 3. Anova of wheat grain yield response to various rates of NPKS fertilizer application in Endamohoni, Worreilu and Lemo sites
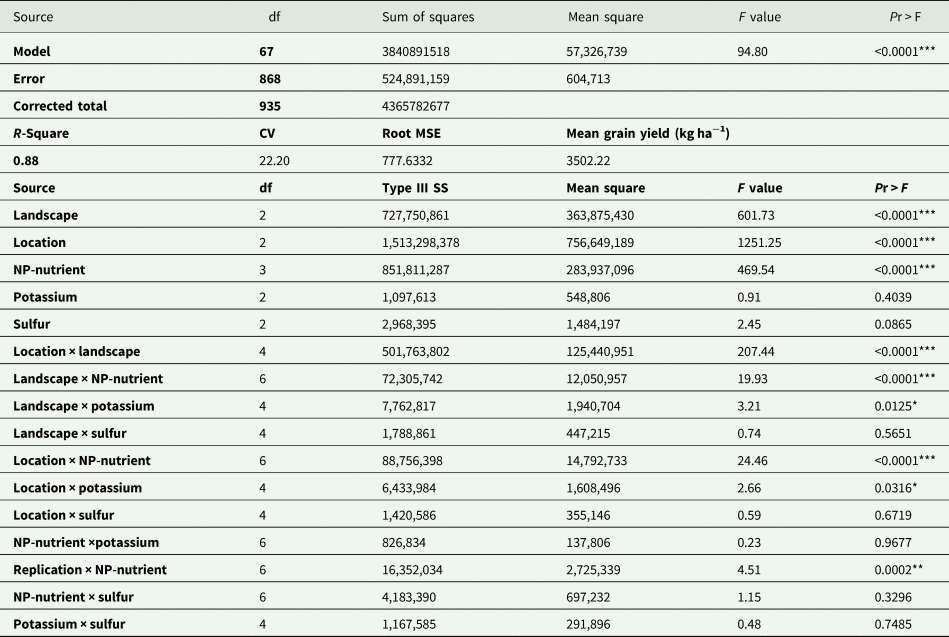
In 2016, yield in Lemo was significantly higher than in the previous years, particularly in footslope farms, potentially due to an extended and good rainfall distribution. The yield in Worreilu was significantly lower than in Lemo (P < 0.05), with the highest difference between the two locations being observed in control plots. The yield difference among the various landscape positions was highly pronounced at higher fertilizer NP application rates in both Lemo and Worreilu (Fig. 6), indicating that crop responses to fertilizer application could be more affected by landscape-related factors at higher NP rates than at lower rates. However, the response in footslopes of Worreilu was lower than in Lemo due to waterlogging effects of vertislols.
In general, the yield difference between the highest and lowest yielding farms was higher in Endamohoni than in Lemo or Worreilu partly due to its highly variable landscapes. On the other hand, yield variability due to seasons was the highest in Lemo, where the highest rates of fertilizer application yielded about 10 and 3.9 t ha−1 in 2016 and 2014, respectively (Figs. 4 and 6).
Nitrogen recovery fraction as affected by landscape positions
NRF for the year 2015 varied from 5 to 50% depending on nutrient types, combinations and landscape positions. It was significantly correlated with grain yield (P < 0.0001) whereby NRF increased with increasing crop yield (data not presented). There was also a significant difference in NRF between the different sites and landscape positions. NRF was significantly higher in Endamohoni than in Lemo, and within Endamohoni the highest NRF was recorded in footslopes treated with N, P, K, S and Zn followed by N, P, K and S treatments (Fig. 7). On the other hand, treatments with low NP application had significantly higher NRF than well fertilized plots across locations. However, there was no significant difference in NRF between the different landscape positions in Lemo in 2015, though the trend has changed in the relatively wet year of 2016 (data not presented).
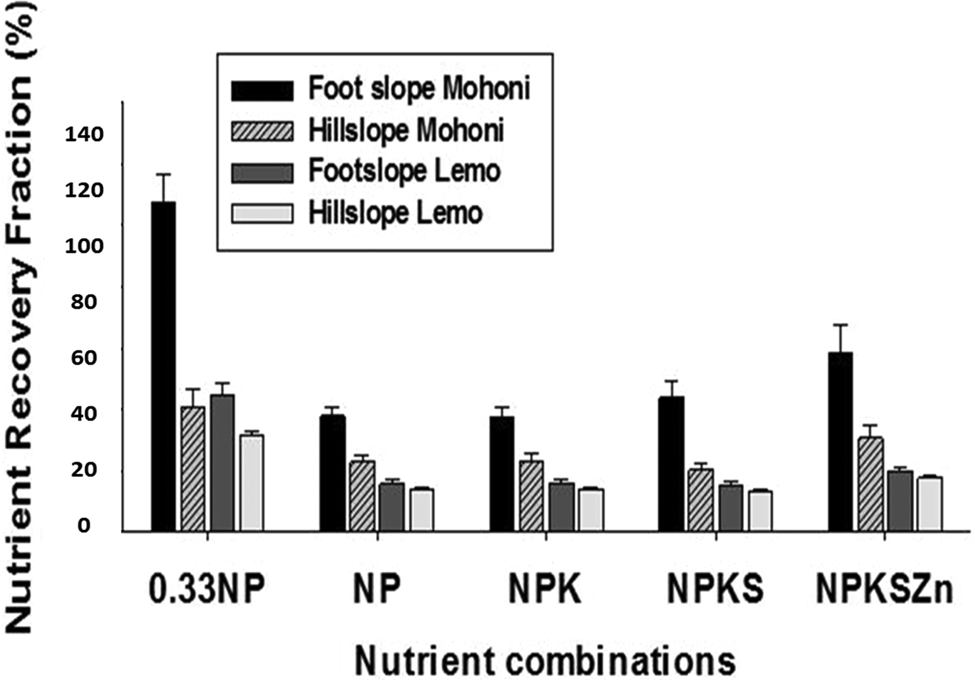
Fig. 7. NRF (%) in two landscape positions in Endamohoni (labeled as Mohoni) and Lemo districts, 2014 (N = 12).
Crop water productivity
CWP varied with locations, nutrient types and landscape positions (Fig. 8). The CWP was significantly higher in the footslopes than other landscape positions (P < 0.001), regardless of locations, with the largest difference recorded in Endamohoni. CWP estimations showed that Endamohoni got higher CWP values than Lemo given higher grain yield under lower rainfall amounts. Treatments with lower rates of fertilization application got the lowest CWP across sites and treatments. Generally, water productivity increased with an increasing fertilizer rate and it followed an opposite trend to nutrient use efficiency. In general, footslopes produced higher yield per unit of water used.

Fig. 8. Crop water productivity in two landscape positions in Endamohoni (labeled as Mohoni) and Lemo districts, 2014 (N = 12).
Discussion
Differential responses to landscape position
The undulating landscapes of East African highlands demonstrate variable crop responses to application of fertilizers. Our results showed that the crop fertilizer response was predominantly dictated by landscape positions. Yield differences between landscape positions within the same locality ranged between 0.9 and 5.5 t ha−1, depending on locations and input levels (Fig. 4). Landscape positions had also significantly stronger influence on crop yield than did fertilizer treatments (P < 0.01). This could be associated with differential soil formation processes (Milne, Reference Milne1935; Dahlgren et al., Reference Dahlgren, Bottinger, Huntington and Amundson1997). The possible changes in soil types across the catena (Milne, Reference Milne1935; Dahlgren et al., Reference Dahlgren, Bottinger, Huntington and Amundson1997; Balasundram et al., Reference Balasundram, Robert, Mulla and Allan2006), which alter the soil nutrient complex, altered crop influence to application of various combinations of fertilizers as observed in Figures 4 and 6. About 90% of the soils in the hillslopes of Ethiopian highlands are Leptsols (Elias, Reference Elias2016), which are characterized by stony and very shallow topsoils, with poor nutrient status and low soil water holding capacity. This partly explains low crop response to nutrient applications. In agreement with our findings, Dahlgren et al. (Reference Dahlgren, Bottinger, Huntington and Amundson1997) reported that slope gradient was a potential determinant in generating differences in soil fertility by potentially affecting soil nutrient availability and plant water availability throughout the cropping season. Moreover, soil organic carbon (SOC) decreased with increasing slope (Figs. 3b and 3c), which further affect the soil water holding capacity (Hudson, Reference Hudson1994), nutrient availability (Dahlgren et al., Reference Dahlgren, Bottinger, Huntington and Amundson1997) and erodibility of soils by water. The low crop response to fertilizer application in the hillslope could also be partly explained by depleted organic matter and shallow soils (Moges and Holden, Reference Moges and Holden2008) and lower clay content (Fig. 3), which led to reduced soil water content, and lower CWP (Fig. 8). On the other hand, stronger crop yield in the footslopes could be due to deeper topsoils, higher clay content and higher SOC (Table 2, Fig. 3) leading to increased water infiltration and more stored water after rainfall. The strong relationship between crop response and soils organic matter content reveals the opportunity for improved management of SOC for enhancing nutrient use efficiency. However, SOC alone should not necessarily be considered as a defining factor for crop fertilizer responses (Kihara et al., Reference Kihara, Nziguheba, Zingore, Coulibaly, Esilaba, Kabambe and Huising2016), as Lemo with the highest SOC (Table 2) was not necessarily the most responsive site to nutrient application. Moreover, the yield advantage of footslopes could diminish in very wet years or poorly drained valley bottoms due to water logging induced nutrient leaching and denitrification.
We also recognize the fact that there is evidence showing yield variability within a landscape (Wezel et al., Reference Wezel, Steinmüller and Friederichsen2002; Basso et al., Reference Basso, Cammarano, Chen Cafiero, Amato, Bitella, Rossi and Basso2009; Mckenzi, Reference McKenzi2012) or a farm (Tittonell et al., Reference Tittonell, Vanlauwe, Corbeels and Giller2008; Tittonell and Giller, Reference Tittonell and Giller2013). The variability within a landscape could be predominantly ascribed to slope, whereby a farm in plateau of hillsides could share similar soil characteristics like that of footslopes, except that it may not receive sediment load from upstream. The variability within landscapes could also be created by farmers' management practices (Tittonell et al., Reference Tittonell, Vanlauwe, Leffelarr, Rowe and Giller2005; Zingore et al., Reference Zingore, Murwira, Delve and Giller2007; Vanlauwe et al., Reference Vanlauwe, Descheemaeker, Giller, Huising, Merckx, Nziguheba, Wendt and Zingore2015). In our sites, some farms within the same landscape position were recently terraced while others not (e.g., Endamohoni); some farms received more manure and crop residue than others (e.g., Lemo), which would create variability within a segment of a landscape.
Landscape heterogeneity affected resource use efficiencies across the sites, possibly through effects on the efficiency of resource capture (Tittonell et al., Reference Tittonell, Vanlauwe, Corbeels and Giller2008). The significantly high (P < 0.05) variability in NRF (Fig. 7) and CWP (Fig. 8) across the landscape positions also suggested the need for implementing a spatially tailored crop management plan (Basso et al., Reference Basso, Cammarano, Chen Cafiero, Amato, Bitella, Rossi and Basso2009) which at the same time may reduce downstream water pollution. In general, in undulating, mountainous landscapes, where soil erosion was a dominant driver of change (Hurni et al., Reference Hurni, Zeleke, Kassie, Tegegne, Kassawmar, Teferi, Moges, Tadesse, Ahmed, Kebebew, Hodel, Amdihun, Mekuriaw, Debele, Deichert and Hurni2015; Vanlauwe et al., Reference Vanlauwe, Descheemaeker, Giller, Huising, Merckx, Nziguheba, Wendt and Zingore2015), the importance of landscape variability cannot be understated (Milne Reference Milne1935; Balasundram et al., Reference Balasundram, Robert, Mulla and Allan2006; Miller et al., Reference Miller, Burras and Crumpton2008; Thelemann et al., Reference Thelemann, Johnson, Sheaffer, Banerjee, Cai and Wyse2010). These causes of variability deserve a follow-up and thorough investigation.
Crop fertilizer responsiveness
Crop yield in the fertilized plots was higher than control plots (Fig. 5) regardless of year or location. However within location, yield variability could not be solely explained by soil nutrient deficiency as application of higher rates of combination of nutrients failed to bring about proportional yield increment in hillside farms. In agreement with our findings, Tittonell et al. (Reference Tittonell, Vanlauwe, Corbeels and Giller2008) reported that given the prevalence of various yield limiting factors in the various agroecologies and farm types, variable crop performance within and across farms in Kenya was not ascribed solely to soil nutrient status. It implied that in nutrient deficient soils, the potential benefits from adding nutrients could be hampered by soil water deficit and geomorphological traits. A similar finding was also reported in maize-based systems (Phiri et al., Reference Phiri, Kanyama-Phiri and Snapp1999).
The nutrient response curves (Fig. 6) showed that the difference in the crop response between landscape positions was significantly strong (P < 0.05) with higher rates of nutrient applications (N92P46 and higher). This implied that at lower rates of NP application, the difference between landscape positions would diminish (Fig. 6). The results also indicated that fertilizer-induced yield difference between farms was pronounced in years of optimum rainfall (Lemo 2014 and 2016) and higher NP rates (Fig. 6), indicating both soil water scarcity and nutrient deficiency of the respective locations. In one location (Endamohoni), there was a significant yield increment due to K application in the drought year (2015). In another (Worreilu) there was no crop response to K application (Fig. 6b) despite low levels of soil K (Table 2). The positive yield response to K in Endamohoni could be explained by the potentially positive effects of potassium in maintaining plant water potential (Amede et al., Reference Amede, von Kittlitz and Schubert1999; Jakli et al., Reference Jákli, Tränkner, Senbayram and Dittert2016). The yield benefit of potassium in Ethiopian highlands has also been demonstrated in potato and other tuber crops (Wassie and Mamo, Reference Wassie and Mamo2013). Although there were conflicting claims and promotion for application of sulfur fertilizers in the wheat-belt Ethiopian highlands, there was limited evidence to suggest S was limiting for wheat, except in the Vertisols of Worreilu. Addition of micronutrients, including zinc, has also been known to improve wheat yield and nutritional quality of grains elsewhere (Cakmak, Reference Cakmak2008). However, there was no evidence of Zn responses (Fig. 4). This is to be expected from nutrient deficient soils, as agronomic yield benefits from other nutrients are rarely achieved before the demand for major macronutrients is satisfied (Marschner, Reference Marschner1995). However, there could be human nutritional benefits in terms of higher grain zinc content due to zinc applications (data not presented).
The poor, low responsive soils, which are predominantly in hillslopes, are the most challenging and require specific management (Tittonell and Giller, Reference Tittonell and Giller2013; Agegnehu and Amede, Reference Agegnehu and Amede2017) since applying fertilizers to address those limitations is ineffective in the short-term (Kihara et al., Reference Kihara, Nziguheba, Zingore, Coulibaly, Esilaba, Kabambe and Huising2016). This has a crucial implication on the land management policy in relation to crop choice, types and amounts of fertilizers and management practices. Therefore, farmers should be assisted in developing strategies that capitalize on the potential of the specific landscape position in which they operate to optimize economic profitability, environmental health and ecosystem functions.
As indicated in Fig. 4, the standard error within the landscape position was also very low with CV below 2% leading to conclusion that this zone could be considered as a target for employing similar management options. This study is in agreement with earlier studies and suggests that management zones along with the conventional grid-based soil sampling could be used to develop plausible fertilizer recommendations (Khosla and Alley, Reference Khosla and Alley1999; Fleming et al., Reference Fleming, Westfall, Wiens and Brodahl2000). Those spatially similar areas within landscapes could be used for crop performance evaluations (Bleas et al., Reference Bleas, Chome, Lambert, Traore, Schut and Defourny2016). The process of describing and analyzing landscape terrain features, such as hillslope length and gradient, water retention and flow patterns and soil properties have become more accurate and precise to suggest recommendations than conventional approaches (Thelemann et al., Reference Thelemann, Johnson, Sheaffer, Banerjee, Cai and Wyse2010).
Conclusion
We found very strong differences in crop response to mineral fertilizers among landscape positions.
The implication of this research is that yield potential is lower in such hillslope soils, regardless of season and therefore nutrient recommendations should consider this context. Application of manure, crop residues, green manures and other alternative sources could help to improve soil quality and allow crop to grow better and respond more to applied nutrients. On the other hand, the footslopes will keep producing relatively higher yield with application of optimum fertilizer rates. In these poorly managed landscapes, the landscape position could be a proxy indicator of soil fertility status (Dahlgren et al., Reference Dahlgren, Bottinger, Huntington and Amundson1997; Mckenzi, Reference McKenzi2012; Gebrelibanos and Assan, Reference Gebrelibanos and Assen2013). However, we recognize that these recommendations should consider farmers' yield objectives. We also suggest further research to validate this work in other nutrient-demanding cropping systems (e.g., maize-based systems, sorghum-based systems). The key policy challenge is knowing whether the actual demand in these types of variable landscapes is hindered by low fertilizer use efficiency, market failures or the fact that the profitability of fertilizer use is just too low to justify its use (Tamene et al., Reference Tamene, Amede, Kihara, Tibebe and Schulz2017). Our findings have confirmed the latter that there is very limited incentive for farmers to invest in inputs in sloping and undulating fields given the very low crop response and associated low profitability.
Acknowledgement
We would like to thank Feed the Future, USAID (through AfricaRISING) and BMZ-Germany (through GIZ- ISFM+project, Ethiopia) for financing the work. We thank Prof. Ken Giller for his critical reviews. The site coordinators, namely Addis Asfaw, Mohamed Ebrahim, Temesgen Alene and Workneh Dubale and their assistants (Eyuel Tesfaye, Endeshaw Tadesse, Getachew Bisrat, Shimelis Mengistu and Fikadu) have made a substantial contribution in managing the field experiments with farmers. Staffs of Debre Berhan University, Maichew ATVET College and Mede Welabu University have supported us in managing the experiments in their respective locations. Drs Sridhar Gumadi and Job Kihara provided useful comments on the initial draft of the paper.


 Open access