


1. Local Foods and Economic Development
Local food systems are frequently touted as economic development strategies for rural communities by local economic development practitioners and as official policy of the U.S. Department of Agriculture (USDA). The argument is made that by consuming locally produced foods residents will keep more dollars in their community (Hughes et al., Reference Hughes, Brown, Miller and McConnell2008; Swenson, Reference Swenson2006, Reference Swenson2011). Although the argument has some appeal, the reality is that it depends on the economics of local food production and the linkages between local producers and the rest of the local economy. This article aims to add to this growing body of literature.
As Martinez et al. (Reference Martinez, Hand, Da Pra, Pollack, Ralston, Smith and Vogel2010, p. iii) conclude, there is no universally accepted definition of local food systems, but “definitions based on market arrangements, including direct-to-consumer arrangements such as regional farmers’ markets, or direct-to-retail/foodservice arrangements such as farm sales to schools, are well-recognized categories” and are therefore used in their report. Using this definition has important implications for economic impact analyses because (1) direct marketing producers are generally smaller than the average farm and (2) these marketing arrangements imply that the linkages to the local economy are quite different than those of conventional arrangements, and these conventional arrangements dominate the interindustry relationships in most economic impact models. An alternative to this definition based on market arrangements is a geographic- or distance-based definition. Using this definition, any food produced within a geographic region, no matter how it is produced or marketed, is considered local food. This definitional issue leads to an important division between estimates of economic impact analyses in the research literature.
A related issue is the basis of estimates of interregional linkages between food producers and their local economies. If local food producers are defined as those that produce food that is subsequently consumed locally, and this food is produced and marketed exactly the way that “exported” food is produced and marketed, then there is no need to look for differences in the ways that local and nonlocal food producers are linked to the local economy. If, on the other hand, local food producers are defined differently from food producers in general, then the differences are central to the analysis.
Another important consideration is that most economic changes have offsetting effects somewhere in the regional or larger economy. Increased purchases of goods or services necessarily displace the purchases of others. In the case of local foods, the increased sales of locally produced vegetables will typically reduce the sales of conventionally produced products (Hughes et al., Reference Hughes, Brown, Miller and McConnell2008; Swenson, Reference Swenson2006). If a consumer purchases tomatoes from a farmers’ market, he or she is unlikely to purchase tomatoes at the grocery store. As a result, increased sales of locally produced food will be at least partially offset by reduced sales of nonlocally produced food.
Furthermore, local food producers must devote labor, land, and financial resources to the production and sale of local foods. The net effect on the producers and the local economy thus depends on the local producers’ profitability and linkages with input suppliers (Swenson, Reference Swenson2006). If these aspects of local food production are not known, then it is impossible to know with certainty if local economies benefit economically from local compared to conventional food systems.
Given these definitional and methodological issues, research on the economic impacts of local food systems can be roughly divided into those that define local foods on the basis of their marketing methods (Boys and Hughes, Reference Boys and Hughes2013; Henneberry, Whitacre, and Agustini, Reference Henneberry, Whitacre and Agustini2009; Holland et al., Reference Holland, Thompson, Godwin, Pavlovich and Stewart2015; Hughes and Boys, Reference Hughes and Boys2015; Hughes and Isengildina-Massa, Reference Hughes and Isengildina-Massa2015; Hughes et al., Reference Hughes, Brown, Miller and McConnell2008; Jablonski and Schmit, Reference Jablonski and Schmit2016; Jablonski, Schmit, and Kay, Reference Jablonski, Schmit and Kay2015; Kane et al., Reference Kane, Wolfe, Jones and McKissick2010; Martinez et al., Reference Martinez, Hand, Da Pra, Pollack, Ralston, Smith and Vogel2010; Otto and Varner, Reference Otto and Varner2005; Swenson, Reference Swenson2006) versus those that define local foods as any food produced and consumed locally (Conner et al., Reference Conner, Knudson, Hamm and Peterson2008; Miller et al., Reference Miller, Mann, Barry, Kalchik, Pirog and Hamm2015; Sharp et al., Reference Sharp, Clark, Davis, Bean Smith and McCutheon2011; Swenson, Reference Swenson2009, Reference Swenson2011; P. Watson, D. Kay, G. Alward, S. Cooke, and A. Morales, unpublished). This distinction is important because the linkages between the sellers and their communities can be quite different. For example, defining local foods on the basis of the seller's marketing method may exclude food produced locally but marketed through conventional channels and include nonlocally produced foods sold through farmers’ markets or other direct marketing channels. The marketing method approach can also overlook barter-based and other informal marketing channels.
Research can also be divided between those that used survey-based data on local food producers and/or consumers (Henneberry, Whitacre, and Agustini, Reference Henneberry, Whitacre and Agustini2009; Jablonski and Schmit, Reference Jablonski and Schmit2016; Jablonski, Schmit, and Kay, Reference Jablonski, Schmit and Kay2015; Otto and Varner, Reference Otto and Varner2005) versus those that used data on conventional producers (Conner et al., Reference Conner, Knudson, Hamm and Peterson2008; Holland et al., Reference Holland, Thompson, Godwin, Pavlovich and Stewart2015; Martinez et al., Reference Martinez, Hand, Da Pra, Pollack, Ralston, Smith and Vogel2010; Miller et al., Reference Miller, Mann, Barry, Kalchik, Pirog and Hamm2015; Sharp et al., Reference Sharp, Clark, Davis, Bean Smith and McCutheon2011; Swenson, Reference Swenson2008; Watson et al., unpublished). A third group of studies modified the intersectoral relationships of conventional producers to better reflect the economic linkages of local food producers (Hughes and Isengildina-Massa, Reference Hughes and Isengildina-Massa2015; Hughes et al., Reference Hughes, Brown, Miller and McConnell2008; Kane et al., Reference Kane, Wolfe, Jones and McKissick2010; Swenson, Reference Swenson2006, Reference Swenson2008, Reference Swenson2009, Reference Swenson2011).
A third distinction among empirical research in this field is whether the analysis accounted for displacement effects or not. The study by Conner et al. (Reference Conner, Knudson, Hamm and Peterson2008) considered the displacement of field crops, but not the potential displacements in the conventional marketing system. Hughes et al. (Reference Hughes, Brown, Miller and McConnell2008) assume that purchases at farmers’ markets directly offset spending at grocery stores and building material and garden supply stores in West Virginia. Hughes and Isengildina-Massa (Reference Hughes and Isengildina-Massa2015), based on their consumer survey, estimate that if the money had not been spent at farmers’ markets, 41% would have been spent at grocery stores, 21% would have been spent on nonfood items, 20% would have gone to savings, and 18% would have been spent at restaurants. Jablonski, Schmit, and Kay (Reference Jablonski, Schmit and Kay2015) accounted for offsets in purchases of conventional food products. This was modeled as a decrease in wholesale trade–based sectors. In their report, Kane et al. (Reference Kane, Wolfe, Jones and McKissick2010) point out that they ignored the displacement of conventional sales. They also ignored any displaced production. The approach used by Swenson (Reference Swenson2008, Reference Swenson2009, Reference Swenson2011) calculates the amount of corn and soybeans displaced by increased acreage of crops grown for local food consumption. Swenson's Reference Swenson2009 and Reference Swenson2011 studies reduce imports by a value equal to the increased local food consumption, but the 2008 study does not consider the displacement of expenditures required to increase the nutritional intake of residents. Studies by Henneberry, Whitacre, and Agustini (Reference Henneberry, Whitacre and Agustini2009), Holland et al. (Reference Holland, Thompson, Godwin, Pavlovich and Stewart2015), Miller et al. (Reference Miller, Mann, Barry, Kalchik, Pirog and Hamm2015), Otto and Varner (Reference Otto and Varner2005), Sharp et al. (Reference Sharp, Clark, Davis, Bean Smith and McCutheon2011), and Watson et al. (unpublished) did not consider the displacement effects. This last category of studies measures the size of the sector's imprint on the economic activity, but not the net contribution to sales, income, or employment.
In this study, we analyze survey data from local food producers in three Midwest communities and use it to estimate the net local economic impacts of local food systems. We then compared this with a conventional food system assuming equivalent levels of food purchases. We measured economic impacts using three metrics: (1) regional sales, (2) number of jobs created, and (3) contribution to gross domestic product (GDP). We estimated the indirect or multiplier effects of both local and conventional food systems using input-output analysis. We found that on the basis of most indicators, local food systems had net positive effects on their local economies.
2. Survey Design and Sample Selection
The data for this analysis come from a survey of local food producers in Missouri and Nebraska carried out in early 2012. The selection of these regions was guided by the typology of rural places as described by the Carsey Institute (Hamilton et al., Reference Hamilton, Hamilton, Duncan and Colocousis2008). The Old Trails region located near Kansas City, Missouri, represents communities with amenity-driven growth coupled with a resource-related decline. Two more rural and isolated regions are the chronically poor North Ozarks region of southern Missouri and the declining resource-dependent, rural Southeast Nebraska region. Hamilton et al. defined chronically poor regions as those plagued by years of mismanagement of resources and investment coupled with intergenerational poverty.
The authors chose to focus on rural areas of Missouri and Nebraska for several reasons. Local food systems are more apparent and more fully developed in urban or periurban areas (Low et al., Reference Low, Adalja, Beaulieu, Key, Martinez, Melton and Perez2015); Malone and Whitacre (Reference Malone and Whitacre2012) found that rural counties were underrepresented in local food sales as documented by the USDA, with sales highest in counties with higher population densities and median incomes. Both Low et al. and Malone and Whitacre document limited local food system participation in the Great Plains, the South, and the lower Midwest. Rural food systems in and of themselves have not received the same attention as those in urban settings, with exceptions like Morton et al. (Reference Morton, Bitto, Oakland and Sand2008), Biermacher et al. (Reference Biermacher, Upson, Miller and Pittman2007), and Gasteyer et al. (Reference Gasteyer, Hultine, Cooperband and Curry2008), even though local food systems have been promoted as a rural development tool. The focus on urban food systems—or supply chains that end with urban consumers—has sometimes excluded low-income rural communities and indigenous populations from the benefits of food system development efforts (Elliott et al., Reference Elliott, Jayatilaka, Brown, Varley and Corbett2012; McEntee, Reference McEntee, Alkon and Agyeman2011). These project areas were chosen to remedy these omissions and to build on the significant on-the-ground experience and extension relationships the authors possessed.
According to the U.S. Census of Agriculture, in 2012, Missouri had 4,096 farms participating in direct-to-consumer (DTC) sales, which represents 4% of all farms in Missouri and is a decrease of 5% from the number of farms doing direct sales in 2007. Nebraska had 1,537 farms selling directly, representing a little more than 3% of all Nebraska farms and an increase of nearly 20%. The regions in which we conducted our research account for a little more than 6% of all Nebraska farms (including an estimated 7% of the total DTC farms) and nearly 10% of Missouri farms (including an estimated 11% of total DTC farms). Interestingly, the Southeast Nebraska region gained farmers overall from 2007 to 2012, whereas the Missouri regions lost farmers during the same time period (USDA, National Agricultural Statistics Service, 2014). We should note that extreme drought severely affected midwestern agriculture during the summer and fall of 2012, with the census taken immediately following the drought.
The Old Trails region (see Figure 1) consisted of five counties located between the Kansas City metropolitan area and mid-Missouri urban regions and traditionally included row crops, commodity cattle production, and commercial orchards. In 2012, there were more than 5,000 farms in the region, with approximately 5% estimated as DTC farms. Today, orchards, wineries, unique shops, restaurants, and bed-and-breakfasts make this area a destination for travelers and provide an opportunity for amenity-driven growth. The five Southeast Nebraska counties have traditionally been agriculturally dependent and have seen declining populations since 1930. In 2012, there were more than 3,200 farms in the region, with just over 3% estimated as DTC farms (USDA, National Agricultural Statistics Service, 2014). Median household income in the region averaged 12% below the state average in 2007. The major population centers of Omaha and Lincoln are roughly an hour's drive or more away. These counties have participated in a number of development activities as a region, including a focus on local foods. The North Ozarks region is relatively isolated from a major population center and includes seven counties, with higher than average poverty rates (18%–26% vs. 13.5% state average) and lower median household incomes (U.S. Census Bureau, Small Area Estimates Branch, 2009). There were more than 4,400 farms in the region in 2012, with just over 5% estimated as DTC farms (USDA, National Agricultural Statistics Service, 2014). The region's economy was long based on natural resource extraction activities including timber, mining, and agriculture (Cunningham, Reference Cunningham, Kabrick, Dey and Gwaze2007). Today there is significant interest in developing local food systems for health reasons, particularly in Dent County, which has participated in several healthy lifestyle projects organized by University of Missouri Extension.Footnote 1
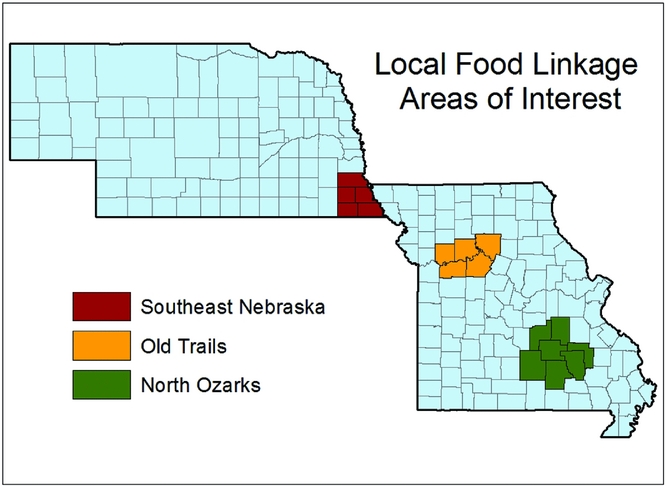
Figure 1. Study Regions
Using the responses from a previous survey-based study on local food farmers in the selected regions (Hendrickson et al., Reference Hendrickson, Meador, Johnson, Cantrell, Scott and Lucht2015), we identified 95 producers who had both viable farming operations and had previously participated in local food marketing. Responses to our survey were completed in one of three ways: (1) a one-on-one interview, (2) a telephone interview, or (3) a mail survey. Participants received a onetime payment of $100 for completing the survey. Responses were collected over a period of 7 weeks. Of 95 surveys sent, we received 32 usable responses for a response rate of 33.7%.
We asked our survey respondents to report their purchases of goods and services used as inputs, along with expenses for labor and their profits. Respondents also reported whether these inputs were purchased from vendors within the region, within the state, or outside their state. A copy of the survey is provided in the online supplementary appendix.
3. Scenario Construction
To construct our scenarios, we first assigned an IMPLANFootnote 2 sector to each respondent based on their reported goods produced. Next, we matched the respondents’ reported purchases of goods and services with the best-fitting IMPLAN commodity sector. Some of our survey categories could not be readily converted to a single IMPLAN sector and instead had to be divided among several IMPLAN sectors. For example, in our survey we ask the producers the amount they spent on utilities. This category was divided into three commodities: (1) power generation and supply, (2) natural gas distribution, and (3) water and sewage systems. The proportion of spending allocated to a given commodity in these categories was allocated based on a weighted average using the relative size of the IMPLAN model's technical coefficients for each relevant commodity in the aggregated category. A full listing of category breakdowns and the mapping of unaggregated sectors from the survey is provided in the online supplementary appendix (Table A2).
We used the reported and imputed commodity purchases reported by our respondents to create a set of technical coefficients for each producing sector. Because of the relatively small sample size, we pooled the data from all three study areas to create an average vector of input purchases for each sector. Although the local food producers have somewhat different production functions in the three regions, this assumption generates average coefficients, much like the IMPLAN coefficients are based on national average production functions. Although this has the potential to obscure any local differences in production processes, it adds robustness to the technical coefficients.
Next, we constructed household income based on the producers’ reported employee payroll, farm profits (or losses), depreciation, and payments to investors. Depreciation was included in our estimate of household savings as it is a return on previously invested monies. Household income was distributed based on the proportion of households in each income category for each of our regions.
To determine the appropriate percentage of goods and services that was purchased from in-region suppliers, we constructed a regional purchase coefficient (RPC) for each of our input sectors using the reported values from each purchasing sector. For example, assume in a given region a beef producer and a poultry producer both reported purchasing feed. If the beef producer reported purchasing $1,000 total of feed with 50% being purchased from in-region suppliers and the poultry producer reported purchasing $500 total of the feed with 80% from in-region suppliers, the RPC for feed would take a value of 0.60 ($900/$1,500). When a producer reported a percentage of in-region spending for a given commodity, the survey response was used. For our aggregated categories, this percentage was applied to all relevant commodities. In instances where a percentage was not reported by a producer, we used the IMPLAN RPC for that commodity.
Finally, we added an additional final demand change for IMPLAN sector 324, “Retail—Food and Beverage.” To calculate the size of this sector, we first determined the value of local food produced for retail sales from each of our survey responses. To determine the appropriate amount of retail margin, we divided the value of food produced for retail sales by the value unity minus the IMPLAN margin percentage for each of our producer's sectors. Because our cattle producers (IMPLAN sector 11) do not have retail margins, we used the retail margin for “Animal (Except Poultry) Slaughtering, Rendering, and Processing” (IMPLAN sector 59). The final demand change for IMPLAN sector 324 was assigned an RPC of unity to reflect all sales occurring within the study region (consistent with Hughes et al., Reference Hughes, Brown, Miller and McConnell2008). Once these values were calculated, we rescaled our vector of final demand changes to the $1 million baseline value.
Our new vector of final demands was then used to shock each of our regional models. To calculate the impacts of conventional food sales, we created a weighted proportion based on the IMPLAN sectors of our respondents. This approach assumes that the sale of locally produced beef, for example, displaces an equal value (though not necessarily equal volume) of conventionally marketed beef. This proportion was then scaled to $1 million of sales. The purchase of these commodities was then margined to reflect producer prices. IMPLAN model RPCs were used for each of the commodities under the assumption that we did not know how much of the goods were produced locally. However, to be consistent with our local food sales, the RPC for the retail portion was set to 100%. Finally, these shocks were applied to each of our regional models.
An unaggregated IMPLAN model for each of the three regions was used for modeling. Each of the regional models was shocked with our vectors of final demand adjusted by the accompanying RPCs for that region. Margins were applied to all changes in final demand for our input vector for which margins were available under the belief that our producers paid purchaser prices. The vectors of local final demands (before margins were applied) for the local foods are provided in the Appendix (Table A1). The results of these shocks are presented in the following section.
4. Comparing Local and Conventional Food Systems
The majority of our respondents (20) reported total sales of less than $10,000 reflecting the small nature of many DTC farms (see Table 1). Only 9 respondents reported sales greater than $50,000. Moreover, only one-third of our respondents reported making an operating profit in the year 2012. Unfortunately, our survey only provided limited insight into the reason so few of the local food producers were unable to turn a profit. It should be noted that the snapshot picture afforded only one year's reported profits and does not indicate the long-term viability of our survey respondents.
Table 1. Reported Total Sales and Profits
The majority (23) of our respondents were primarily engaged in vegetable and melon farming (Table 2). Eleven of our respondents were involved in animal product production including beef ranching, poultry and egg production, and other animal product production. We only had 1 respondent each in the industries of fruit farming and greenhouse, nursery, and floriculture production.
Table 2. Survey Responses by Region and Primary Commodity Produced
Based on the reported sales of producers in our survey, we generated a basket of locally produced goods worth $1 million to consumers. We considered the alternative of comparing locally produced and marketed products with the conventionally produced and marketed analogues, but ultimately decided against this approach owing to concerns about disclosing identifying characteristics about our respondents. These goods were generally purchased at farmers’ markets or through community-supported agriculture, but a portion was marketed as locally produced food through local retailers, in which case the consumer expenditures included the retailer's margin. Next, we generated a similar $1 million basket of conventionally produced food. As indicated in Table 3, the majority of the foods in these baskets were vegetables and melons (63%). Meats, poultry, eggs, and other animal products comprised just over one-third of the market basket (collectively, 35.5%). Fruits and greenhouse, nursery, and floriculture products accounted for the remaining 1.5%.
Table 3. The Representative Market Basket

5. Impacts on Regional Sales
The most obvious impact of any economic activity is its effect on aggregate sales. Here, we are considering the effects of $1 million in sales of local versus conventionally produced and marketed food. The comparison of interest, then, is between the indirect sales generated by the alternative systems. Our analysis produces mixed results. In the Old Trails region, local food production created much more (approximately 40% more) indirect economic activity ($766,409) than conventional food sales ($549,324). Similarly, local foods generated more indirect output ($752,723) than conventional foods ($518,868) in the North Ozarks region (roughly 45% more). In contrast, conventional food sales in the Southeast Nebraska region generated 28% more indirect output than did local food sales ($678,599 compared with $531,559) (Table 4).
Table 4. Total Sales Impacts of Local Food and Conventional Agricultural Sales
6. Impacts on Employment (Jobs)
In our survey, we asked our respondents to report full-time employees, part-time employees, and seasonal employees and to estimate the hours worked by part-time and seasonal employees. Unfortunately, many of our respondents did not appear to understand what we were asking. As such, the majority of answers we received were not usable or readily convertible to full-time equivalents (FTEs). For example, one respondent indicated that he or she employed a single part-time employee who worked approximately 2,200 hours in 2012. Multiple respondents (16) reported seasonal or part-time employees but failed to report an estimate of the hours worked by part-time and seasonal employees. Given the strength of the assumptions we would need to make to estimate FTEs from our responses, we chose to use the number of employees reported by our respondents weighted to the $1 million of local food sales for our direct employment estimates.
Table 5 shows the employment impacts of local and conventional food systems. Local food sales generate a tremendous amount of direct employment measured in units of jobs. However, it is important to note that the numbers reported here do not reflect full-time employment but rather the sum of full-time, part-time, and seasonal jobs. Most of the jobs created by the local food producers are part-time and seasonal because of the seasonal nature of food production. For this reason, it can be misleading to compare these numbers with the number of jobs created by conventional farms or other sectors of the economy that likely employ more full-time employees.
Table 5. Employment Impacts of Local Food and Conventional Agricultural Sales
It is more meaningful to compare the indirect employment generated by local and conventional food sales because these are both estimated based on the same assumptions and using the same input-output model. In each of our study regions, we see that indirect employment is larger in the case of local foods. In the Missouri regions, indirect employment is three times higher for local foods than for conventional foods. In the Southeast Nebraska region, indirect employment is more than twice as large for local foods as it is for conventional foods.
7. Contribution to GDP
The most commonly used measure of economic performance is GDP. An industry's direct contribution to regional GDP (sometimes referred to as value added) is a common indicator of the industry's importance to the regional economy. An industry can also contribute to the economy indirectly through its purchases of local inputs and the purchases of its employees. Table 6 demonstrates that the direct contribution of local food producers to regional GDP is larger than that of conventional food systems in two out of our three regions. Furthermore, local foods’ indirect contribution to GDP is much larger in each of our study regions. Taken together, we see that for each of our study regions total contribution to GDP by local foods is significantly greater than conventional foods.
Table 6. Value-Added Impacts of Local Food and Conventional Agricultural Sales
8. Implications for Local Economies
For the most part, $1,000,000 worth of local food sales generated more total regional sales, employment, and GDP than $1,000,000 of conventional food sales. The sole exception was Southeast Nebraska, where local food sales generated lower sales. A possible explanation for this result is the greater reliance on imported inputs for local producers in Southeast Nebraska relative to local producers in the other regions. As demonstrated in Table A1, the amount of locally produced commodity purchases in the Southeast Nebraska region was about two-thirds of the amounts in the other study regions.
The reason for the generally larger impacts of local food systems is perhaps not surprising. Much, if not most, conventionally produced food consumed in these regions is produced outside the region, and often outside the state. Economies of size in food production and processing lead to regional specialization in food production. As a result, most conventionally produced food products are produced in a relatively few places and shipped to markets across the country (Buttel, 2003). As a result, most conventionally produced and marketed food comes from other regions leading to lower local multiplier effects.
The important finding here is that the total contribution to local GDP by local food systems was greater than the contribution of conventional food systems. The survey data reveal that the local food producers themselves retained a somewhat smaller share of value added (GDP) than do conventional farms in the IMPLAN model. Despite having lower margins, local food brought about larger economic impacts. On the other hand, the community overall enjoyed higher levels of value added per $1,000,000 of food purchases because of the direct and indirect employment and the indirect sales generated by local food systems.
This study shows that the magnitude of economic benefits from local food systems depends on the region. What is not demonstrated by this study is whether the rural economy overall is expanded by local foods. Many of the displacement effects of local foods occur in other regions, other states, and even other countries. However, given the growing size of the local food movement, communities are clearly better off to encourage the development of a local food capacity rather than continue producing solely in the conventional market, which is not likely to grow as fast as the local food market for the foreseeable future. This could be a particularly important finding for economic development efforts in remote rural communities such as the ones we studied. Local food systems have generally developed in proximity to urban areas where DTC sales are highest per farm (Martinez et al., Reference Martinez, Hand, Da Pra, Pollack, Ralston, Smith and Vogel2010). However, as our findings show, encouragement for developing such systems in rural areas could be beneficial to community economic development.
Supplementary material
To view supplementary material for this article, please visit https://doi.org/10.1017/aae.2017.14
Appendix
Table A1. Final Demand Vector for Local Food Sales


 Open access