


INTRODUCTION
Coastal sand dunes adjoin much of the eastern shore of Lake Michigan and collectively comprise possibly the largest freshwater coastal dune system in the world (Peterson and Dersch, Reference Peterson and Dersch1981) (Figure 1). A unique coastal system, these dunes line the shore for several kilometers along numerous parts of the coast and often extend up to a kilometer inland (Sanford, Reference Sanford1916; Buckler, Reference Buckler1979). Some dunes exceed 50 m in height and contain enormous volumes of sand (Arbogast et al., Reference Arbogast, Shortridge and Bigsby2009). Unlike dune systems on marine coasts, Lake Michigan's coastal dunes developed without the influence of tectonic or tidal activity (Hansen et al., Reference Hansen, Fisher, Arbogast and Bateman2010). On the contrary, they are the product of many factors, but primarily are the result of the reworking of sandy glacial and lacustrine deposits in response to climatic and lake level variability (Loope and Arbogast, Reference Loope and Arbogast2000; Hansen et al., Reference Hansen, Fisher, Arbogast and Bateman2010; Thompson et al., Reference Thompson, Lepper, Endres, Johnston, Baedke, Argyilan, Booth and Wilcox2011; Lovis et al., Reference Lovis, Arbogast and Monaghan2012). The subsequent dune environments found in the eastern Lake Michigan basin are thus a subject of this variability, resulting in progradational or aggradational aeolian landforms depending upon the geomorphological setting along the ~550 km shoreline (Buckler, Reference Buckler1979; Wilson, Reference Wilson2001; Lepczyk and Arbogast, Reference Lepczyk and Arbogast2005; Lovis et al., Reference Lovis, Arbogast and Monaghan2012; Kilibarda et al., Reference Kilibarda, Venturelli, Goble, Fisher and Hansen2014; Paskus and Enander, Reference Paskus and Enander2019). Within these settings along the coastline, dune blowouts are common aeolian features (Buckler, Reference Buckler1979). These erosional landforms, in which portions of a dune are “blown out” due to wind erosion, are known markers of climatic and anthropogenic dunefield conditions (Hesp, Reference Hesp2002). Thus, dune blowouts, the subject of this paper, represent an important area of scientific study.
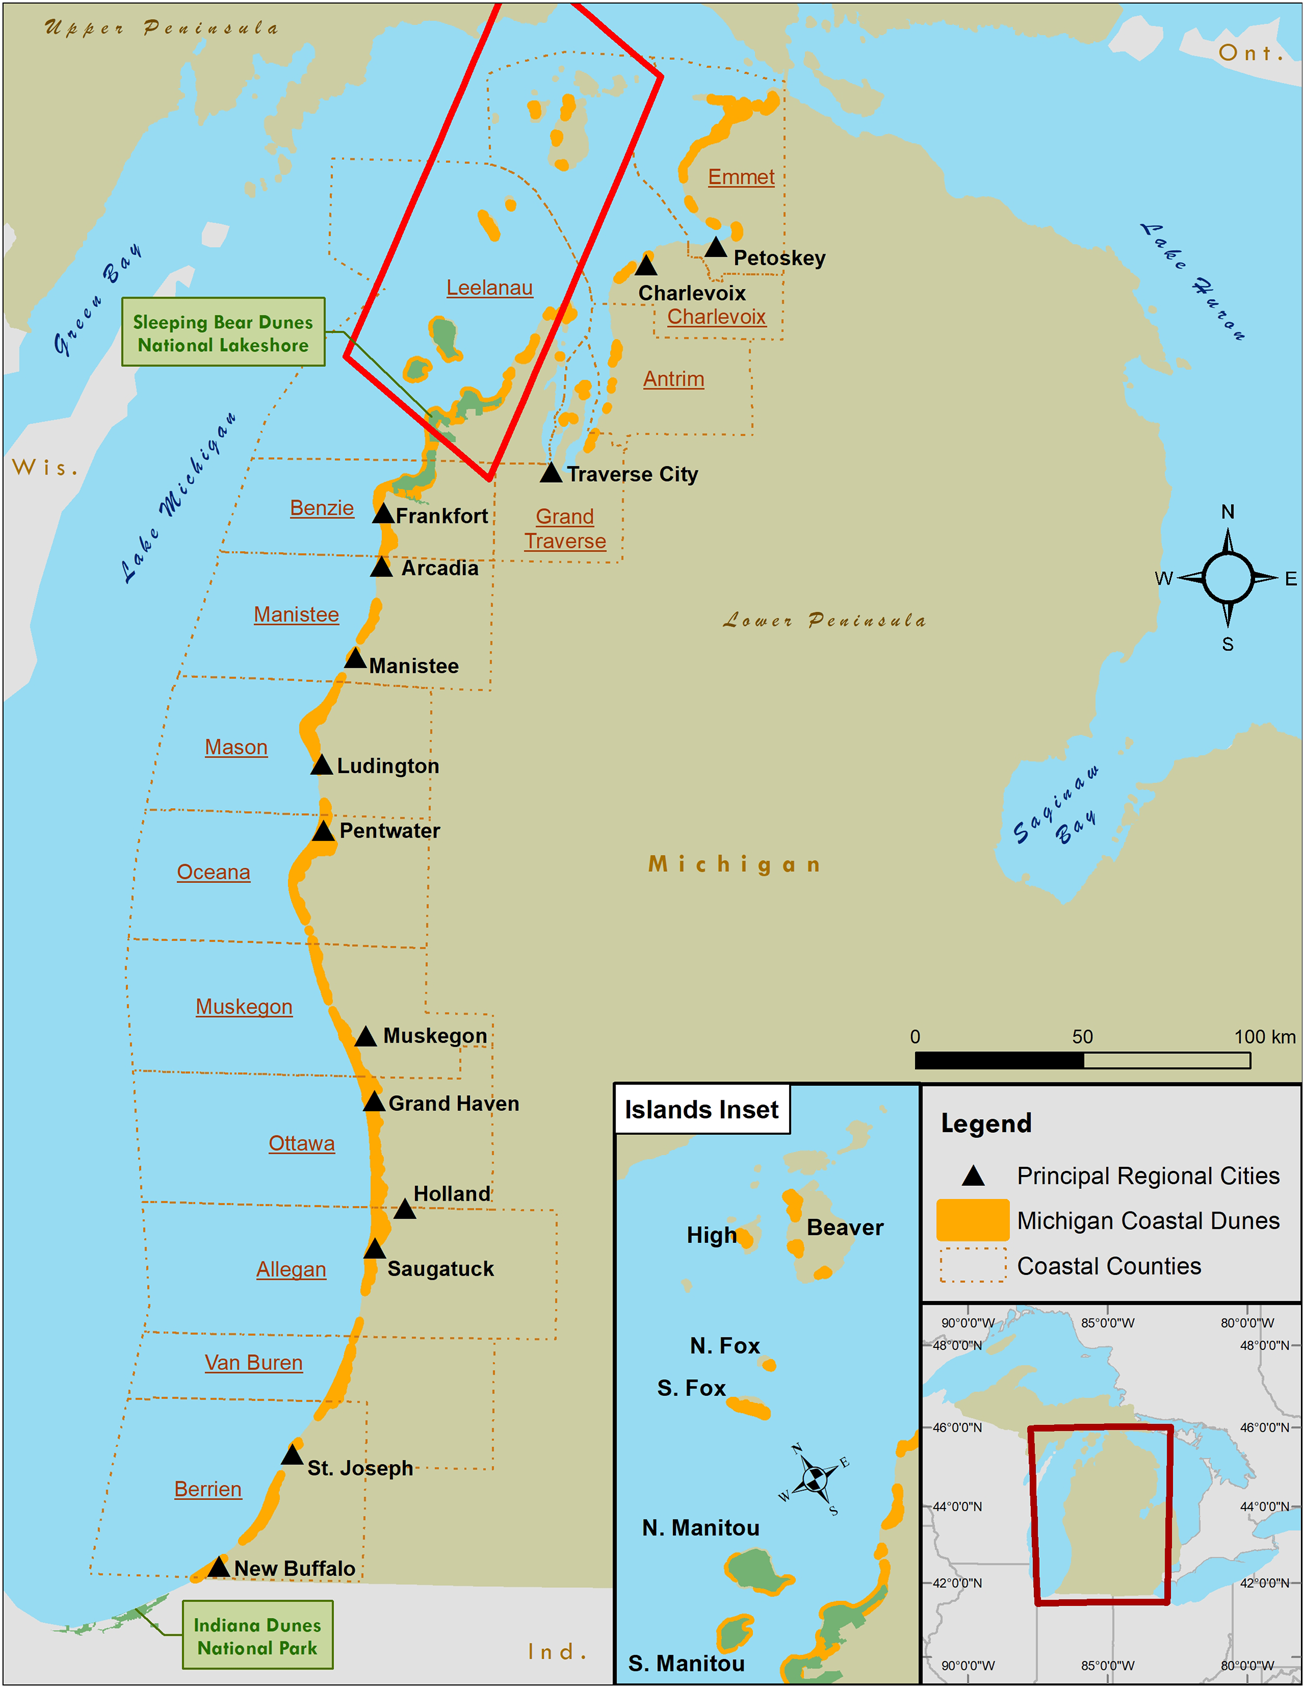
Figure 1. Overview map of eastern Lake Michigan dunefields.
Dune building at many sites in the Lake Michigan region, especially those toward the southern end of the lake basin, apparently began ca. 5.5 ka amidst an ~1,500-year period of elevated lake levels on ancestral Lake Michigan-Huron, known collectively as the Nipissing transgressions (ca. 6–4.5 ka) (Larsen, Reference Larsen1987; Thompson et al., Reference Thompson, Lepper, Endres, Johnston, Baedke, Argyilan, Booth and Wilcox2011; Lovis et al., Reference Lovis, Arbogast and Monaghan2012). At the apex of the Nipissing transgressions was the Nipissing high stand, a period of maximum water height (~178–183 m) (Dott and Mickelson, Reference Dott and Mickelson1995; Baedke and Thompson, Reference Baedke and Thompson2000; Thompson et al., Reference Thompson, Lepper, Endres, Johnston, Baedke, Argyilan, Booth and Wilcox2011). The high stand may have occurred as early as ca. 5.5 ka (Lewis, Reference Lewis1969; Petty et al., Reference Petty, Delcourt and Delcourt1996; Lovis et al., Reference Lovis, Arbogast and Monaghan2012) or as late as ca. 4.5 ka (Larsen, Reference Larsen1987; Hansel and Mickelson, Reference Hansel and Mickelson1988; Thompson and Baedke, Reference Thompson and Baedke1997; Baedke and Thompson, Reference Baedke and Thompson2000; Thompson et al., Reference Thompson, Lepper, Endres, Johnston, Baedke, Argyilan, Booth and Wilcox2011; Fisher et al., Reference Fisher, Weyer, Boudreau, Martin-Hayden, Krantz and Breckenridge2012). Regardless, the Nipissing high stand immediately proceeded a relatively sudden drop in lake levels, ~4 m during ca. 1,200 years (Baedke and Thompson, Reference Baedke and Thompson2000), driven primarily by the effects of isostatic rebound on downstream lake outlets (Monaghan et al., Reference Monaghan, Lovis and Fay1986; Larsen, Reference Larsen1987; Bishop, Reference Bishop1990; Baedke and Thompson, Reference Baedke and Thompson2000; Lovis et al., Reference Lovis, Arbogast and Monaghan2012), although changes in regional climate also may have played a role (Hansel and Mickelson, Reference Hansel and Mickelson1988; Petty et al., Reference Petty, Delcourt and Delcourt1996). After this sudden decline, lake levels fluctuated around the 1819–1999 modern mean of 176.7 m, often in apparent cycles (Baedke and Thompson, Reference Baedke and Thompson2000).
Periods of aeolian activity on the eastern lakeshore continued thereafter from the Nipissing High Stand, followed by brief intervals of dune stabilization (Van Oort et al., Reference Van Oort, Arbogast, Hansen and Hansen2001; Arbogast et al., Reference Arbogast, Hansen and Van Oort2002; Hansen et al., Reference Hansen, Arbogast, Packman and Hansen2002, Reference Hansen, Fisher, Arbogast and Bateman2010; Lepczyk and Arbogast, Reference Lepczyk and Arbogast2005; Blumer et al., Reference Blumer, Arbogast and Forman2012; Lovis et al., Reference Lovis, Arbogast and Monaghan2012; Kilibarda et al., Reference Kilibarda, Venturelli, Goble, Fisher and Hansen2014). Yet, this overall pattern was not uniform and some nonlinear spatiotemporal and geomorphological variability in dunefields exists between the northern and southern portions of the lakeshore (Lovis et al., Reference Lovis, Arbogast and Monaghan2012; Fulop et al., Reference Fulop, Johnson and Keen-Zebert2019). Nevertheless, several studies have identified periods of aeolian activity and stability since the embryonic stages of dune formation, which mostly occurred during the Nipissing transgressions. In their study of coastal dunes along the southern half of Lake Michigan's eastern shoreline, Hansen et al. (Reference Hansen, Fisher, Arbogast and Bateman2010) identified six aeolian phases beginning from the most recent deglaciation, which began ca. 14 ka in the southern Lake Michigan basin and ended ca. 11 ka when ice cleared the Straits of Mackinac (Kincare, Reference Kincare2007), through to present day. Similarly, Kilibarda et al. (Reference Kilibarda, Venturelli, Goble, Fisher and Hansen2014) noted four phases of dune and coastal evolution on the southern reaches of Lake Michigan beginning at ca. 6 ka. Lovis et al. (Reference Lovis, Arbogast and Monaghan2012) detected a series of aeolian periods that varied in a spatiotemporal manner delineated primarily by the isostatic hinge line, north of which dunefields developed somewhat differently due to ongoing crustal rebound and other factors.
Although different, all three studies (Hansen et al., Reference Hansen, Fisher, Arbogast and Bateman2010; Lovis et al., Reference Lovis, Arbogast and Monaghan2012; Kilibarda et al., Reference Kilibarda, Venturelli, Goble, Fisher and Hansen2014) identified a pronounced Late Holocene episode of regional dune stability called the Holland Interlude, a period marked by vegetation expansion across the previously mobile coastal dunes. This period of stability resulted in pedogenic formation of the Holland Paleosol, an Inceptisol present in dunes along Lake Michigan's southeastern coast (Arbogast et al., Reference Arbogast, Schaetzl, Hupy and Hansen2004; Hansen et al., Reference Hansen, Arbogast, van Dijk and Yurk2006). The studies disagreed on the approximate dates of the so-called Holland Interlude, ranging from ca. 3 ka to ca. 0.5 ka, but agreed that the dates overlapped for a period from ca. 1.6–1 ka (Hansen et al., Reference Hansen, Fisher, Arbogast and Bateman2010; Lovis et al., Reference Lovis, Arbogast and Monaghan2012; Kilibarda et al., Reference Kilibarda, Venturelli, Goble, Fisher and Hansen2014). Whatever the exact chronology, these distinct, identified aeolian phases were likely driven by a complex system of climate and lake-level changes, which either increased or restricted the supply of sand.
Recently, White et al. (Reference White, Piraino, Shortridge and Arbogast2019) and McKeehan and Arbogast (Reference McKeehan and Arbogast2021) identified a modern trend toward dune stabilization along Lake Michigan's eastern shoreline by documenting the expansion of vegetation through an object-based analysis of aerial imagery and ground-level repeat photography, respectively. If true, these two findings could signal a new phase for the region's coastal dunefields (White et al., Reference White, Piraino, Shortridge and Arbogast2019; McKeehan and Arbogast, Reference McKeehan and Arbogast2021). This phenomenon was also implied by Lovis et al. (Reference Lovis, Arbogast and Monaghan2012, p. 117), who noted a decreased sand supply in the regional coastal aeolian system over the last 500 years. Regional dune stabilization could also suggest that a new mesoscale climate regime has begun to evolve across the Great Lakes (Yurk and Hansen, Reference Yurk and Hansen2021). Close observation of the trends and environments of Lake Michigan coastal dune systems could help us determine if this shift is underway.
As Ritchie (Reference Ritchie1972, fig. 12) demonstrated, the aeolian conditions and landform morphologies in a given location are the product of a complex system at the nexus of interrelated terrestrial, atmospheric, and—in coastal areas—aquatic processes (Schwarz et al., Reference Schwarz, Brinkkemper and Ruessink2018). One of the “prime factors” controlling dune environments, according to Ritchie (Reference Ritchie1972), is climate. An indicator of environmental and climatic conditions controlling aeolian landscapes and dune geomorphic systems is often the development, presence, and modes of dune blowouts (Ritchie, Reference Ritchie1972; Hesp, Reference Hesp2002). Blowouts are erosional depressions or troughs that have “blown out” through existing dunes due to natural or anthropogenic forcing (Bate and Ferguson, Reference Bate and Ferguson1996; Hesp, Reference Hesp2002). The morphology of blowouts varies (Ritchie, Reference Ritchie1972; Hesp and Hyde, Reference Hesp and Hyde1996), as does the definition of the term “blowout” (Hesp and Hyde, Reference Hesp and Hyde1996). Yet, blowout landforms generally include a deflation basin from which sand is eroded, lateral erosional walls that are often stabilized at their crests by vegetation, and a downwind depositional lobe onto which eroded sand is deposited (Adamson et al., Reference Adamson, Selkirk and Colhoun1988; Sloss et al., Reference Sloss, Shepherd and Hesp2012).
Blowout initiation occurs due to an assortment of drivers, including wave and fluvial erosion, aeolian erosion from high-velocity winds and the aerodynamic influences associated with the topographic acceleration of airflow over a dune crest, the density of dune vegetation and its effectiveness at geomorphic stabilization, human and animal disturbance, storms, and changes in precipitation and temperature (Melton, Reference Melton1940; Jungerius et al., Reference Jungerius, Verheggen and Wiggers1981; Hesp and Hyde, Reference Hesp and Hyde1996; Hesp, Reference Hesp2002; Jewell et al., Reference Jewell, Houser and Trimble2017). Most of these initiation factors are related to climate, although the mechanisms are likely more complex than a simple climate-blowout coupling. After all, coastal dunes are complex systems involving interrelated process-response relationships and evolutionary drivers operating at different spatiotemporal scales (Delgado-Fernandez, Reference Delgado-Fernandez2011; Walker et al., Reference Walker, Davidson-Arnott, Bauer, Hesp, Delgado-Fernandez, Ollerhead and Smyth2017). For example, coastal dunes along Lake Michigan are the result of complex interactions among lake levels, climate, wind, vegetation, and littoral and dune geomorphic processes (Cowles, Reference Cowles1899; Olson, Reference Olson1958a, Reference Olsonb, Reference Olsonc; Loope and Arbogast, Reference Loope and Arbogast2000; van Dijk, Reference van Dijk2004, Reference van Dijk, Fisher and Hansen2014; Hansen et al., Reference Hansen, DeVries-Zimmerman, van Dijk and Yurk2009; Walker et al., Reference Walker, Davidson-Arnott, Bauer, Hesp, Delgado-Fernandez, Ollerhead and Smyth2017; Fisher et al., Reference Fisher, DeVries-Zimmerman, Hansen, Wolin, Lepper and Spanbauer2021). Still, changes in climate invariably affect the sensitive ecogeomorphic feedbacks and relationships determining dune behavior and blowout mode in any dunefield (Thom et al., Reference Thom, Hesp and Bryant1994).
Ecogeomorphic influence on dunes can be observed along Lake Michigan's shoreline, as White et al. (Reference White, Piraino, Shortridge and Arbogast2019) and McKeehan and Arbogast (Reference McKeehan and Arbogast2021) suggest. Both studies observed an expansion in dune vegetation and, consequently, the geomorphic stabilization of some coastal dunes in the region in the modern era (White et al., Reference White, Piraino, Shortridge and Arbogast2019; McKeehan and Arbogast, Reference McKeehan and Arbogast2021). Both speculated that an increase in precipitation in the last ca. 80 years was possibly driving the ecogeomorphic response observed across the landscape, although McKeehan and Arbogast (Reference McKeehan and Arbogast2021) also provided other process-response explanations, including a non-linear ecogeomorphic lag from drier or stormier Holocene climates and potential anthropogenic forcing.
Driven by climatic forcing, it is ultimately the ecogeomorphic interactions at the dune scale where much variability exists (Melton, Reference Melton1940; Hack, Reference Hack1941; Cooper, Reference Cooper1958; Carter, Reference Carter and Carter1991; Mckenzie and Cooper, Reference Mckenzie and Cooper2001; Hesp et al., Reference Hesp, Martinez, da Silva, Rodríguez-Revelo, Gutierrez, Humanes and Laínez2011), creating the impetus for blowout formation. In illustrating this point, blowouts and parabolic dunes were observed to be “wind in conflict with vegetation” by Melton (Reference Melton1940, pp. 113–114), whereas Hack (Reference Hack1941, p. 242) described coastal dune geomorphologies as “a contest between moving sand and vegetation.” At areas of vegetative and topographic vulnerability, aeolian and other erosional processes undertake what Cooper (Reference Cooper1958, p. 74) called the “concentration of effective attack by wind at a point of weakness,” resulting in the deflation of sand from the dune (Cooper, Reference Cooper1958; Schwarz et al., Reference Schwarz, Brinkkemper and Ruessink2018). This creates “wind-scoured gaps” in individual dunes, leading to blowouts (Bagnold, Reference Bagnold1941; Hesp, Reference Hesp2002). The effectiveness and consequence of the aeolian “attack” on a dune depends greatly upon the effective ecogeomorphic functionality of vegetation (Cooper, Reference Cooper1958; Ranwell, Reference Ranwell1958; Gares, Reference Gares1992; Gares and Nordstrom, Reference Gares and Nordstrom1995; Lancaster and Baas, Reference Lancaster and Baas1998; Nield and Baas, Reference Nield and Baas2008; Abhar et al., Reference Abhar, Walker, Hesp and Gares2015; Schwarz et al., Reference Schwarz, Brinkkemper and Ruessink2018; Lee et al., Reference Lee, Ferdowsi and Jerolmack2019; Miyanishi and Johnson, Reference Miyanishi, Johnson, Johnson and Miyanishi2021). Weak, dead, or sparse vegetation may foster dune activation or blowouts (Schwarz et al., Reference Schwarz, Brinkkemper and Ruessink2018). Further, vegetation and associated ecogeomorphic processes somewhat control blowout morphology post initiation (Gares, Reference Gares1992).
Underscoring the interrelated ecogeomorphic processes at work in aeolian systems, the ample delivery of sand from beach and foredune areas windward of blowouts has many possible and varied outcomes on dunes and blowouts (Schwarz et al., Reference Schwarz, Brinkkemper and Ruessink2018; Laporte-Fauret et al., Reference Laporte-Fauret, Castelle, Michalet, Marieu, Bujan and Rosebery2021; Miyanishi and Johnson, Reference Miyanishi, Johnson, Johnson and Miyanishi2021). For example, ample sand can bury and destroy existing vegetation, hamper attempts by pioneering species to become established, and provide the conditions by which adaptive dune plant species can thrive and stabilize dunes (Cowles, Reference Cowles1899; Olson, Reference Olson1958b; Doing, Reference Doing1985; Maun, Reference Maun1998; Dech and Maun, Reference Dech and Maun2005; Lane et al., Reference Lane, Wright, Roncal and Maschinski2008; Brown and Zinnert, Reference Brown and Zinnert2018). Generally, sand supply is a key, dynamic variable controlling dunefield behavior and is related to beach width, active coastlines, dune morphology, and flow dynamics (Short and Hesp, Reference Short and Hesp1982; Davidson-Arnott et al., Reference Davidson-Arnott, Hesp, Ollerhead, Walker, Bauer, Delgado-Fernandez and Smyth2018). Sand supply is also important to blowout development and is constrained or promulgated by interrelated ecogeomorphic and climatic factors at work in dune systems (Cooper, Reference Cooper1958). Ecogeomorphic feedback mechanisms foster favorable edaphic conditions or hinder pedogenesis and affect sand supply, thus either driving dune systems and blowouts toward stabilization regimes or activation. Pioneering plant species on vegetating dunes, for instance, are effective at deflecting and trapping airborne and saltating sediment. Consequently, this reduces the supply of sand downwind, grows the foredune, and enriches the soil in a positive ecogeomorphic feedback (Hesp, Reference Hesp1981, Reference Hesp1989; Maun, Reference Maun1998; Gardner and McLaren, Reference Gardner and McLaren1999; Werner et al., Reference Werner, Mason and Hanson2011; Ruggiero et al., Reference Ruggiero, Hacker, Seabloom, Zarnetske, Moore and Murray2018).
These interrelated ecogeomorphic processes, often in response to climatic and other disturbance forcings, also influence blowout morphology (Girardi and Davis, Reference Girardi and Davis2010; Schwarz et al., Reference Schwarz, Brinkkemper and Ruessink2018). Cooper (Reference Cooper1958) and Schwarz et al. (Reference Schwarz, Brinkkemper and Ruessink2018) both distilled blowout morphological types into the two primary forms: trough and saucer blowouts. Trough blowouts, as the name suggests, are characterized by a deep, elongated trench-like feature with high lateral walls, culminating in a depositional lobe several meters high several meters downwind (Hesp, Reference Hesp2002). Additional geomorphic conditions for the development of trough blowouts include steep-sloped dunes and deep, sandy substrata (Hesp, Reference Hesp2002; Luo et al., Reference Luo, Wang, Shao, Lu, Qian, Dong, Hesp and Bateman2019). Unsurprisingly, trough morphologies have been associated with high-velocity aerodynamic jets (Hesp and Hyde, Reference Hesp and Hyde1996). Lake Michigan's coastal dunes contain many trough blowouts, including several exceeding 100 m in length.
Saucer blowouts are perhaps less dramatic on the landscape, appearing as a “shallow dish” often atop dunes or in environments with thin sand deposits (Hesp, Reference Hesp2002). Whereas trough blowouts often develop from strong onshore, unidirectional winds (Melton, Reference Melton1940), saucer blowouts have been observed to be the product of winds perpendicular to blowout inception (Hails and Bennett, Reference Hails, Bennett and Edge1980). Hesp (Reference Hesp2002) identified a third type of blowout morphology called cup blowouts but noted that these often were saucer blowouts that had evolved and deepened due to subsequent and continued erosion. Ritchie (Reference Ritchie1972) followed a different schema and identified five types of blowouts: cigar-shaped, V-shaped, scooped hollow, cauldron-and-corridor, and parabolic.
Importantly for our study, Ritchie (Reference Ritchie1972) classified parabolic dunes as blowouts. Many researchers prior to Ritchie (Reference Ritchie1972) and after have agreed that parabolic dunes—the classical U-shaped aeolian landform (Landsberg, Reference Landsberg1956; Jennings, Reference Jennings1957)—are either blowouts (Melton, Reference Melton1940; Bagnold, Reference Bagnold1941; Hack, Reference Hack1941; Cooper, Reference Cooper1958; Hansen et al., Reference Hansen, DeVries-Zimmerman, van Dijk and Yurk2009), inextricably related to blowouts (e.g., Girardi and Davis, Reference Girardi and Davis2010), or represent an evolutionary stage of a blowout (Jungerius et al., Reference Jungerius, Verheggen and Wiggers1981; McCann and Byrne, Reference McCann and Byrne1994). For example, Cooper (Reference Cooper1958, p. 74) stated that a parabolic dune “is essentially a trough blowout.” Bagnold (Reference Bagnold1941) viewed the entire parabola-blowout procession as a cycle in which a new dune was “born” downwind in the form of a depositional lobe, an idea with which Melton (Reference Melton1940) concurred under certain wind regimes. We agree with these analyses and include parabolic dune landforms in our assessment of Lake Michigan coastal blowouts.
In this paper, we attempt to identify all blowouts on the eastern shore of Lake Michigan within the State of Michigan, including those with parabolic morphologies in accordance with Cooper (Reference Cooper1958) and others. We then conduct a series of spatiotemporal analyses to determine trends in blowout evolution. First, we utilized machine learning tools to map blowout extent using repeat aerial photography at separate timestamps: 1938, 1986–1988, and 2018. Then, in a manner similar to Abhar et al. (Reference Abhar, Walker, Hesp and Gares2015) in their study of coastal dune blowouts on Cape Cod, Massachusetts, we employed an object-based image analysis technique known as a spatial-temporal analysis of moving polygons (STAMP) model to assess whether the polygons representing blowouts expanded, migrated, stabilized, or fragmented. By examining the trends in blowout behavior since 1938, we may be able to determine if the dune stabilization trends observed by White et al. (Reference White, Piraino, Shortridge and Arbogast2019) and McKeehan and Arbogast (Reference McKeehan and Arbogast2021) extend to these geomorphic markers of climatic and ecogeomorphic forcing. In discussing our results, we also ascribe possible drivers of the observed blowout trends and the implications for Lake Michigan's dune systems.
METHODOLOGIES
Aerial imagery
A time-series geomorphic analysis of sand dunes often employs repeat aerial imagery (e.g., Jungerius and van der Meulen, Reference Jungerius and van der Meulen1989; Belford et al., Reference Belford, Kenbeek, VanHorn, van Dijk, Fisher and Hansen2014; Abhar et al., Reference Abhar, Walker, Hesp and Gares2015; White et al., Reference White, Piraino, Shortridge and Arbogast2019). For our purposes, blowouts along Lake Michigan's eastern shore, including on islands in the northern part of the lake, were identified and their extent mapped by examining three sets of summer aerial imagery representing three distinct timestamps: 1938, 1986–1988, and 2018 (Table 1). Aerial imagery from 1938, the oldest available for the region, was captured by the U.S. Department of Agriculture (USDA) in an attempt to develop a scientifically driven New Deal conservation and land use planning program (Monmonier, Reference Monmonier2002). Images from the same dataset were used by White et al. (Reference White, Piraino, Shortridge and Arbogast2019) in their study of coastal dunes in Michigan state parks. We obtained hundreds of 1938 aerial images of Lake Michigan coastal dune areas from Michigan State University's Remote Sensing and GIS Aerial Imagery Archive. These images are black and white (BW) panchromatic with a scale of 1:20,000 and a post-georeferenced spatial resolution of ~0.8 m.
Table 1. Spatial characteristics and uncertainty for aerial image datasets used in this study. Sources for this information include Abhar et al. (Reference Abhar, Walker, Hesp and Gares2015), EROS (2018a, b), and White et al. (Reference White, Piraino, Shortridge and Arbogast2019); loosely based on Mathew et al. (Reference Mathew, Davidson-Arnott and Ollerhead2010) and Abhar et al. (Reference Abhar, Walker, Hesp and Gares2015). Uncertainty is estimated as the sum of the published horizontal accuracy, average root mean squared error (RMSE) from georeferencing, and 1, which represents the potential error from resampling and vectorization. Aerial imagery sources include the U.S. Department of Agriculture (USDA) and the U.S. Geological Survey's (USGS) National High Altitude Photography (NHAP) and National Agricultural Imagery Program (NAIP) datasets.

Aerial imagery for 1986–1988 was obtained from the U.S. Geological Survey's (USGS) National High Altitude Photography (NHAP) program dataset (EROS, 2018a), a dataset sometimes used for mid-1980s landscape analyses (Rango et al., Reference Rango, Laliberte and Winters2008). This 1986–1988 dataset was selected due to its availability and to provide a rough midpoint between the oldest and most recent complete imagery sets. Studies have employed NHAP aerial imagery for analysis of forest stand landscapes (e.g., Goldmann, Reference Goldmann1990) and to evaluate land use land cover (LULC) change over time (Drummond et al., Reference Drummond, Stier and Diffendorfer2019), among other analyses. For areas along the southern portions of the lakeshore, NHAP BW images from 1988 with a scale of 1:80,000 were used (EROS, 2018a), while farther north, no suitable NHAP images for the year 1988 were available. Thus, we used NHAP images from 1986 for analysis of these areas, which included the Leelanau Peninsula. Occasionally, BW images were not available, in which case NHAP color infrared (CIR) aerial photographs with a 1:58,000 scale were used instead. The spatial resolution of all NHAP imagery post-georeferencing was ~6 m.
For 2018 images, we used aerial photography from the National Agricultural Imagery Program (NAIP) dataset (EROS, 2018b). The NAIP dataset imagery, which was captured by the USDA during the growing season, has a spatial resolution of ~0.6 m and three spectral visible color bands: red, green, and blue. In similar studies, the scale was reported to be 1:20,000 (e.g., Abhar et al., Reference Abhar, Walker, Hesp and Gares2015). The NAIP dataset, which was also obtained through the USGS, contains the highest spatial resolution among the three sets of imagery.
Blowout mapping
All blowout mapping tasks, with the exception of STAMP model analyses, utilized ArcGIS 10.7 software (ESRI, 2021). Imagery from the 1938 USDA and NHAP datasets required georeferencing, and the NAIP dataset was used as a base reference in this task. Ground control points (GCPs) visible on images at all three periods were used to effectuate rubbersheeting during the georeferencing process. The establishment of GCPs was often challenging because shorelines and dunefields in the Lake Michigan basin are dynamic environments subject to geomorphological changes (Theuerkauf et al., Reference Theuerkauf, Mattheus, Braun and Bueno2021). In more-developed areas, landmarks, lighthouses, and static street intersections, along with other built environment infrastructure, were used as GCPs, while in less-developed areas, GCPs were often sentinel trees, country crossroads, and old barns. Almost all georeferencing attempts required either second-order or third-order polynomial transformations. The target total Root Mean Square Error (RMSE) for each georectification was <5 m and was often <1 m (Table 1), especially for the 1938 aerial images because they covered smaller, although irregular, geographic areas (~4000 × 4000 m). By contrast, each NHAP image comprises a 7.5-minute USGS quadrangle (EROS, 2018a).
The locations of blowout features were identified by examining the breadth of the shoreline within each aerial imagery dataset, informed by various Michigan dune databases and reports (e.g., Buckler, Reference Buckler1979; Paskus and Enander, Reference Paskus and Enander2019; Arbogast et al., Reference Arbogast, McKeehan, Richardson and Zimnicki2020). However, the most influential guide to blowout identification for our purposes was the Michigan Coastal Dune geodatabase created by Michigan State University researchers and managed by the Michigan Department of Natural Resources (DNR) (Arbogast et al., Reference Arbogast, Garmon, Sterrett Isely, Jarosz, Kreiger, Nicholls, Queen and Richardson2018). This GIS data resource contains the polygonal extent of 93,249 hectares (230,423 acres) of coastal dunes within the state of Michigan, although it did not delineate blowouts (Arbogast et al., Reference Arbogast, Garmon, Sterrett Isely, Jarosz, Kreiger, Nicholls, Queen and Richardson2018). Blowout-like features on aerial images well outside the spatial extent of the Michigan Coastal Dune GIS data were not flagged for mapping and were ignored in our workflow. By relying on these reports and datasets, it is possible we committed commission and omission errors during this identification process. When in conflict, however, we sought to lower the instances of omission error rather than commission error. For example, as we stated in the Introduction section, we classified parabolic dunes as blowouts for this analysis. Moreover, we feel the inclusion in this study of parabolic dunes and some other transgressive dune landforms that exhibit blowout behavior is geomorphically sound and follows the approaches taken in other studies (e.g., Melton, Reference Melton1940; Cooper, Reference Cooper1958).
This methodology also follows the approach of Buckler's (Reference Buckler1979) mapping study of Lake Michigan's coastal dunes, which termed parabolic dunes “central extensions” of blowouts. Although we counted parabolic dunes and other transgressive dune features as blowouts, each site needed to meet criteria for inclusion in the study. Jungerius et al. (Reference Jungerius, Verheggen and Wiggers1981) noted that classic scour blowout morphology begins to manifest itself upon the landscape after initiation once the deflation basin reaches 5 m in length. Yet, such an identification criterion for this study would be impossible given the spatial resolution and uncertainty of our data. Therefore, we used a criterion noted in Hesp's (Reference Hesp2002) survey, which observed that a 1:1 morphodynamic relationship between the length of a blowout's deflation basin and its depositional lobe begins at ~20 m of basin length. Smaller blowouts do not appear to share this morphodynamic relationship and, thus, call into question whether they could be accurately and consistently identified in aerial photos. Consequently, we adopted the 20 m deflation basin length as an identification criterion, while allowing some slightly smaller blowouts to be included if they were positively identified in our investigation.
The spatial extents of the blowouts we identified were then generated for each of the three timestamps of our spatiotemporal analysis. To accomplish this, we used machine learning (ML) techniques to map the blowout boundary by detecting bare sand in a way that minimized human bias. We first down-sampled the 1938 and 2018 aerial images to match the relatively coarser spatial resolution of the NHAP dataset in ArcGIS using the bilinear interpolation method. In a time-series analysis of landscapes, resampling finer-resolution raster datasets to match the coarsest resolution dataset is considered best practice (Campbell, Reference Campbell1996, p. 577). To not resample the higher-quality imagery would inject an additional vector of error into the time-series analysis by comparing maps that “differ greatly in detail and accuracy” (Campbell, Reference Campbell1996, p. 577). After resampling, we selected an unsupervised ML algorithm known as the Iterative Self-Organizing Data Analysis Technique (ISODATA) method. The ISODATA classification method is often used in landscape analyses (e.g., Lemenkova, Reference Lemenkova2021), including in analyses of coastal environments (Tojo and Udo, Reference Tojo, Udo, Shim, Chun and Lim2018), due to its efficiency in processing large remote sensing datasets without the need for supervised training samples (Ma et al., Reference Ma, Liu, Zhao, Zhang, Liu, Ren, Zhang and Li2020). Moreover, unsupervised ML methods, including the ISODATA algorithm, “offer the promise of objective anomaly assignment” (Kvamme et al., Reference Kvamme, Ernenwein, Menzer, Persico, Piro and Linford2019, p. 313), thus potentially reducing the bias of the authors to guide these procedures (Campbell, Reference Campbell1996, p. 318). By contrast, supervised ML methods for identifying bare sand in coastal dunefields were found to have issues of repeatability (Smyth et al., Reference Smyth, Wilson, Rooney and Yates2022).
Our process sought to leverage the contrast between the high albedo of bare dune sand with the relatively lower albedo of vegetated dunes, in a manner similar to Belford et al.'s (2014) time-series analysis of three Lake Michigan coastal dunes using repeat aerial imagery. More specifically, because the ISODATA ML algorithm effectuates its classification of an image by clustering pixels into statistically alike bins, we expected that a high-albedo bare sand cluster would naturally emerge separately amid a large lake, mid-latitude temperate forests, and other vegetation and built structures. The ISODATA method runs multiple iterations, regrouping pixels into possible bins, recalculating their means, and assessing the effects on pixel organization before statistically determining pixel classification (Campbell, Reference Campbell1996, p. 337; Abbas et al., Reference Abbas, Minallh, Ahmad, Abid and Khan2016; Ma et al., Reference Ma, Liu, Zhao, Zhang, Liu, Ren, Zhang and Li2020). After using ArcGIS to generate a rasterized pixel cluster of bare sand at a blowout location, we converted the blowout raster to a vector polygon. Some feature editing was necessary to separate the blowout throat from Lake Michigan's coastal foreshore, because this usually is not classified as part of a dune blowout. From this, we were able to create a geospatial inventory of coastal dune blowouts on Lake Michigan's eastern shore at three timestamps beginning in 1938. We also calculated each blowout's physical area, upwind orientation, and computed the amount of dune loss to human development, where applicable.
Assessing the accuracy and uncertainty of aerial image analyses of the environment is difficult given the numerous sources of error and lack of uniform standards in aerial imagery studies (Lunetta et al., Reference Lunetta, Congalton, Fenstenmaker, Jensen, McGwire and Tinney1991), especially in dynamic coastal areas (Moore, Reference Moore2000; Smyth et al., Reference Smyth, Wilson, Rooney and Yates2022). Within our workflow, potential sources of error included the horizonal accuracy of the original photographs, the georeferencing process for the 1938 and 1986–1988 aerial images, the resampling of 1938 and 2018 aerial imagery, the ISODATA bare sand classification process, and the conversion of ISODATA rasterized results to vector polygons (Lunetta et al., Reference Lunetta, Congalton, Fenstenmaker, Jensen, McGwire and Tinney1991; Congalton, Reference Congalton1997; Moore, Reference Moore2000; Mathew et al., Reference Mathew, Davidson-Arnott and Ollerhead2010; Abhar et al., Reference Abhar, Walker, Hesp and Gares2015). In addition to calculating the RMSE associated with the georeferencing process (see above), we estimated uncertainty (Table 1). Somewhat similar to Mathew et al. (Reference Mathew, Davidson-Arnott and Ollerhead2010) and Abhar et al. (Reference Abhar, Walker, Hesp and Gares2015), we calculated uncertainty by adding the published horizonal error from each aerial photo dataset, the RMSE generated after georeferencing, and estimated delineation error from resampling and vectorization. Our uncertainty values are in line with those reported by Mathew et al. (Reference Mathew, Davidson-Arnott and Ollerhead2010) and Abhar et al. (Reference Abhar, Walker, Hesp and Gares2015) and in most cases are within 1 m. This approach was adopted because our focus was bare sand identification and changes in blowout morphology. Because this study sought only to identify bare sand, we did not calculate the error matrix typically associated with remote sensing land cover classification analyses (Foody, Reference Foody2002). As such, we did not assess classification accuracy or generate user and producer error statistics.
To determine whether blowouts in 1938 differ statistically from blowouts in 2018, we used a Wilcoxon signed-ranks test. This test is the nonparametric equivalent of the paired samples t-test and was selected because we assumed the distribution of blowout size for both timestamps would be nonnormative (Wilcoxon, Reference Wilcoxon1945; Corder and Foreman, Reference Corder and Foreman2009). The Wilcoxon signed-ranks test was designed to compare a set of two paired samples of data to determine if significant differences exist between the sets. To do this, blowouts were ranked based upon the absolute value of the difference between the values of each pair, which in this case was the blowout size in square meters for 1938 and 2018 (Corder and Foreman, Reference Corder and Foreman2009) (Equation 1). The sign difference is recorded, then all the number of positive ranks (ΣR+) and negative ranks (ΣR-) are summed separately (Corder and Foreman, Reference Corder and Foreman2009). The lesser of ΣR+ and ΣR- is the T-statistic, which is then fed into a formula to calculate the Z-statistic, a commonly used metric in trend analyses (Corder and Foreman, Reference Corder and Foreman2009; Gocic and Trajkovic, Reference Gocic and Trajkovic2013):

where x̄T is the mean of the T-statistic and ST is its standard deviation. In terms of aeolian geomorphology research, the Wilcoxon signed-ranks test was used recently in a study of soil differences in coastal sand dunes, although the specific Z-statistic results were not divulged (Lopez et al., Reference Lopez, Hegy and Missimer2020). We calculated the Z-statistic from the Wilcoxon signed-ranks test for blowout sizes using the Two-Related Samples tool in IBM SPSS Statistics 27 (IBM Corp., 2020). To isolate the statistical analysis from anthropogenic influences, we removed from the Wilcoxon signed-ranks test all blowouts where human development visibly contributed to blowout loss. We also removed all blowouts from the test that had any missing data for either 1938, 1986–1988, or 2018. Typically, the null hypothesis for a Wilcoxon signed-ranks test is that no differences exist between the 1938 and 2018 blowout sizes; our research hypothesis, however, was otherwise.
STAMP Model
Although time-series analyses of dune behavior using repeat aerial imagery is relatively common in aeolian geomorphology, the manner in which landscape change is assessed often diverges among studies. Scientists have used edge tracing over multiple images to study dune migration in Indiana on Lake Michigan southern shore (Kilibarda and Shillinglaw, Reference Kilibarda and Shillinglaw2015), geographic information system (GIS) edge detection methods for three dunes near Holland in Michigan (Belford et al., Reference Belford, Kenbeek, VanHorn, van Dijk, Fisher and Hansen2014), remote sensing surface classifications in France (Rapinel et al., Reference Rapinel, Clément, Magnanon, Sellin and Hubert-Moy2014), and an object-oriented approach at Cape Cod (Abhar et al., Reference Abhar, Walker, Hesp and Gares2015), among other techniques. Here, we utilized an object-based image analysis technique advanced by Abhar et al. (Reference Abhar, Walker, Hesp and Gares2015) in their study of coastal dune blowouts on Cape Cod in Massachusetts (USA). They employed a STAMP model, a process first proposed by Sadahiro and Umemura (Reference Sadahiro and Umemura2001) and codified into a model by Robertson et al. (Reference Robertson, Nelson, Boots and Wulder2007). A STAMP model attempts to measure and classify the spatial changes in objects over time by quantifying their topologies and movements (Sadahiro and Umemura, Reference Sadahiro and Umemura2001; Robertson et al., Reference Robertson, Nelson, Boots and Wulder2007). Changes are measured quantitatively as the difference between T1 and T2 timestamps, and the change is then classified into categories, including “expansion,” “stable,” and “contraction” (Figure 2). From this, landform changes over time can be described. For our study, the STAMP model evaluated two types of time-transgressive events: (1) changes in two-dimensional (2-D) blowout morphology between 1938 and 1986–1988, and (2) changes in 2-D blowout morphology between 1986–1988 and 2018. Together, we predicted that analyses of these two events would yield possible mesoscale blowout behavioral trends, including possible blowout fragmentation. To run the STAMP model for all identified blowout locations, we utilized the R software package stampr (Long et al., Reference Long, Robertson and Nelson2018).
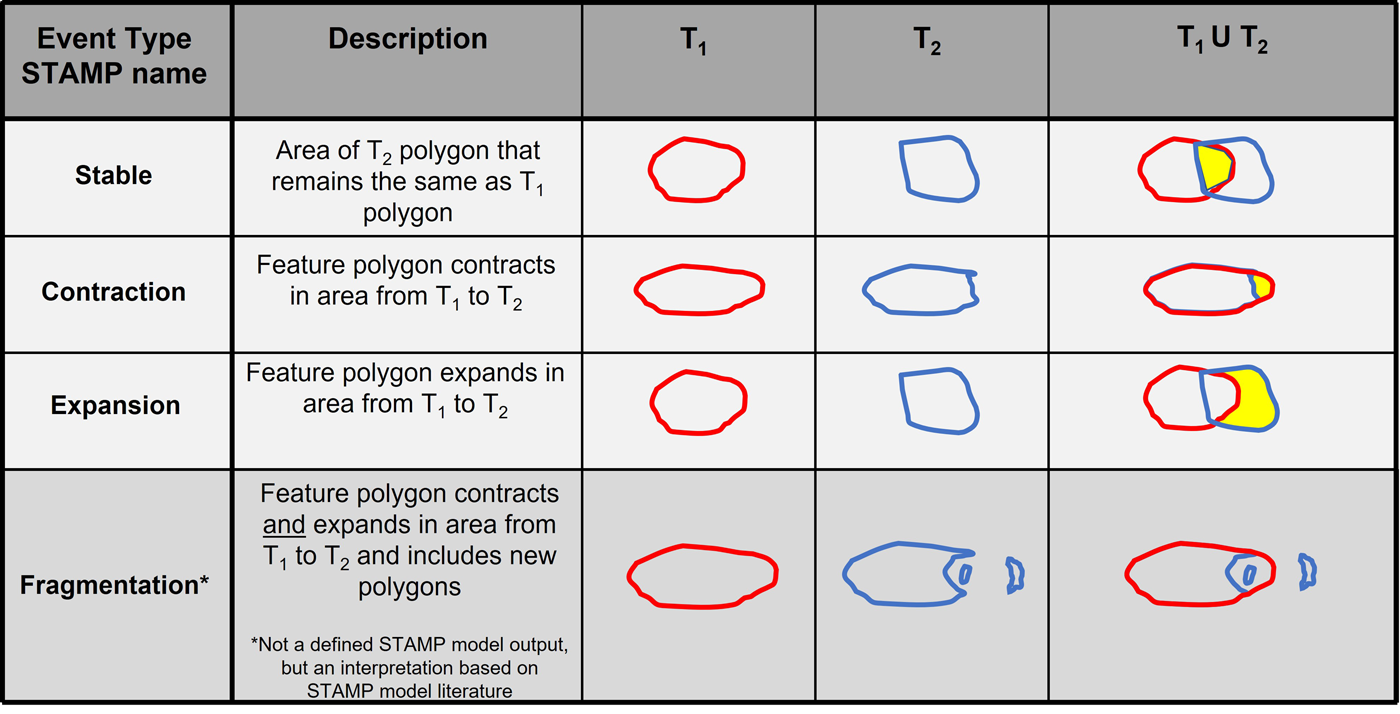
Figure 2. STAMP model event types used in our analysis (modified from Abhar et al., Reference Abhar, Walker, Hesp and Gares2015). T1 and T2 represent feature extent at two different timestamps.
RESULTS
Blowout identification and characteristics
Our analysis identified 435 blowout features in 1938 along Lake Michigan's eastern shore and on six islands: South Manitou, North Manitou, South Fox, North Fox, High, and Beaver (Figure 3, Table 2). Active blowouts accounted for at least ~19.1M m2 or ~4700 acres in 1938, according to our analysis. By 2018, that number dropped to ~12M m2 or ~3000 acres, consisting of a loss of >7.1M m2 or 1700 acres since 1938—a decrease of ~37%. Dune blowouts, however, represent a tiny proportion of the study area's total aeolian landscape. Blowouts in 2018 accounted for just 2.9% of the ~102,500 acres of dunes along the eastern shore of Lake Michigan, based upon overall dunefield totals from the statewide dune database compiled as part of the Arbogast et al. (Reference Arbogast, Garmon, Sterrett Isely, Jarosz, Kreiger, Nicholls, Queen and Richardson2018) study.
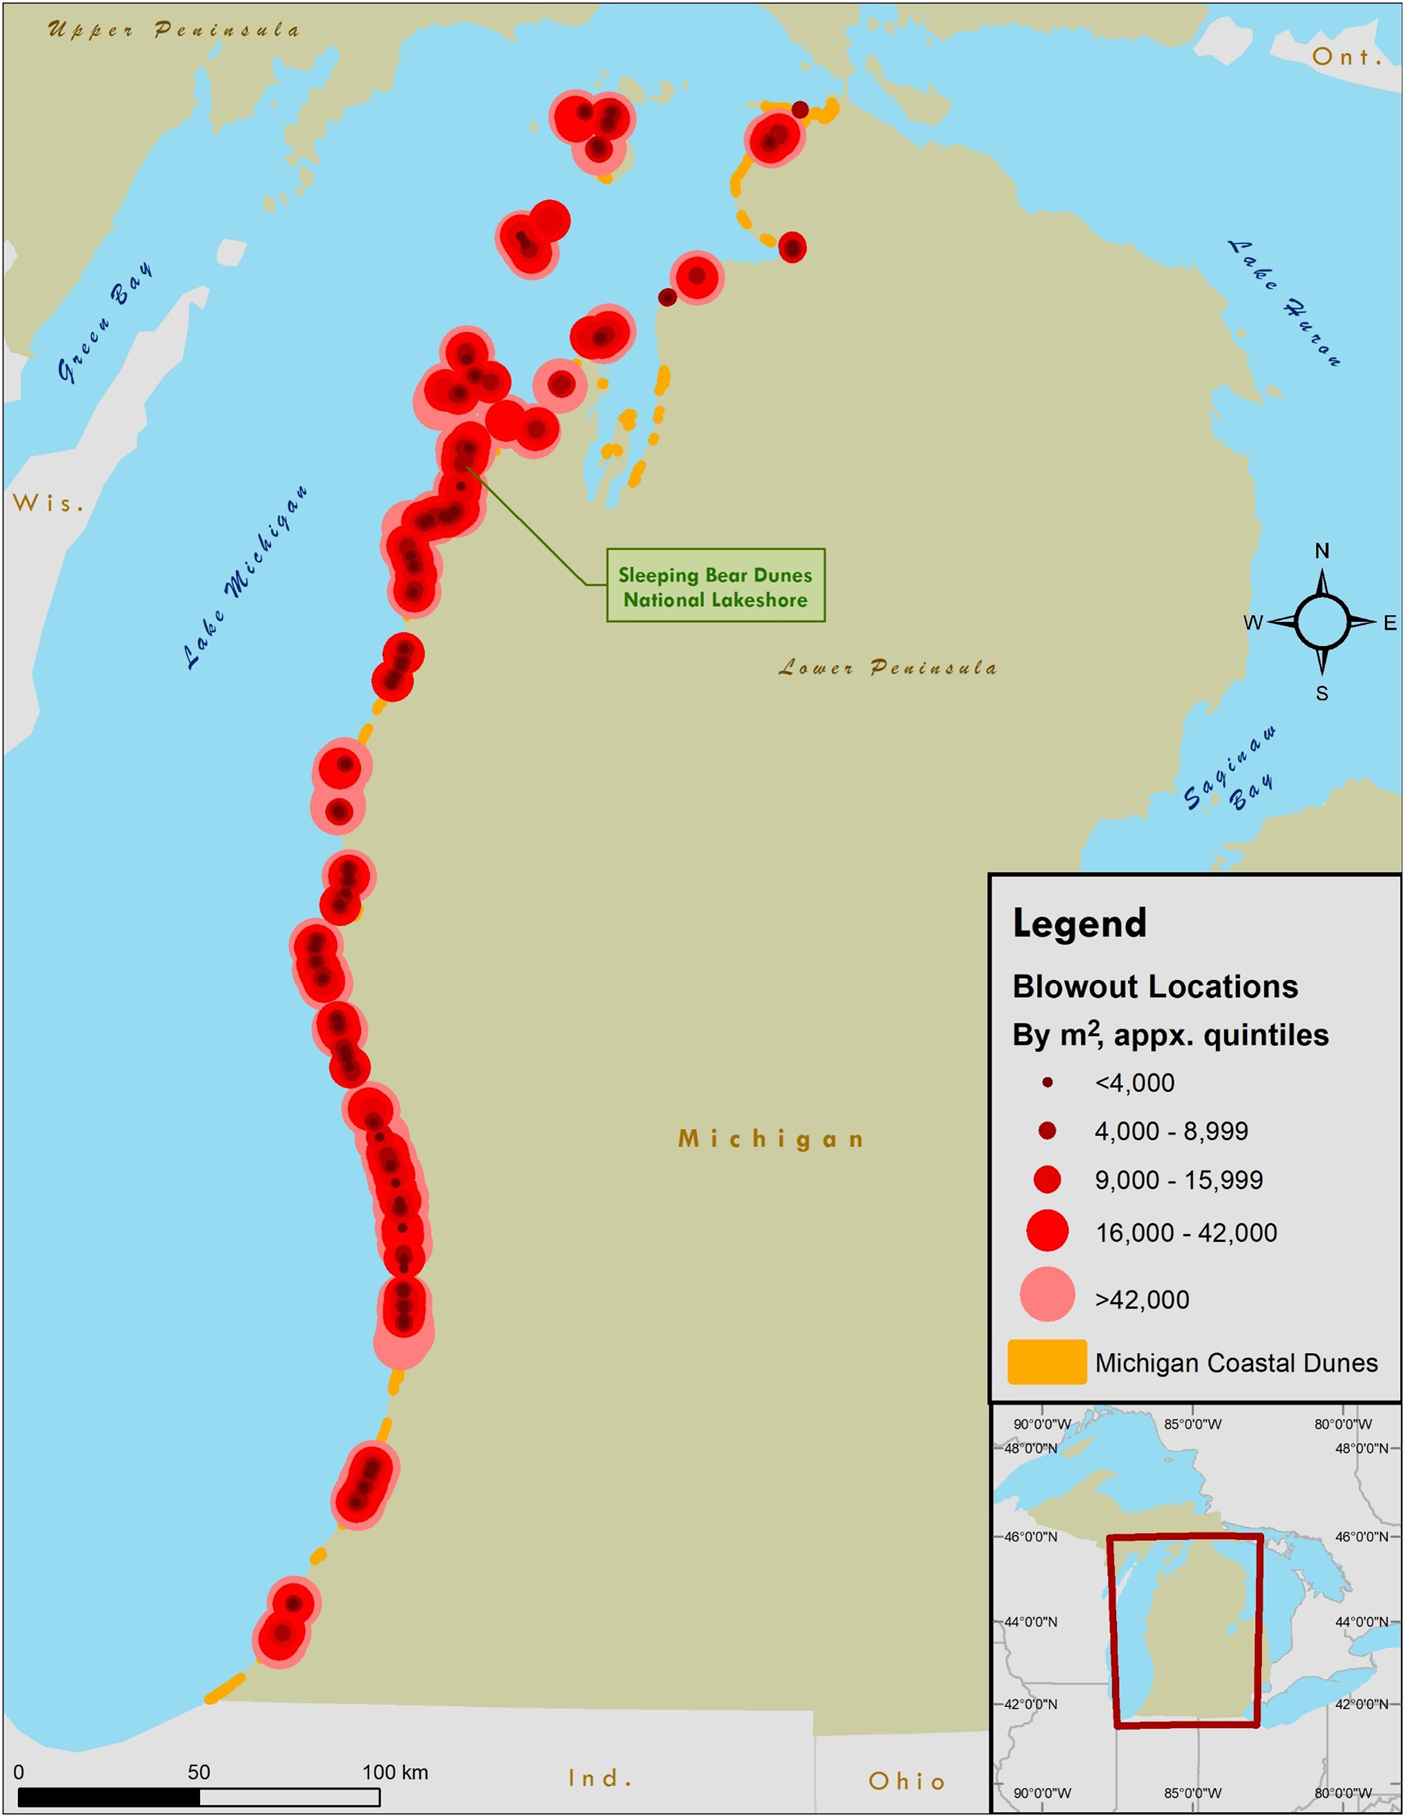
Figure 3. Blowout mapping results. Locations with 1938 spatial extent.
Table 2. Blowout mapping results, organized geographically north to south. Some 1938 data are missing for Manistee County, thus the percentage change over time in blowout extent and computation of the loss due to human development there cannot be calculated completely. Some scattered totals may be incomplete for 1986–1988 for this reason, too. *Counties that contain islands with blowouts.

Spatially, Lake Michigan's coastal dunes have been differentiated between dunefields north and south of the isostatic hinge line, which cuts across the lakeshore near Arcadia in northern Manistee County (Larsen, Reference Larsen1987; Lovis et al., Reference Lovis, Arbogast and Monaghan2012). Generally, north of the hinge line, large, perched dune complexes and progradational systems in embayments are more common, because ongoing isostatic rebound has a great influence on coastal and aeolian processes. By contrast, south of the hinge line, coasts are isostatically stable and dunes are influenced more by lake level fluctuations (Lovis et al., Reference Lovis, Arbogast and Monaghan2012). Using this glacioisostatic spatial division of the lakeshore, there are 166 blowouts south of the hinge line and 269 blowouts in the isostatically active north. According to a volumetric analysis of the dunefields in the study area, less than half of the shoreline's dune sand is north of the hinge line at Arcadia (Arbogast et al., Reference Arbogast, Shortridge and Bigsby2009). Yet, the coastal regions north of Arcadia contain ~62% of the blowouts. Conversely, blowouts in the south lost more area overall (~1300 acres) and per blowout (~8 acres/site) than did blowouts in the north (~400 acres total, ~1.5 acres/site), despite having fewer blowouts. Spatially, Leelanau County, north of the hinge line and home to Sleeping Bear Dunes National Lakeshore, contains the largest number of blowouts with 116. Benzie County, just north of the hinge line and south of Leelanau County, has 90 blowouts, which is the second-highest total.
Some blowouts have disappeared. In 1938, Lake Michigan's eastern shore and islands had 435 blowouts, but 37 of those had disappeared completely by 2018. Of those 37 blowouts, 35 disappeared due to human development. In all, 55 blowouts (12.6% of all 1938 blowouts) shrank in size partially or completely disappeared due to human development, primarily the construction of residential structures. Development accounted for a decrease of ~1.4M m2 or ~350 acres in blowout extent between 1938 and 2018. Ottawa County lost by far the largest amount of blowout areas to development since 1938, losing ~870,000 m2 or ~215 acres along its ~40-km-long coast. This loss in Ottawa County is >50% of all blowout extent lost to human development in our study.
Although declines attributed to human development were an important component of blowout loss since 1938, most blowouts (313 or 72% of all blowouts) decreased in area due to the expansion of vegetation. In total, 368 blowouts (85%) contracted in size or disappeared from 1938 to 2018. Not all blowouts decreased in size or disappeared, however (e.g., 53 blowouts expanded since 1938, some greatly). The largest expansion in blowout size occurred in a Benzie County blowout in Crystal Lake Township off George Street; this blowout quadrupled in size over the 80-year time-series analysis. Mostly due to image quality issues, there was insufficient data to determine whether 14 blowouts expanded or contracted in size during the period in question. Regarding our analysis of blowouts at the 1986–1988 timestamp, we determined that blowouts had contracted at a higher rate over those ca. 50 years since 1938 (~25 acres/yr) than in the 30-year period between 1988 and 2018 (~16 acres/yr), exclusive of those affected by development, although we lacked data for 35 sites for the 1986–1988 timestamp.
According to the results of the Wilcoxon signed-ranks test, the differences in blowout extent between 1938 and 2018 are statistically significant (Table 3). The Z-statistic value of −13.526 exceeded the critical threshold, signifying significant differences between the two years. The Z-statistic is straightforward in its interpretation: the null hypothesis is rejected if Z > ±1.96 at the 5% significance level (Gocic and Trajkovic, Reference Gocic and Trajkovic2013). Moreover, the sum of the negative ranks exceeded the positive ranks by a factor of 10, a condition that could be interpreted as a strong negative trend in blowout extent (Corder and Foreman, Reference Corder and Foreman2009).
Table 3. Results of the Wilcoxon signed-ranks test. The null hypothesis is rejected if Z > ±1.96 at the 5% significance level (Gocic and Trajkovic, Reference Gocic and Trajkovic2013). Thus, significant differences exist in the blowout extent from 1938 to 2018.

Also importantly, we found no new blowouts since 1938, except small anthropogenically driven blowout-like features that occurred due to landscaping efforts at a handful of sites. These were not mapped or analyzed. However, the absence of new natural blowouts since 1938 potentially supports the findings that a negative trend in blowout activity is underway, as explained by the Wilcoxon signed-ranks test results. Additional analyses illuminated geomorphic characteristics of the region's blowouts. For example, no relationship was found between magnitude of loss/gain in blowout extent and 1938 blowout size. In addition, both saucer and trough blowouts were found along the shore, but trough blowouts were more prominent (Table 4). However, the distribution of blowout type may be explained by geomorphic position. For example, several saucer blowouts were located on embayments, especially in the north (e.g., Platte Bay area south of Sleeping Bear). Positionally, most dunes are oriented perpendicular to the shore, with westerly orientations most common (Figure 4; Table 2).

Figure 4. Blowout orientation, measured as the direction of the longitudinal axis of the blowout from its depositional lobe to its mouth. Thus, a blowout with a northerly orientation has its mouth north of its southerly depositional lobe and a north-south trending axis.
Table 4. Blowout morphology by type and county. The complex category represents blowout sites exhibiting both trough and saucer morphologies or locations that transitioned between morphologies since 1938. Some of these “complex” sites could best be categorized as fitting Ritchie's (Reference Ritchie1972) “cauldron and corridor” morphology.

STAMP Model
Fragmenting blowouts, examples of which can be seen in Figures 5 and 6, were observed in all sections of the shoreline through our analysis of the aerial images. Furthermore, the STAMP model determined that most blowouts, except those that had disappeared, both contracted significantly and expanded somewhat into new polygons, which can be interpreted partly as polygonal fragmentation (Robertson et al., Reference Robertson, Nelson, Boots and Wulder2007). Moreover, contraction, as measured by the STAMP model, was roughly twice the expansion of blowouts in 1986–1988 and 2018 (Fig. 7) (Long et al., Reference Long, Robertson and Nelson2018). Setting aside the photographic evidence from our aerial imagery analysis, it is unlikely that blowout contraction as measured by the STAMP model took place only at the polygonal boundaries of blowouts, given the 2:1 ratio of contraction to expansion. Instead, blowout fragmentation likely occurred to some degree within the previous extent of blowout polygons. In addition to blowout extent, the STAMP model also calculated the direction of blowout expansion, if any occurred. The results showed that some blowouts expanded downwind, even if the overall area of the blowout had decreased by 2018. Other blowouts prograded. Thus, no overall pattern of progression either leeward or windward was evident.
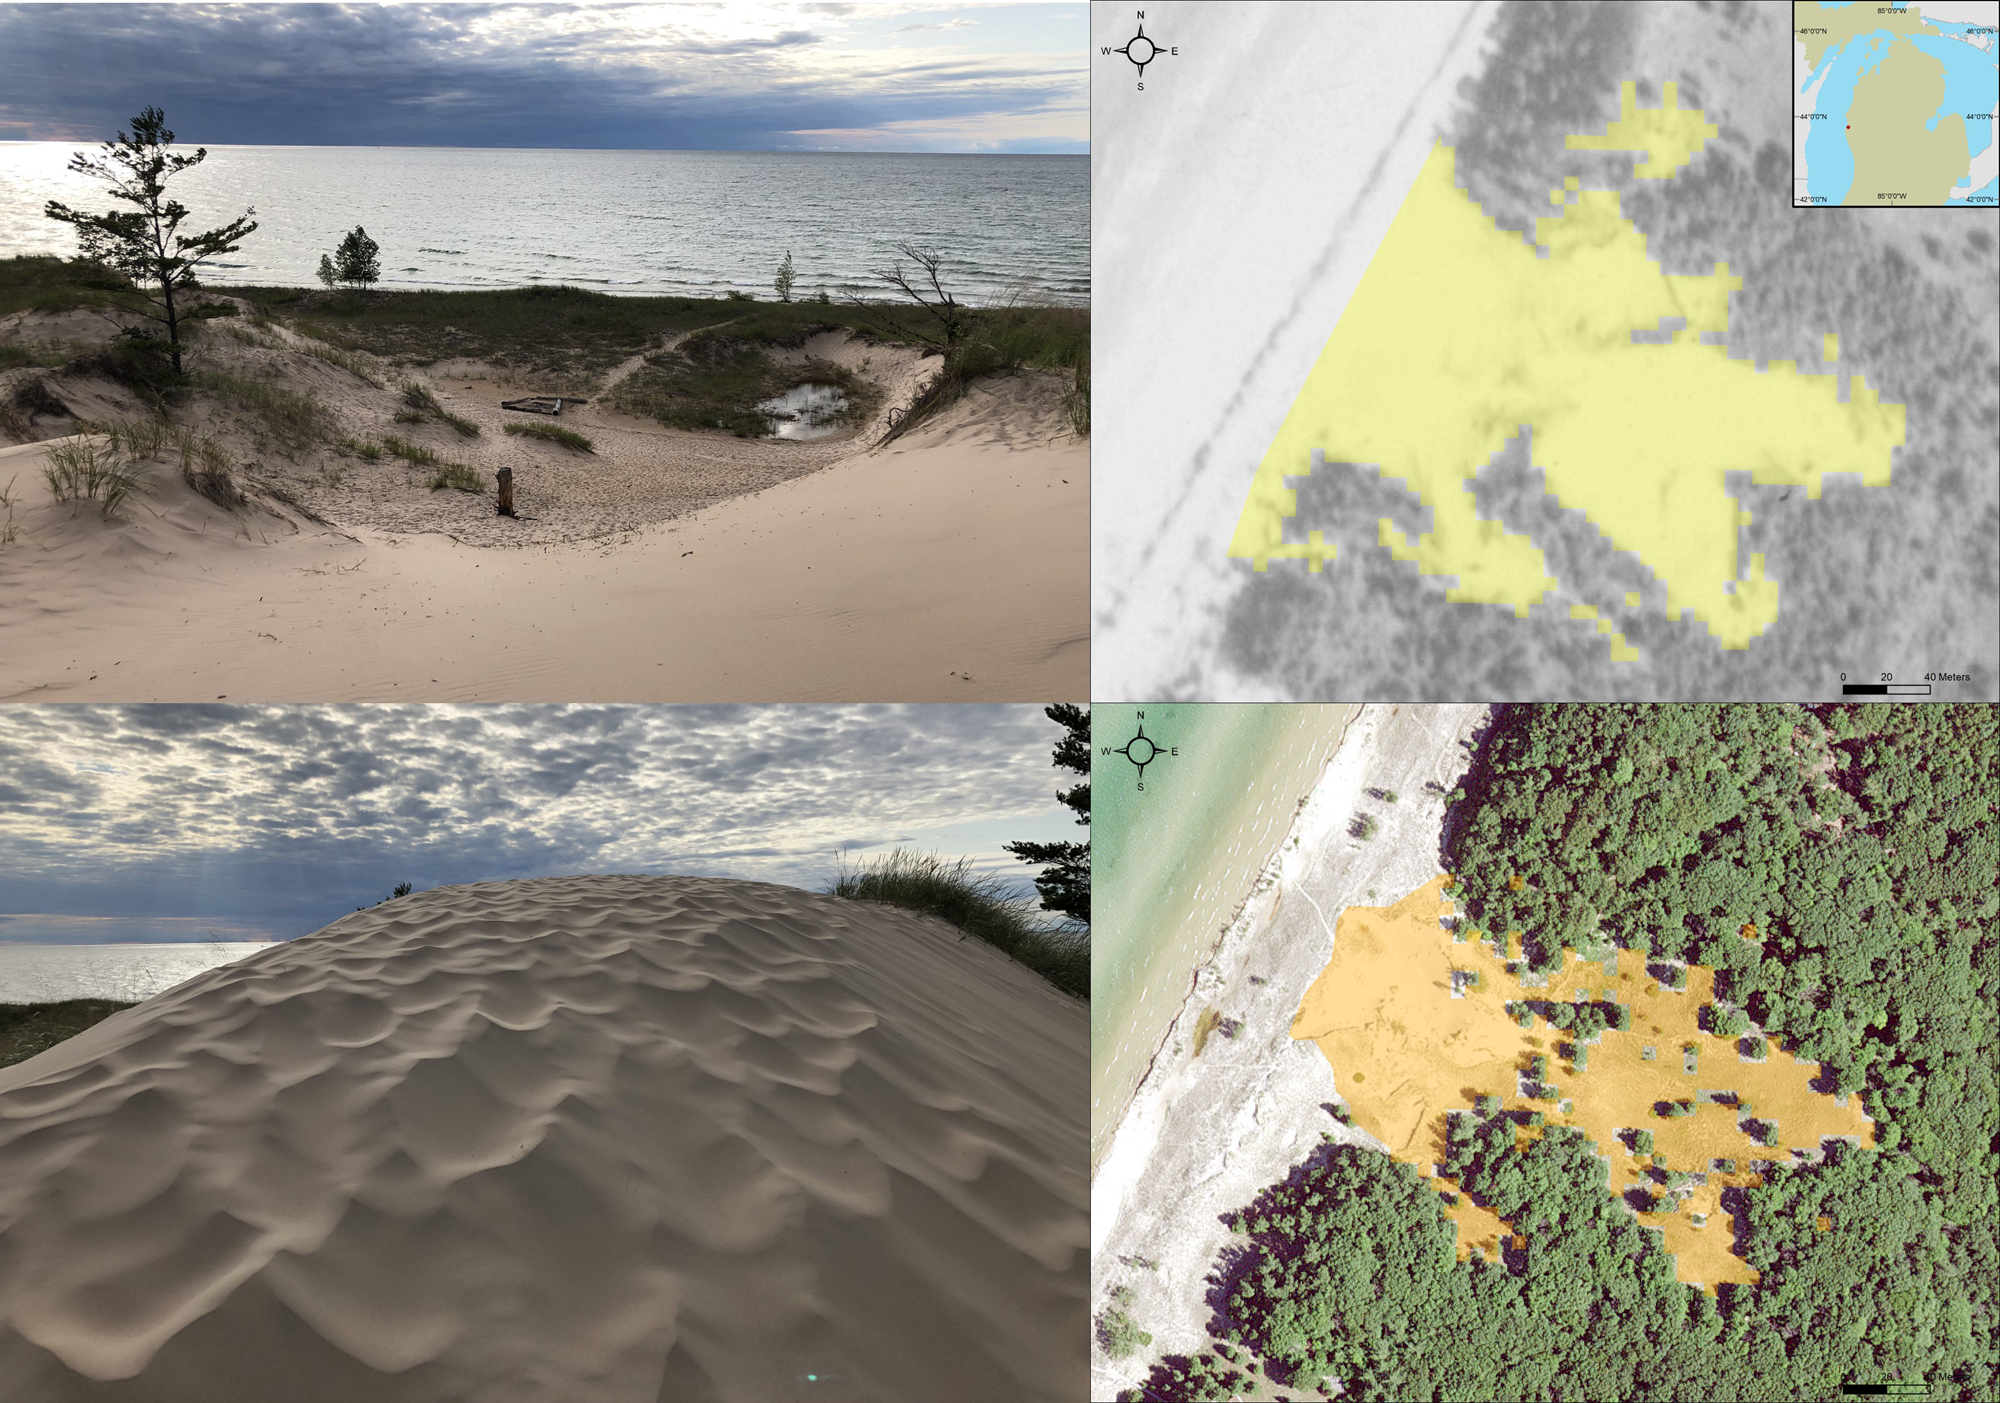
Figure 5. Blowout at Pentwater, Michigan, in Oceana County. On left, photographs from summer 2019 of the deflation basin (top) and depositional lobe (bottom). On right, blowout mapping results from 1938 (top) and 2018 (bottom). The 2018 results show fragmentation from sentinel trees and grasses. Ground-level photographs (left) taken by K.G. McKeehan.

Figure 6. Examples of fragmentation of blowouts since 1938. Top row of images is from a blowout in Laketown Township, Michigan; bottom row of images is from South Fox Island in Lake Michigan. The images show the fragmentation of each blowout beginning in 1938 (left), 1986 (center), and 2018 (right).

Figure 7. STAMP analysis results. Each line tracks the trends in various STAMP categories from 1938 to 2018, including the area in m2 determined to have remained within the blowout (Stable), the area lost within a blowout (Contract), and new blowout areas (Expand). Added to the figure are the areas associated with human development, the total blowout area, and the area-to-perimeter ratio (A:P) of each blowout polygon. The A:P ratio, a fractal geography metric, is interpreted here as a measure of fragmentation, as is the outpacing of contracted extent over expanded areas.
DISCUSSION
Our results show that most blowouts along the eastern shore of Lake Michigan have contracted in size since 1938, the starting point of our spatiotemporal analysis. Further, no new significant blowouts were detected at either the 1986–1988 or 2018 timestamps, other than a handful of incidents tied directly to attempts at landscaping and terraforming windward of lakefront residential properties. This fits a broad, global trend toward dune stabilization as observed in other studies (e.g., Gao et al., Reference Gao, Kennedy and Konlechner2020), including the trend of vegetation expansion in European coastal dunes since 1900 (Provoost et al., Reference Provoost, Jones and Edmondson2011; Jackson et al., Reference Jackson, Costas, González-Villanueva and Cooper2019a). Instead of expansion, most existing blowouts are not only contracting, but fragmenting, according to our analysis. Part of this broad reduction in blowout extent is the fragmentation of the bare sand areas of most blowouts, especially within their deflation basin, per the STAMP model results. Two questions emerge from these findings. First, what processes are driving this response by vegetation and blowouts? Second, if modern conditions are not conductive to blowout generation and expansion beyond the typical downwind expression of deflated sand onto the depositional lobe, then under what conditions did Lake Michigan's coastal dune blowouts form?
Regarding the process-response formulation that is driving blowout fragmentation, our findings suggest that either sand supply has diminished, vegetation growth has accelerated beyond the threshold at which incoming sand can suppress it, or some combination of both processes. Lovis et al. (Reference Lovis, Arbogast and Monaghan2012) speculated that the sand supply for Lake Michigan's coastal dunes had decreased in the last 500 years. Sand supply to coastal dunes can be fostered or constrained by several interrelated variables, including those related to lake levels and wind. High water levels on Lake Michigan are related to dune activity and increased sand supply, according to several studies (Dow, Reference Dow1937; Olson, Reference Olson1958c; Anderton and Loope, Reference Anderton and Loope1995; Loope and Arbogast, Reference Loope and Arbogast2000; Lovis et al., Reference Lovis, Arbogast and Monaghan2012). Mechanically, erosion of bluff sediment and beaches and the amount of foredune sand increase during periods of high lake levels, according to this model. Increased erosion feeds more sand into the coastal system, making it available for entrainment downwind into the dune system once delivered into the foreshore (Pye, Reference Pye1983). The active transport of deflating or saltating sand through the dune system often simultaneously hampers vegetative growth and stimulates additional aeolian activity through landscape destabilization. Under these conditions in this model, the rate and manner of shoreline and beach retreat often are coupled with the rate of active inland dune migration—a geomorphic system state termed “beach negative; dune steady” by Sherman and Bauer (Reference Sherman and Bauer1993).
Yet, evidence also indicates the contrary. Nearshore, foreshore, and dune zones are coupled in complex ways that vary spatially and temporally, creating multiple possible “disequilibrium” and steady states (Sherman and Bauer, Reference Sherman and Bauer1993). Importantly for this study, foreshore morphology, which is influenced by nearshore processes such as waves, swash, and longshore action (Salisbury, Reference Salisbury1952; Short and Hesp, Reference Short and Hesp1982; Short, Reference Short2012), affects the amount of sand supplied to the dune zone (Sherman and Bauer, Reference Sherman and Bauer1993; van Dijk, Reference van Dijk2004). Wide beaches, such as those possibly resulting from low levels on Lake Michigan, are associated with dissipative, yet high-energy, environments (Short and Hesp, Reference Short and Hesp1982). Wide beaches create the conditions for increased deposition of sediment on the foreshore and then the increased potential landward transport of sand due to the relatively longer fetch across the beach (Short and Hesp, Reference Short and Hesp1982; Davidson-Arnott, Reference Davidson-Arnott1988; Sherman and Bauer, Reference Sherman and Bauer1993; Bauer and Davidson-Arnott, Reference Bauer and Davidson-Arnott2003; Delgado-Fernandez, Reference Delgado-Fernandez2010; Nordstrom, Reference Nordstrom, Masselink and Gehrels2015; Hesp and Smyth, Reference Hesp, Smyth, Vila-Concejo, Bruce, Kennedy and McCarroll2016). In an extensive study of coastal dunes at a state park in Michigan, van Dijk (Reference van Dijk2004) found that foredune growth occurred between 2000 and 2003 during a period of low lake levels and wide beaches at the study site. Foredune growth did curtail sand supply to a dune rim downwind that was associated with a blowout (van Dijk, Reference van Dijk2004), but such a circumstance seems to support the innate complexity of the process-response and ecogeomorphic mechanisms in coastal dune systems (Sherman and Bauer, Reference Sherman and Bauer1993; Walker et al., Reference Walker, Davidson-Arnott, Bauer, Hesp, Delgado-Fernandez, Ollerhead and Smyth2017). Rather than driving all geomorphological components of the aeolian system in the state park into the same state, lower lake levels caused one response at the foredunes and another in the backdunes (van Dijk, Reference van Dijk2004), which underscores Carter's (Reference Carter and Carter1991) “natural heterogeneity” in dunefields. This bifurcated response echoes observations in dunefields elsewhere, either a cycled reworking or churning of dunes (e.g., Black, Reference Black1951; Dech et al., Reference Dech, Maun and Pazner2005), or even a state of “bistability” (e.g., Yizhaq et al., Reference Yizhaq, Ashkenazy and Tsoar2007).
Therefore, lake levels on Lake Michigan seem unlikely to be the primary driver of blowout state as outlined in our study. Both dune activity models involving lake levels are likely correct at any given time, but neither is predominant now. Over the course of our 80-year spatiotemporal study, Lake Michigan-Huron basin water levels fluctuated at a high frequency on roughly annual and decadal cycles around the modern mean (Bishop, Reference Bishop1990; Baedke and Thompson, Reference Baedke and Thompson2000; Watras et al., Reference Watras, Read, Holman, Liu, Song, Watras, Morgan and Stanley2014; Indiana DNR, 2020). Water levels can fluctuate as much as ~1 m annually in the extreme or up to almost 2 m over a decade, according to an analysis of historical data (Argyilan and Forman, Reference Argyilan and Forman2003). There have been periods of both below- and above-average lake levels (Theuerkauf et al., Reference Theuerkauf, Mattheus, Braun and Bueno2021), reflecting transient monthly, seasonal, annual, ca. 30-year, ca. 150-year, and other cycles that are sometimes evident during periods since the Nipissing high stand (Thompson and Baedke, Reference Thompson and Baedke1997; Quinn, Reference Quinn2002; Argyilan and Forman, Reference Argyilan and Forman2003; Watras et al., Reference Watras, Read, Holman, Liu, Song, Watras, Morgan and Stanley2014). Moreover, since 2013, lake levels have been historically high (Indiana DNR, 2020; Theuerkauf et al., Reference Theuerkauf, Mattheus, Braun and Bueno2021). Yet, while lake levels fluctuate, no broad related trends exist that can explain blowout fragmentation or the lack of new blowouts. In other words, as Lake Michigan-Huron levels continue to cycle and change, albeit within a smaller range (Quinn, Reference Quinn2002), regional-scale blowout behavior has apparently decoupled—if it was ever coupled—from lake behavior and continued to trend toward fragmentation and stabilization at the impetus of vegetation expansion. Thus, other drivers likely are more influential.
An additional possible driver of decreased sand supply is a reduction in wind power. Some studies place wind power, or wind energy, at the forefront of dune behavior (e.g., Tsoar, Reference Tsoar2005; Gunn et al., Reference Gunn, East and Jerolmack2022), but other studies find it has less influence in aeolian landscapes than anticipated (e.g., Mason et al., Reference Mason, Swinehart, Lu, Miao, Cha and Zhou2008). Regardless, in coastal dunefields, the geomorphic function of wind includes transporting sand landward from the foreshore, a process involving a series of boundary layer adjustments (Walker et al., Reference Walker, Davidson-Arnott, Bauer, Hesp, Delgado-Fernandez, Ollerhead and Smyth2017). Deflating and saltating sand, along with the winds compelling these aeolian processes, interact with foreshore and dune topography, developing complex steering patterns and affecting dune surfaces and vegetation, among other features (Pluis, Reference Pluis1992; Arens, Reference Arens1996; Bauer et al., Reference Bauer, Davidson-Arnott, Walker, Hesp and Ollerhead2012). As stated earlier, winds also can induce dune blowouts and guide their morphology (Melton, Reference Melton1940; Cooper, Reference Cooper1958; Hesp, Reference Hesp2002; Schwarz et al., Reference Schwarz, Brinkkemper and Ruessink2018).
Yet, determining wind energy as the primary driver stabilizing Lake Michigan's blowouts is difficult given the conflicting research results regionally and globally. Regionally, there is some evidence that wind energy may have declined as much as 40% along the eastern shoreline since 1960 (Yurk and Hansen, Reference Yurk and Hansen2021), although there is also evidence that mean annual wind speed, drift potential, and other wind-influenced dune mobility indices, such as Lancaster's M (Lancaster and Helm, Reference Lancaster and Helm2000), remained relatively unchanged over a similar period of time or declined slightly in the study area (McKeehan and Arbogast, Reference McKeehan and Arbogast2021). Likewise, there is evidence that winds over various decadal time periods have decreased globally (Vautard et al., Reference Vautard, Cattiaux, Yiou, Thépaut and Ciais2010; McVicar et al., Reference McVicar, Roderick, Donohue, Li, Van Niel, Thomas and Grieser2012; Jackson et al., Reference Jackson, Costas, González-Villanueva and Cooper2019a; Tian et al., Reference Tian, Huang, Hu and Niyogi2019), increased over some oceans but decreased terrestrially (Torralba et al., Reference Torralba, Doblas-Reyes and Gonzalez-Reviriego2017; Zeng et al., Reference Zeng, Piao, Li, Ciais, Li, Cai, Yang, Liu and Wood2018), strengthened across Lake Superior to the north of our study area (Desai et al., Reference Desai, Austin, Bennington and McKinley2009), and weakened across Minnesota to the northwest (Klink, Reference Klink2002). Furthermore, the “stilling” of terrestrial winds, possibly due to the “greening” of land via expansion of vegetation (Zeng et al., Reference Zeng, Piao, Li, Ciais, Li, Cai, Yang, Liu and Wood2018; Jackson et al., Reference Jackson, Costas, González-Villanueva and Cooper2019a), that has been observed over the last several decades may be reversing (Zeng et al., Reference Zeng, Ziegler, Searchinger, Yang, Chen, Ju and Piao2019; Utrabo-Carazo et al., Reference Utrabo-Carazo, Azorin-Molina, Serrano, Aguilar, Brunet and Guijarro2022).
In other words, no clear pattern with regards to wind energy has emerged yet in the Lake Michigan basin or anywhere else regionally. Moreover, wind data, whether from reanalysis or observational datasets, are often hampered by issues of completeness, error, and uncertainty (Julian, Reference Julian1983; Morone, Reference Morone1986; Torralba et al., Reference Torralba, Doblas-Reyes and Gonzalez-Reviriego2017; Yin et al., Reference Yin, Han, Gao and Chen2021) and should be employed with caution. Given these mixed results, it is difficult to proclaim with certainty that a loss of wind energy across the study area is responsible for a reduction in sand supply in regional dunefields, although it could be a contributing variable.
A third factor in a potential regional reduction in sand supply is precipitation, which is a variable that has been identified in multiple dune models as a key control on vegetation (e.g., Ashkenazy et al., Reference Ashkenazy, Yizhaq and Tsoar2012; Delgado-Fernandez et al., Reference Delgado-Fernandez, O'Keeffe and Davidson-Arnott2019). Precipitation performs several ecogeomorphic functions in aeolian systems. Moist dune sand surfaces can increase the shear wind velocity threshold by which sand deflates, dampening aeolian erosion (Pluis, Reference Pluis1992; Cornelis and Gabriels, Reference Cornelis and Gabriels2003; Han et al., Reference Han, Qu, Liao, Zhu, Zhang, Zu and Niu2011). Precipitation in the form of ice and snow has a chilling effect on wind erosion, as well (Doing, Reference Doing1985; van Dijk, Reference van Dijk2004, Reference van Dijk, Fisher and Hansen2014). On the other hand, falling precipitation can also stimulate additional sand supply through splash erosion, which is the process by which sediment grains are knocked loose from the dune crust and made available for later wind entrainment (Jungerius and van der Meulen, Reference Jungerius and van der Meulen1988; Riksen and Goossens, Reference Riksen and Goossens2007). Like most dune processes, even splash erosion is entangled with other variables in feedback mechanisms and process-response frameworks. For example, the effectiveness of splash erosion on dunefield sand supply depends upon the density of dune vegetation. If annual precipitation increases, the effectiveness of splash erosion might increase temporarily until soil moisture reaches a threshold at which vegetation coverage might increase as well, which in turn limits the effectiveness of splash erosion to affect sand supply.
Regardless, this description of splash erosion alludes to the main ecogeomorphic function of precipitation—the conduction of water into the sandy soil medium. As Tsoar (Reference Tsoar2005, p. 50) noted the “singular physical characteristic of the sandy soil” is the rapid delivery of water through the soil profile to the water table. Sand lacks the cohesion to hold water within its pores because the spaces between grains are relatively large (Salisbury, Reference Salisbury1952; Dincer et al., Reference Dincer, Al-Mugrin and Zimmermann1974; Schaetzl and Anderson, Reference Schaetzl and Anderson2005; Tsoar, Reference Tsoar2005). This feature of sand is true regardless of the environment because both arid and humid sand dune soils share many key characteristics (Bar Kutiel et al., Reference Bar Kutiel, Katz, Ziso-Cohen, Divinsky and Katra2016). In other words, sand in a desert environment responds in a similar fashion to water as does coastal dune sand along Lake Michigan's eastern shoreline, which is a Udic soil moisture regime where precipitation is greater than potential evapotranspiration (PET) and dry conditions are rare (Schaetzl and Anderson, Reference Schaetzl and Anderson2005).
Yet, if the amount of water supplied to a sand medium increases, pore spaces will become filled and moisture can be held, suggesting that each sandy soil may possess a threshold in the vadose zone by which water can be made available to plants (Sala et al., Reference Sala, Parton, Joyce and Lauenroth1988; Gardner and McLaren, Reference Gardner and McLaren1999). A relatively large increase in precipitation over time can have an accompanying, rapid response in vegetative growth in sandy soils (Sala et al., Reference Sala, Parton, Joyce and Lauenroth1988; Ashkenazy et al., Reference Ashkenazy, Yizhaq and Tsoar2012). This process potentially sets in motion a series of ecogeomorphic feedback mechanisms. For example, dune sand soils holding more soil moisture due to an increase in annual precipitation and expansion of vegetation may demonstrate “temporal persistence” in soil moisture storage, according to the theory of the temporal stability of soil moisture (TS SM) (Vachaud et al., Reference Vachaud, Passerat De Silans, Balabanis and Vauclin1985; Wang et al., Reference Wang, Zlotnik, Wedin and Wally2008). Persistently moist dune blowout soil may thus stay so, changing only in response to the needs of vegetation (Bar Kutiel et al., Reference Bar Kutiel, Katz, Ziso-Cohen, Divinsky and Katra2016). Further perpetuating these feedback mechanisms, organic matter and finer-grained particles are added to the soil as a consequence of vegetation growth, increasing water retention and supplying additional nutrients (Baldwin and Maun, Reference Baldwin and Maun1983; Shay et al., Reference Shay, Herring and Dyck2000).
Importantly, vegetation is a notable control of blowout behavior. Upwind of the blowout and within the blowout itself, vegetation can constrain sand supply to the blowout, essentially denying it nourishment. In a study of two dissimilar blowouts along New Jersey's coastline, Gares (Reference Gares1992) observed that vegetation had established itself in the throat of a blowout and had become the focal point for sand deposition, possibly growing into a foredune structure. This resulted in a “positive feedback that exists between vegetation growth and newly deposited sediment” (Gares, Reference Gares1992, p. 602). A similar observation was made at a blowout in our study area near Petosky, Michigan, where a vegetated foredune starved a downwind blowout (Lepczyk and Arbogast, Reference Lepczyk and Arbogast2005).
Two recent studies have implied that vegetation growth in Lake Michigan's coastal dunes possibly may be ascribed to an increase in annual precipitation, among other possibilities (White et al., Reference White, Piraino, Shortridge and Arbogast2019; McKeehan and Arbogast, Reference McKeehan and Arbogast2021). Annual precipitation increased ~180 mm since 1940 at two regional weather stations—South Bend, Indiana, and Muskegon, Michigan—along the southern and central portions of the lakeshore since 1940, but only modestly in the north at Traverse City (McKeehan and Arbogast, Reference McKeehan and Arbogast2021). PET also has increased since 1940, but was still less than precipitation (McKeehan and Arbogast, Reference McKeehan and Arbogast2021). Yet, a statistical analysis found these precipitation trends to be only moderately positive with respect to the southern and central coast. Thus, while an increase in annual precipitation is a possible driver of blowout contraction and fragmentation, especially given the rapid response of sandy soils to a sustained increase in water, we cannot be certain it is the primary process causing stabilization in the dune system. Instead, it is probable that multiple factors are at work, likely enmeshed in complex process-response relationships and ecogeomorphic feedback mechanisms (Schwarz et al., Reference Schwarz, Brinkkemper and Ruessink2018; Delgado-Fernandez et al., Reference Delgado-Fernandez, O'Keeffe and Davidson-Arnott2019).
As we have mentioned, nearshore, beach, dune, and blowout processes in coastal systems are coupled through several interrelated variables that produce different outcomes in response to process stimuli, the results of which cycle feedback recursively throughout the system, changing the process-response relationships across spatiotemporal scales (Sherman and Bauer, Reference Sherman and Bauer1993; Walker et al., Reference Walker, Davidson-Arnott, Bauer, Hesp, Delgado-Fernandez, Ollerhead and Smyth2017; Schwarz et al., Reference Schwarz, Brinkkemper and Ruessink2018; Castelle et al., Reference Castelle, Marieu and Bujan2019; Delgado-Fernandez et al., Reference Delgado-Fernandez, O'Keeffe and Davidson-Arnott2019). A process-response framework of dune systems has been detailed in different ways in recent years (e.g., Ashkenazy et al., Reference Ashkenazy, Yizhaq and Tsoar2012; Delgado-Fernandez et al., Reference Delgado-Fernandez, O'Keeffe and Davidson-Arnott2019). Any understanding of the stabilization response by Lake Michigan coastal dunes would need to acknowledge a complex process-response framework, especially in the absence of a singular strong process driver trending toward obvious stabilization responses. After all, there are other potential drivers at work in the region, including increased atmospheric concentration of CO2 through anthropogenic means, anthropogenically driven atmospheric nitrogen deposition, land use changes, fire suppression, the cessation of logging, and the growth of invasive species, all of which are discussed in McKeehan and Arbogast (Reference McKeehan and Arbogast2021) and Yurk and Hansen (Reference Yurk and Hansen2021).
One potential driver that likely has influenced blowout fragmentation, albeit at a localized scale, is the planting of grasses to stabilize active dunes. Beginning in the nineteenth century, some communities along Lake Michigan's eastern shoreline sought to minimize dust emissions and prevent the damage caused by drifting sand by planting grasses and trees atop bare sand dunes (Cowles, Reference Cowles1899; Sanford, Reference Sanford1916; Kroodsma, Reference Kroodsma1937; Lehotsky, Reference Lehotsky1972; Leege and Murphy, Reference Leege and Murphy2000, Reference Leege and Murphy2001; McKeehan and Arbogast, Reference McKeehan and Arbogast2021). Planting campaigns occurred at multiple locations, including Saugatuck, Ottawa Beach near Holland, Grand Haven, Muskegon, Pentwater, and Manistee, where two dunes known as “Maggie Thorpe” and “Creeping Joe” often caused problems for the community.
Importantly, however, the results of these efforts were mixed. For example, efforts to stabilize the dunes at Manistee and Saugatuck in 1902 by planting non-native black locust (Robinia pseudoacacia) and various spruces apparently succeeded upon inspection 12 years later in 1914 (Sanford, Reference Sanford1916). Yet, nearby efforts involving poplar trees and grasses failed, leaving stands of poplars half-buried in sand and no evidence that grasses had ever been present at the sites (Sanford, Reference Sanford1916). Other attempts, some led by then-Michigan Agricultural College (now Michigan State University), also failed to stabilize local dunes (Kroodsma, Reference Kroodsma1937). Yet, at Saugatuck in the 1930s, black locust and other tree species were used to stabilize dunes there successfully (Kroodsma, Reference Kroodsma1937). Consequently, similar tactics were employed using various pines to stabilize active dunes, which were a “menace” to nearby neighborhoods, at Grand Haven (Lehotsky, Reference Lehotsky1972). Later, 25,000 non-native Austrian pines (Pinus nigra) were planted in and around Saugatuck Dunes State Park from the 1950s to the 1970s in a mostly successfully attempt to stabilize dunes (Leege and Murphy, Reference Leege and Murphy2000, Reference Leege and Murphy2001). In the late 1980s, grasses were used to stabilize a foredune fronting a housing development at Ottawa Beach (McKeehan and Arbogast, Reference McKeehan and Arbogast2021).
From these examples, planting programs apparently have had a mixed record of success. They also have affected dune conditions at some, but certainly not all or even most, blowouts sites along Lake Michigan. Further, a thread of misconception that runs through some of these early planting studies is that the natural condition of Lake Michigan dunes is one in which the dunes are vegetated (e.g., Sanford, Reference Sanford1916; Kroodsma, Reference Kroodsma1937; Lehotsky, Reference Lehotsky1972), a theory made without the knowledge of regional dunefield geochronologies or features such as the Holland Paleosol. Sanford (Reference Sanford1916) stated that logging and slash-and-burn clearing for agriculture were the culprits in reactivating stable dunes, while Lehotsky repeated the claim in 1972. However, McKeehan and Arbogast (Reference McKeehan and Arbogast2021) found this assumption to be untrue. Setting aside the regional aeolian geochronologies, an extensive examination by McKeehan and Arbogast (Reference McKeehan and Arbogast2021) of the U.S. General Office Public Lands Survey (PLS) notebooks in the state of Michigan's archives showed that bare sand dunes were common in the study area. These observations were made mostly prior to 1850 before widespread European settlement. Logging certainly occurred in some forested back dune areas, which were active thousands of years ago. Yet, the notebook evidence indicates the presence of progradational dune processes and long-term plant community succession, rather than logging and plantings being primary drivers of change on Lake Michigan's shoreline. Contrary to the findings of several early scientists, plantings were not returning Lake Michigan's coastal dunes to their natural tendencies; rather, the conditions of these dunefields are determined by multiple, multiscale process-response mechanisms. Planting success still likely hinged on favorable macroscale, mesoscale, and microscale climate and ecogeomorphic variables. Absent these favorable drivers, planting programs still could fail. The trees and grasses planted were still somewhat at the mercy of the vagaries of many factors, the most important being regional in scale. Planting programs, logging, and fire suppression are all pieces of the puzzle, but do not represent all or most of the puzzle.
It is worth noting that the most successful planting programs appear to have occurred after the drought of the 1930s. Naturally, improved techniques, ample funding, and scientific advances could be responsible for the improved success of these programs. Yet, it is also possible that climatic or other factors drove these changes. Given the regional scale of blowout response, the most likely driver or combination of drivers of stabilization is uniform. Such drivers likely would be operating at meso- and macro-spatiotemporal scales, influencing local controls and feedbacks throughout the dune system, resulting in variability and heterogeneity of dune conditions at the scale of landforms and short temporal scales.
When answering questions of Lake Michigan coastal dune response, it may be helpful to think in terms of systems and states, despite some criticism of the ideas of landscape steady state or equilibrium (Thorn and Welford, Reference Thorn and Welford1994; Huggett, Reference Huggett2007, Reference Huggett2011). This theoretical approach has merit if the landscape system process-response scales and components are understood (Turner et al., Reference Turner, Romme, Gardner, O'Neill and Kratz1993). For example, Sherman and Bauer (Reference Sherman and Bauer1993) developed a scheme that sought to classify nine types of beach-dune coupling and their associated ecogeomorphic environments, a framework that has been examined in other studies (Walker et al., Reference Walker, Davidson-Arnott, Bauer, Hesp, Delgado-Fernandez, Ollerhead and Smyth2017; Davidson-Arnott et al., Reference Davidson-Arnott, Hesp, Ollerhead, Walker, Bauer, Delgado-Fernandez and Smyth2018). In 2022, much of our study area would have been classified as “beach negative; dune positive” under this classification scheme, where high lake levels have encroached upon the beaches and made them less dissipative (Sherman and Bauer, Reference Sherman and Bauer1993). At the same time, dune vegetation, which is expanding, is trapping sediment that ordinarily would be transported landward through the dune system, storing sediment, and creating a positive sediment budget.
Although compartmentalizing process-response environments might seem counterintuitive given the chaotic nature of outcomes in geomorphic systems (Phillips, Reference Phillips2006, Reference Phillips2007), these theoretic structures do provide the investigatory framework to begin detangling the complex ecogeomorphic feedbacks and mechanisms operating along Lake Michigan's eastern shoreline. As a start, we can state that Lake Michigan coastal dune systems might be (1) driven toward a steady, vegetated state since the mid-Holocene; (2) driven between alternative states based upon which processes are dominant at a given scale; (3) in nonequilibrium due to a new process paradigm; or (4) responding chaotically to the same process stimuli (Phillips, Reference Phillips2007; Huggett, Reference Huggett2011). Further research would benefit from being designed with these geomorphic possibilities in mind.
One possible conceptual blowout model advanced here that incorporates this approach acknowledges three primary phenomenon—increased precipitation, fluctuating lake levels, and a trend toward “stillness,” as Zeng et al. (Reference Zeng, Piao, Li, Ciais, Li, Cai, Yang, Liu and Wood2018) and Jackson et al. (Reference Jackson, Costas, González-Villanueva and Cooper2019a) termed decreasing winds over land. Briefly, this model postulates that the moderate rise in annual precipitation has increased soil moisture across the study area and provided the pretext for growth of pioneering plant species, specifically species that do not require dune sand burial but are adapted to aeolian landscapes, such as eastern cottonwood (Populus deltoides) (Sanford, Reference Sanford1916). Increased moisture also dampens aeolian transport of sediment and fosters vegetation on foredunes, which is a critical ecogeomorphic marker for this model. Concurrently, during high lake level periods, transgressive lake action erodes some foredunes and bluffs, making sand available to the coastal dune system upon its eventual deposition onto the foreshore, if it is not lost offshore. During lower lake levels, the beach becomes dissipative, according to Short and Hesp's (Reference Short and Hesp1982) model.
Conversely, the long fetch across the lake and higher energy allow for more efficient transport of sand from the foreshore into the backshore areas, stimulating foredune growth through the ecogeomorphic capture of sediment, which creates a topographic barrier and blocks sand supply to downwind blowouts. This ecogeomorphic mechanism is key, especially in an environment of diminished wind power. Vegetation, which has pioneered inside the blowout deflation basin, thrives in the relatively high-precipitation, low-sand supply environment, enriching the soil through mutual feedback mechanisms and promoting additional vegetation growth. When transgressive lake behaviors return, the resultant high-stand foredune is somewhat eroded, partially removing the topographic barrier to the blowout and allowing for more sand to be supplied from the foreshore into the backdune areas. Any bare or patchy sand areas receive additional sand supply; species adapted to sand burial, such as marram grass (Ammophila breviligulata) withstand this period and even bank seeds in the sand (Maun, Reference Maun1998), especially if buried in <10 cm of sand (Zhan and Maun, Reference Zhan and Maun1994). With diminished wind power regionally, it's possible that seeds are being buried by less sand than in years past, fostering higher rates of germination. Other fast-growing species, such as cottonwood trees, grow fast enough to outpace the rate of sand burial and survive. As lake levels fluctuate, the cycle begins again. A myriad of variables at the landform-scale, such as topographic position, local dune geomorphology, and human disturbance, among other factors, control some interactions and affect the overall state of blowouts in the dunefield.
If this represents a possible model to explain blowout contraction in the modern period, then under what conditions were blowouts along the eastern shore of Lake Michigan initiated and maintained, if current conditions largely are unfavorable for blowouts? Some evidence indicates that blowouts at the southern end of Lake Michigan at Indiana Dunes National Lakeshore originated during humid and cool periods (Kilibarda, Reference Kilibarda2018), although these observations were from foredune blowouts initiated by transgressive lake actions and storms. These blowouts then healed during subsequent low lake levels due to foredune growth, a similar mechanism observed by van Dijk (Reference van Dijk2004), suggesting an ephemeral temporal aspect to the observed blowouts in that study (Kilibarda, Reference Kilibarda2018). Our study did not detect these transitory blowouts, likely due to the relatively longer temporal design of our study. Yet, it is worth noting that blowouts were observed forming at the southern end of the lake during a time of high water levels, relatively higher humidity, and cool temperatures (Kilibarda, Reference Kilibarda2018). The most recent global cooling event was the Little Ice Age (LIA), a period roughly dated from ca. 0.7 ka to ca. 0.1 ka (Nordstrom, Reference Nordstrom, Masselink and Gehrels2015) or ca. 1300–1900 AD. The LIA was a period of episodic dune activity in Europe (Provoost et al., Reference Provoost, Jones and Edmondson2011; Jackson et al., Reference Jackson, Costas and Guisado-Pintado2019b) and a period of cool, dry, and possibly erosive conditions around the Great Lakes (Colman et al., Reference Colman, King, Jones, Reynolds and Bothner2000; Hupy and Yansa, Reference Hupy and Yansa2009; Warner et al., Reference Warner, Jeffries, Lovis, Arbogast and Telewski2021), although lake levels appear to have been at or slightly above modern levels (Baedke and Thompson, Reference Baedke and Thompson2000).
Could large, transgressive blowouts seen across the eastern shore of Lake Michigan be artifacts from the LIA period, which ended just as European settlement accelerated in the nineteenth century? It is possible, although it can be difficult to ascribe geomorphic events to specific climatic periods, especially since aeolian systems in general (Wright and Thom, Reference Wright and Thom1977; Werner et al., Reference Werner, Mason and Hanson2011), and Lake Michigan's coastal systems in particular (Lovis et al., Reference Lovis, Arbogast and Monaghan2012; McKeehan and Arbogast, Reference McKeehan and Arbogast2021), can exhibit lagged responses to forcing. Still, optically stimulated luminescence (OSL) dates calculated from parabolic dune and blowout sand samples along the eastern shore of Lake Michigan show some possible activity from the LIA. Fulop et al. (Reference Fulop, Johnson and Keen-Zebert2019) reported one OSL date of 0.43 ± 0.05 ka from a parabolic dune at Green Point Dunes near Frankfort, while Lovis et al. (Reference Lovis, Arbogast and Monaghan2012) reported a date of 0.62–0.76 ka at a blowout known as Mt. McSauba near Charlevoix. There is a smattering of other similar OSL dates associated with the LIA (Blumer et al., Reference Blumer, Arbogast and Forman2012; Lovis et al., Reference Lovis, Arbogast and Monaghan2012), but their association with parabolic dunes or blowouts is unclear. More dates exist linking dune and possible blowout activity to the Medieval Climate Optimum (MCO) (1.2–0.7 ka), the Roman Climate Optimum (RCO) (ca. 2.3–1.6 ka), and the Holocene Climate Optimum (HCO) (MIS 1). The oldest of these climatic intervals is the HCO, which in North America was the apogee of the mid-Holocene Northgrippian Age, a warm and dry period defined as ca. 8.2 ka to ca. 4.2 ka (Schaney et al., Reference Schaney, Kite, Schaney and Thompson2021) and sometimes referred to as the Hypsithermal (Warner et al., Reference Warner, Jeffries, Lovis, Arbogast and Telewski2021). The HCO, which coincided with the Nipissing transgressions, was the period of origin for Lake Michigan's coastal dunes (Hansen et al., Reference Hansen, Fisher, Arbogast and Bateman2010), although it is unlikely that most blowouts would date to the HCO. As previously mentioned, periods of aeolian activity on the eastern lakeshore continued thereafter.
Interpreting OSL dates from other studies and applying them to speculatory models of blowout behavior is difficult. Those studies were not designed with the goals of specifically establishing a theory of blowout development, nor do they provide a comprehensive picture of dunefield mode for the given time of activity or stability, considering Carter's (Reference Carter and Carter1991) “natural heterogeneity” and Yizhaq et al.'s (2007) “bistability.” Yet, these studies do provide a baseline for our knowledge. According to these OSL dates, dune activity occurred at parabolic dune and blowout sites beginning at the HCO and in every other global warm period since then, with the exception of the current, anthropogenically driven warming period, which began in the late 1800s (Ruddiman, Reference Ruddiman2014, p. 391). Regardless, it is clear that many blowouts mapped in our study are relicts of the premodern environment, and that possibly some type of ecogeomorphic lag is underway in blowout response to Late Holocene conditions.
To resolve these questions, new research along the following two tracks would be helpful. First, to better understand why blowouts are healing, research should focus on determining which components of the process-response mechanisms are driving stabilization. New research could involve longitudinal studies in the field of key indicator blowouts to better understand geomorphic changes and drivers. Such research could attempt to determine regional blowout soil moisture thresholds, the process by which blowouts are vegetated, the effect of CO2 and N on dune plants, how foredune growth affects blowout sand supply and fragmentation, how blowouts respond to human activity, especially in their deflation basins, and other component processes in the Lake Michigan dunes. The second important research track involves blowout geneses and the ecogeomorphic lag between initiation and fragmentation. For this research, it would be incumbent to date blowout inception, perhaps by concentrating on the depositional lobes of large trough blowouts. The designed research could incorporate spatial variability along the length of the lakeshore above and below the hinge line. Both research tracks are pertinent given the growing population of the region, economic value of the area, and the important dune ecosystems present (Harman and Arbogast, Reference Harman and Arbogast2004; Schrotenboer and Arbogast, Reference Schrotenboer and Arbogast2010; Arbogast et al., Reference Arbogast, Garmon, Sterrett Isely, Jarosz, Kreiger, Nicholls, Queen and Richardson2018, Reference Arbogast, McKeehan, Richardson and Zimnicki2020). After all, although blowouts are currently stabilizing under vegetation, aeolian environments can experience rapid changes in short periods of time and are rarely stable for long (Smith et al., Reference Smith, Jackson, Cooper and Hernández-Calvento2017; Delgado-Fernandez et al., Reference Delgado-Fernandez, Smyth, Jackson, Smith and Davidson-Arnott2018; Miyanishi and Johnson, Reference Miyanishi, Johnson, Johnson and Miyanishi2021).
CONCLUSIONS
In this time-series study, we mapped 435 dune blowouts along the eastern shore of Lake Michigan using repeat aerial photography, machine learning tools, and a STAMP model to quantify blowout behavior at three temporal periods. From 1938 to 2018, no new blowouts formed along the entire lakeshore. In addition, blowout extent decreased ~37%, primarily due to an expansion of vegetation, although human development played a significant role. Further, the STAMP model suggested that blowouts were not merely shrinking, but also fragmenting. This study confirmed the findings of White et al. (Reference White, Piraino, Shortridge and Arbogast2019) and McKeehan and Arbogast (Reference McKeehan and Arbogast2021), who found that coastal dunes in the study area were stabilizing while vegetation was expanding over previously bare sand. The processes driving this response by blowouts are unclear but could be a series of interrelated factors that stimulate ecogeomorphic feedbacks. An increase in annual precipitation, lake level fluctuations, and a decrease in wind power may be affecting dune blowouts in complex ways at different spatiotemporal scales to drive stabilization. Further, because no new blowouts were detected in our study, we speculated that the conditions that initiated blowout formation have not occurred in the modern period and that blowouts in the study area may be geomorphic artifacts from climatic eras that were different than now, such as the Little Ice Age, Medieval Warm Period, and Roman Climatic Optimum. We also identified further research along two tracks that could resolve these questions. One track would investigate the process-response mechanisms that are driving blowout stabilization, while the other would explore blowout origins.
Acknowledgments
We gratefully acknowledge the Michigan State University (MSU) Department of Geography, Environment, and Spatial Sciences for their facilities and financial support. Additionally, we appreciate the staff of the MSU Remote Sensing and GIS (RS&GIS) group for their assistance navigating the university's Aerial Imagery Archive. We would also like to convey special thanks to Drs. Kyla Dahlin and Ethan Theuerkauf of MSU's Department of Geography, Environment, and Spatial Sciences, and Dr. Robert Richardson of the Department of Community Sustainability who reviewed early versions of this manuscript.
Disclaimer
Any use of trade, firm, or product names is for descriptive purposes only and does not imply endorsement by the U.S. Government.


 Open access