


After reading Mr. G. Seligman’s preliminary report on this subjectFootnote * we initiated a programme for recording and measuring the ice crystals on some of the small valley glaciers in the Kebnekajse massif in Swedish Lapland from 18 July to 12 August 1948. This is the region in which Geografiska Institutet, Stockholm, has been carrying out systematic glaciological studies since 1946.
It was very difficult or impossible to use Seligman’s method, chiefly because of the humid weather. The ice surfaces were so wet that the paper became soaked and would not take the pencil marks. Using the limited facilities available at the camp, we experimented with another method. We used a roll of ordinary absorbent kitchen paper towelling and a mixture consisting of clay and a brown powder stain insoluble in water. After this mixture has been rubbed over the selected ice surface a length of the paper is carefully placed over the treated area and gently pressed with the finger tips into close contact with it. When the outlines of the crystals can be seen through the paper, usually after the lapse of two or three minutes, the paper is gently removed from the ice, rolled up with another and carried back to the camp for drying and analysis.
Clear ice relatively free from air bubbles should be sought. Satisfactory records can be made on either vertical or horizontal surfaces, but the best results are obtained on horizontal surfaces where the melt water can drain down into the interstices between the crystals. Considerable difficulties were encountered in making a good impression of the lower part of vertical cross-sections because of the abundance of melt water on the crystals. In general it can be said that the drier the ice surface the better the result.
If the ice surface is suitably weathered the best results may be expected if the clay mixture is spread in a thin, even layer over the crystals. The crystal boundaries show up as clean white lines and the crystal surfaces as rich, evenly coloured areas (Fig. 6, p. 268). If the ice is only slightly weathered the clay mixture must be rubbed vigorously over the ice to force the stain into the boundary lines, the impression of which will then be shown as dark lines and the crystal surfaces as lightly coloured areas.
When a suitable ice surface is not available the ice has to be treated. To make the crystal boundaries distinct enough for an impression we used a small blow-lamp to heat the ice surface. Within a very short time the boundaries appeared and had sufficient depth to be satisfactorily recorded.
The form and size of the crystals can be obtained directly from the impressions with a rule. A better method is to make a master tracing of a single impression on transparent paper and to take the measurements from this, or else by comparing and checking two or more impressions of the same ice exposure.
An alternative to the clay and stain method which immediately suggests itself is to use photography instead of paper for recording and measuring the crystal sizes.
A continued series of experiments should be carried out with many different kinds of paper, stain and clay in order to arrive at the optimum combination of all three. Such investigations are planned for the glaciological research group at Kebnekajse.
Investigations were first made in a cave in the stagnant marginal part of Isfallsglaciären. Impressions were taken from 6 blocks (A–F, Table I) which had fallen from the roof of the cave.

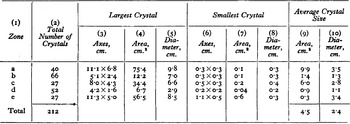
Table I gives a summary of the crystal-size values. On the impressions we measured the largest and smallest axes of all the crystals and computed their areas. The total number of crystals is shown in Col. 2. The axes and areas of the largest and the smallest crystal in each sample are shown in Cols. 3, 4, 6 and 7. The average area of the crystals is given in Col. 9. Because of Selig-man’s use of diameters as measures of the crystal size we have also calculated these, corresponding to their respective areas considered as circles (Cols. 5, 8 and 10).
In order to give a more detailed description of the crystallographic structure of the ice examined, frequency diagrams of crystal sizes have been calculated, using the interval:0.1–0.2,0.3–0.7,0.8–1.2 cm.2 etc. We have also shown as abscissae the diameters selected by Seligman, namely 0.25,0.4,0.6,1.0,1.6,2.5,4.0,6.3 and 10 cm. Fig. 1 (p 271) summarizes all crystals measured on the six blocks.

Fig. 1 Frequency diagram of crystal sizes in Table I
A vertical cross-section was made through the second layer of ice from the floor the cave. Six impressions of the cross-section were made and used in arriving at the crystal pattern shown in Fig. 2 (p. 270). It can be divided into five zones. Table II summarizes the values found and Fig. 3 (p. 271) shows the frequency diagram.

Fig. 2 Crystal pattern of section of ice in the floor of a cave in the margin of Isfallsglaciären

Fig. 3 Frequency diagram of crystal sizes in Table II
In Figs. 1, 3 and 5 the upper rows of figures of the abscissae denote the crystal areas in cm.2 the lower rows the crystal diameters in cm.
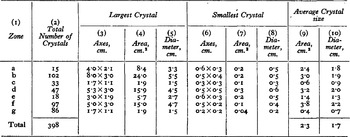
A cross-section through an ice layer in a transverse crevasse in the margin of the tongue of Storglaciären is shown in Fig. 4 (p. 270). The glacier is 3 km. long and the ice was nearly stagnant at the location investigated. Table III summarizes the crystal size values and Fig. 5 (p. 270) shows the frequency diagram.

Fig. 4 Crystal pattern in the margin of the tunnel of Storglaciaren (Table III)

Fig. 5 Frequency diagram of crystal sizes in Storglaciären
A superficial measurement of a sample of clear ice from the central part of the tongue of Storglaciären (2.5 km. from its source, and in close proximity to Stake No. 24) showed the crystal size to be approximately 3–3.5 cm.2. The movement of the glacier at the point is about 1.5 cm. a day.
A similar superficial measurement of three samples at the base of an ice-fall on the uppermost part of Storglaciären showed the crystal size to be approximately 1.8–23 cm.2.
A sample was taken of the layer covering the glacier and formed by refreezing melt water which had percolated through the last winter snow cover. The point was situated 600 m. from the glacier margin, 2.5 km. from its source and 200 m. from Stake No. 28. In the first 5 cm. of the layer the crystal size was less than 1 mm.2 and had more the character of frozen firn than real ice. The next 5 cm. down contained a mixture of crystals, some of whose areas were less than 1 mm.2, the larger ones ranging up to 4 mm.2. This section also had the appearance of frozen firn rather than real ice. From 10 to 20 cm. depth the mean size of the crystals was from 4 to 24 mm.2. In this zone the frozen mass began to take on the characteristics of real ice. The next 10 cm. of the new ice contained a mixture of crystals varying from very small sizes up to areas of 50 to 100 mm.2. This zone must be characterized as real ice. Below the dividing line the old glacier ice from 29 cm. down to 32 cm. had a mixture of crystals of about 25 mm.2 to 200 mm.2 in area. Then followed a band 10 min. thick made up of very small crystals. From this band down to the bottom of the profile, a distance of about 37 cm., three samples of ice were stained and 63 crystal measurements were made from the recorded impression. The average size was 1.8 cm.2 and the largest crystal measured 14.0 cm.2.
An excellent impression was obtained from the cliff on the south side of Kebnepakteglaciären (1.75 km. long) in Tarfalasjön (Tarfala Lake) (Fig. 6, p. 268). Above the cliff the glacier is very steep and nearly forms an ice fall. The regular hexagonal crystals were found to be long and thin, about 4 × 1 × 1 cm., most of them with the longest axis perpendicular to the cliff wall. In a long vertical band they were parallel to the wall and in continuation of this band there were three large crystals probably forming the filling to a fissure. The total impression measured was 450 cm.2 and contained about 2050 crystals; Fig. 6 reproduces about 1450; their average size varied between 0.2 and 0.9 cm.2 the three largest having an average size of 11.0 cm.2. This unique crystal pattern and structure represent a radical departure from the other type. It is not certain, however, whether it is the real structure of the glacier ice in the cliff or a relatively young superficial layer formed by recrystallization of snow, accumulated on the lake ice and covering the cliff during most of the year.

Fig. 6 Impression of crystals on Kebnepakteglacüiren. A 5 cm. long line in the bottom left corner shows the scale. (See pp. 269 and 273)
The latter supposition is strengthened by the fact that the walls of a crevasse in the ice-fall of Isfallsglaciären were covered by a thin layer of regular small crystals measuring about 1–4 mm.2. Inside it the proper glacier ice consisted of a mixture of crystals, the average size of which was 1.8 cm.2.
A superficial measurement was made on the dead ice in the lateral moraine on the southern side of Storglaciären where the ice is covered by about 1 m: of thick till. The average crystal area was found to be about 11 cm.2.
Another specimen of dead ice was taken from the northern lateral moraine of Kebnepakteglaciären. The moraine ridge rises up to as much as 30 m. in height but the moraine mantle is only a few metres thick. The dead ice must be at least fifteen years old. The sample (Fig. 7, p. 273) had a very irregular structure. Zone (a) contains only 5 crystals, none of which has a complete boundary intact. One crystal surface is the largest yet measured at Kebiiekajse, being 91 cm.2 in area. Three of the crystals are striated with thin, regular air bubble bands, parallel in the same crystal but orientated differently in the various crystals. This striation may indicate individual crystallographic orientation. It is believed that zone (b) with its mixture of long crystals and many small ones is a transition area between zones (a) and (c). In this zone (c) the entire assemblage of crystals is very small and averages in area about 1 mm.2 or less. It may contain about 2500 of these small crystals. Zone (d) is also quite different from all the others and is made up of more normal crystals of various sizes.

Fig. 7 Crystal pattern of dead ice in Kebnepakteglaciären
It is not possible to arrive at a mean value for the crystal size in the dead ice because of the few measurements made and the wide distribution of sizes observed. It can be noted, however, that the largest ice crystals recorded in Kebnekajse were found in dead glacial ice.
General Results
-
All investigations show that a great variation of crystal size and distribution exists in all parts of the glacier ice; therefore an average value of the crystal size in any measured area is not representative. Crystal size frequency analysis must be made.
-
The nearer the glacial margin, the larger the crystal size; this is particularly striking at the stagnant margin of the glacier.
-
The largest individual crystals are found in dead ice.
-
These two last paragraphs confirm Seligman’s statement that the higher the rate of movement of the glacier ice the smaller is the crystal size.
-
Cross-section impressions of glacier ice layers are arranged in parallel zones in which the crystals are of large or small mean size.
-
In dead ice bands of very small crystals (<1 mm.2) sharply bounded by crystals of larger size are found.
-
In the upper part of the top layer of the glacier small crystals, formed by refreezing melt water which has percolated through the snow cover of the preceding winter, increase rapidly in size downward to the old glacier surface. In 1948 the contact between this new layer and the old ice was sharp and clearly defined in the ablation area, even in the latter part of the summer.


