


Introduction
In recent years, several studies have emphasized the important role that smallholder agriculture can play in reducing poverty in developing countries (e.g., The World Bank 2008; Hazell et al. Reference Hazell, Poulton, Wiggins and Dorward2010). However, although often more efficient in production, smallholder agriculture, particularly in Sub-Saharan Africa, is largely exposed to pervasive market failures, translating into missed opportunities and sub-optimal economic behavior. These failures can, in part, be traced to the importance of economies of scale in procuring inputs and marketing produce (Poulton, Dorward, and Kydd Reference Poulton, Dorward and Kydd2010). Smallholders face disproportionately high transaction costs, in particular, when these costs are invariant with the quantities commercialized (Goetz Reference Goetz1992; Key, Sadoulet, and de Janvry Reference Key, Sadoulet and de Janvry2000; Fafchamps and Hill Reference Fafchamps and Hill2005; Pender and Alemu Reference Pender and Alemu2007). In return, lack of commercialization typically leads to low specialization, low productivity, and hence lower income (von Braun and Kennedy Reference von Braun and Kennedy1994; Timmer Reference Timmer1997).
In Uganda, the majority of farmers sell their produce at harvest time on the spot market. By selling their unprocessed products to itinerant traders at the farm-gate, this choice of sale outlet represents the highest net price for a farmer, given the small amounts he sells and the fixed costs that are inherent to transporting and processing his output. Despite considerable competition in the spot market, it is generally perceived that farmers have little bargaining power over the price when they make their sale.
Developing an institutional infrastructure that facilitates market exchange for smallholder farmers in such a context is critically important. Producer organizations (POs) are one possible institutional solution: by engaging in markets collectively, smallholders both (i) sell enough to make farmer-organized transport and processing efficient and (ii) increase their bargaining power in making sales (Heyer, Thorp, and Stewart Reference Heyer, Thorp and Stewart1999; Hill, Bernard, and Dewina Reference Hill, Bernard and Dewina2008; The World Bank 2008). However, even though a proportion of Uganda's farmers are members of POs, few farmers sell through them. Farmers face additional costs in making collective sales. There is the cost of organizing, the cost of waiting involved in coordinated bulking, and the risk of default that is present when the harvest is delivered with no or partial payment. In addition, selling through the group reveals information about the size of income in a given year, with potential consequences for informal taxation from others in the community.
Evidence shows that POs have so far had limited success, thus bringing into question whether they are, in fact, a good mechanism for solving market failures and to what degree they can actually improve farmers’ access to markets. Fafchamps and Hill (Reference Fafchamps and Hill2005) show that although there are often large potential reductions in transaction costs via collective selling, such mechanisms are seldom observed, possibly due to lack of trust between farmers. Evidence from Senegal, Burkina Faso (Bernard, de Janvry, and Sadoulet Reference Bernard, de Janvry and Sadoulet2008), and Ethiopia (Bernard and Seyoum-Taffesse Reference Bernard and Seyoum-Taffesse2012) suggests that benefits derived from membership in a PO remain low for a large proportion of groups. Coulter (Reference Coulter2007) and Hellin, Lundy, and Meijer (Reference Hellin, Lundy and Meijer2009) show that collective action can be effective in lowering entry barriers for smallholders in high-value markets, although with significant costs to mobilizing such action. Also, benefits often vary with the capacity to mobilize labor. More rigorous and consistent empirical analyses of the functioning of POs and their effects on economic performance are thus clearly required in order to determine their potential for correcting market failures and to understand how to better support them in servicing their members.
In this article, we assess the importance of two institutional weaknesses of POs that may underlie members’ reluctance to engage in output marketing activities collectively. Firstly, the POs’ lack of working capital results in payment delays and, secondly, PO members’ lack access to reliable information about final prices, costs, and fees involved in transactions conducted by the PO leaders.Footnote 1 We designed a randomized evaluation to rigorously assess the impact of (i) a working capital loan that enables POs to pay cash on delivery (CoD) to its members, and (ii) a text messaging system that improves the flow of Information-on-Sales (IoS) to all PO members. The CoD intervention was designed to improve the ability of the PO to market collectively by relieving individual members’ liquidity constraints, while the IoS intervention was designed to increase participation in group activities by improving the information on sales. Since the degree of trust and transparency within the group can have an effect on the farmers’ ability to take advantage of the CoD intervention, we also evaluate the impact of implementing both interventions together.
We find that providing cash on delivery increases the probability that a member chooses to sell through the group, and hence the volumes bulked by each group. This increase in volumes appears to have enabled groups to secure higher prices for their farmers as prices were significantly higher for farmers in groups in which cash on delivery was offered. Increasing information on sales to members did not have an impact on marketing outcomes. It is not clear whether this is because it was not well implemented, or whether lack of information was not the binding constraint limiting sales through the group.
We further explore whether the improved market conditions induced by the interventions have an effect on agricultural production, labor utilization, and other input-use decisions by PO members (Key, Sadoulet, and de Janvry Reference Key, Sadoulet and de Janvry2000). In particular, we explore if the improvement in market access for smallholders leads to (i) mobilization of underutilized household labor, (ii) increased demand for hired labor, and (iii) increased demand for other agricultural inputs. Understanding whether or not this is the case has important policy implications for Uganda, shedding light on whether interventions to stimulate agricultural production should focus on increasing (and subsidizing) the supply of inputs, or whether productivity gains are possible through support to marketing and the increased price incentives that result.
The rest of the article is organized as follows. Section “Context and the interventions” provides more detail on agricultural production and marketing in Uganda and describes the interventions that were implemented. Section “Experimental design and sample characteristics” sets out the experimental design and sample characteristics. The results of the experiment are presented in Section “Results”. Section “Discussion and conclusion” concludes.
Context and the interventions
Context
Close to 90 percent of Uganda's population resides in rural areas. According to official estimates, 66 percent of the labor force makes a living in agriculture (Uganda Bureau of Statistics 2010).Footnote 2 Uganda's agriculture predominantly features smallholder farming. A variety of crops are grown throughout the country. Matoke (a banana staple crop), maize, beans, and coffee are important food and cash crops for many farmers.
Mrema (Reference Mrema2008) provides a history of the cooperative movement in Uganda. He relates how the strength of cooperatives has waxed and waned since independence, affected by the strength of leadership, government and donor support, and civil conflict. By the beginning of the 1990s, prior to liberalization, cooperatives monopolized agricultural marketing activities. After liberalization farmers were able to sell through traders, and cooperatives found that their high overhead costs prevented them from being competitive. In the 2000s, the decade prior to the intervention analyzed in this article, the National Agricultural Advisory Services (NAADS) program formed many farmer groups throughout Uganda to be conduits for training and extension services, some of which include assistance in accessing inputs and marketing. A comprehensive review of NAADS activities is provided in Benin et al. (Reference Benin, Nkonya, Okecho, Pender, Nahdy, Mugarura, Kato and Kayobyo2007). Analysis of household surveys and census data in Hill, Bernard, and Dewina (Reference Hill, Bernard and Dewina2008) highlighted that about a quarter of rural communities in Uganda had NAADS farmers groups, about 28 percent of which provided marketing services, and 12 percent of rural communities reported marketing cooperatives. There is no national database of farmers’ groups to provide information on the nature of these groups, but some characteristics are presented later in the article using data collected for this analysis.
Over the past few years, governments, donor agencies, and NGOs have expressed a renewed interest in collective action mechanisms such as POs, as a means to help Ugandan smallholder farmers access markets. This has occurred despite the somewhat negative record of the government-controlled farmers’ cooperatives in place until the structural adjustment period of the 1990s. It is hoped that the new organizations will differ from their predecessors by being fully staffed and controlled by their members (Deininger Reference Deininger1995). Farmers engage in collective action as the group activity promises to improve their situation vis-a-vis adverse market conditions, e.g. high transaction costs and information asymmetries.
However, although membership of farmers’ groups is increasing, their engagement in marketing activities is limited. Baseline data collected for this study on 844 members of POs engaged in either coffee, maize, or matooke marketing indicated that despite the widespread presence of marketing activities, few members were active in selling through their group. Nearly, three-quarters of all households reported that their group was involved in bulking (74 percent), and most members of these groups reported having used this service in the past at least once (92 percent). However, data on the largest and most recent transactions undertaken by the members in the last 12 months does not feature the group as the main sales outlet, with only 38 percent of the reported transactions going through the group, with the majority of the rest going to traders. The majority of households (53 percent) reported that neither their largest or most recent sales were done through their group, selling to traders instead, and 15 percent reported making only some sales through the group. The average proportion of quantity sold through the group is 41 percent.
Table 1 provides summary statistics of the reasons reported by members for their choice of sale outlet at the baseline. The results suggest that sales are made through groups as a result of the higher prices they offer or the relationships they are built on. Sales to traders are much more likely to be rationalized by the need for quick liquidity. An initial exploration of correlates of outlet choice (through regression analysis—results not shown) confirm that farmers will sell through the group when the price premium is high enough. However, since the price premium a group can offer is highly determined by group quality and the quantities marketed through the group, we cannot treat these results as a causal finding.
Table 1. Reason for choice of sale outlet

According to the baseline data, on average, farmers were paid 3 days after delivery when selling through the group compared to immediate payment when making a sale to a trader (or sometimes with an advance). Although different, at first glance, it seems surprising that this difference would have an effect on whether or not a farmer chooses to sell through the group or to a trader. However, the effective waiting period can be longer. A farmer may have to wait some days after harvest for his or her group to start collecting for the next sale. When sales are made to traders they are more likely to be made with no prior arrangement (Table 2). As a result, the median number of days between completion of harvest and sale is 11 days for sales through the PO and 6 days for sales to traders.
Table 2. Arrangement of sale

Analysis of the baseline data showed that individuals in groups that offer cash on delivery are more likely to sell through the group. The types of individuals that sell through the group are also different. In groups that pay after sale, individuals that are more patient (measured through survey questions that elicited time preferences) and more likely to pay for a product in advance are more likely to sell through the group. This is not the case for individuals in groups that pay cash on delivery.
It is quite possible that it takes a “good” group to be able to offer cash on delivery, making it difficult to infer that other groups would increase their marketing ability were they to offer cash on delivery. Conducting and evaluating the CoD intervention using experimental methods allows an assessment of the true causal impact of these type of schemes.
There is also a strong positive correlation between general measures of trust and an individual's preference for selling through the group. This gives some evidence that increasing trust levels within the group could increase the degree to which farmers sell through the group. In other contexts, low levels of trust have been cited as a reason for low levels of group marketing. To the extent that increased transparency increases trust, the role of trust in limiting group marketing is something that is explored by examining the impact of providing additional information on sales to group members.
Interventions and timing
This study looks at two interventions designed to tackle barriers that keep PO members from participating in bulking and collective marketing activities: partial payment for harvest deliveries and increased transparency of the group sales process.
Cash on Delivery (CoD)
This intervention consists of randomizing the provision of working capital credit to POs that had already been engaged in output marketing. Associations are provided with some initial capital at the beginning of the buying season to pay cash on delivery to farmers for their output. As a result, all members of a selected PO were eligible through a system of vouchers to receive two payments: partial payment on delivery and payment of the balance (the final price less the advance) at the usual time.
The amount paid on delivery took into account current market conditions and was decided in agreement with the service organizations working with the associations and POs. It needed to be enough to provide meaningful payment, but not so much that the advance risked being greater than the final price (which is unknown at the time of bulking), and not so large that the amount of capital needed to sustain this system of payment in the future would be too high. On average, farmers that used the voucher for cash on delivery received 30 percent of the final price when delivering to the PO.
This intervention tackles the problem of delayed payments concurrent to bulking activities, and it effectively aims at reducing the period of time that PO members have to wait before receiving the revenue from their sales through the PO. By reducing the postponement in payment, inefficiencies for cash-constrained farmers are reduced. In terms of production decisions, this could affect the farmers’ demand for inputs such as hired labor as it increases their capacity to pay laborers immediately after harvesting.
Information-on-Sales (IoS)
In this treatment arm, POs set up a voucher system that documents the quantities a farmer delivered to the PO. At delivery, the farmer and the PO representative filled out a slip stating the quantity that the farmer delivered. The PO representatives were given financial incentives to distribute these vouchers. All PO members were informed about this documentation system and about the incentive system for the representatives.
In addition to installing and reinforcing the voucher system, an external consultant was hired that provided the ordinary members with information on the final sale of the output they delivered to the PO. Two PO members were elected by the rest to receive a text message from the consultant right after the final sale. The text message stated the final quantity and the price per kilogram. The two elected members received training on how to interpret and explain the text message. Regular members received training on how to interpret the information from that text message.
The aim of this intervention is to encourage trust among members in the marketing arrangements of the group by tackling the problem of opaque sales procedures. Ordinary PO members are not present at the time of the final sale of their bulked produce. Hence, their engagement in joint marketing requires trust in the PO in general and in its leaders more specifically. If trust is low, the inclination to participate is low, too. By providing information on the final sale, this intervention tries to offset the lack of trust.
Over time, improved information on sales may also provide households with the information that they need about sales to encourage them to change behavior. In the first instances, because the information is provided after the decision to sell through the group, it is likely that behavior changes as a result of the increased trust in the process the information allows.
Implementation timeline
Figure 1 visualizes how the project activities and research activities were timed against the agricultural cycle. In Uganda, farmers plant twice a year during a first and second rainy season, allowing for two distinct agricultural cycles in a calendar year. Each agricultural season is characterized by planting, weeding, and harvest periods.

Fig. 1. Timing of intervention and research activities.
In February of year 1, a period that sees little agricultural activity, the project started off with the baseline data collection on the PO and selected members of the PO. The CoD and IoS intervention activities started with the initial training and implementation visits to the groups taking place roughly around November of year 1 and January of year 2. Starting training and consecutively the intervention activities towards the end of year 1 guaranteed that POs benefitted from the marketing interventions during the harvest period in December. The first season during which the farmers were exposed to the interventions is thus the second agricultural season in year 1.
With the interventions being implemented between November of year 1 and September of year 2, the project's second season, which was the first agricultural season in year 2 (Mar–Jul), was fully covered. Ultimately, endline data were collected in September and October of year 2, when the year's second harvest period was accomplished and it could be expected that the major sales of maize and coffee for that year had come to an end.
Experimental design and sample characteristics
Experimental design
The organizational structure of these member-driven organizations is such that at the village level, farmers are grouped under the PO which handles bulking and coordination of transport. POs are typically grouped under associations or depot committees (DCs), which take care of the collection and in some cases value addition to the next stage of marketing. In most cases, a service organization offers support to DCs and POs through lobbying, access to extension, and additional marketing services. For the baseline survey, 5 such organizationsFootnote 3 agreed to facilitate access to farmer groups working with them, and in collaboration with them, we identified 21 DCs in different regions of UgandaFootnote 4 sharing similar challenges and opportunities and already involved—at a basic level—in bulk marketing in one of 4 different crops: Robusta coffee, Arabica coffee, maize or matooke.Footnote 5
At baseline, we surveyed all 375 POs grouped under those 21 associations, a full roster of member households for each PO,Footnote 6 and a complete household survey for 2–10 members of each group (depending on the group size, although nearly always 2) for a total of 844 farmers. With the baseline survey information already available, we identified 10 associations active in sales that could be selected for our study,Footnote 7 7 engaged in coffee marketing, and 3 engaged in maize marketing—with 167 POs and 328 farmers.Footnote 8
Taking the proportion of the crop production delivered through the PO (instead of through traders and other buyers) as the outcome of interest, we used its variance at baseline (0.2145) to obtain a minimum detectable effect of 9 percent (percentage points of PO sales) for assessing one intervention against its control in the household data, and of 12 percent in the PO data.Footnote 9 When assessing the impact of interactions between the two interventions, we obtain a minimum detectable effect of 13 percent in the household data, and 18 percent in the PO data.Footnote 10
The experiment thus concerned itself with the question of how to encourage non-performing POs to market. The unit of randomization in the experiment is the PO and the unit of analysis is alternately the PO and the individual PO members that were surveyed. From our sample of 167 POs, 42 were selected to receive the CoD intervention only, 42 were selected to receive the information-on-sales intervention only, 40 POs were allocated to receive both the CoD and the IoS interventions, and 43 were allocated to the control group.
Affiliation with a DC could potentially lead to imbalances in observable and unobservable characteristics or correlate with the effects of the intervention. To avoid such imbalances, we stratified our sample of POs by DC affiliation. Stratification on the basis of variables that are likely to influence main outcomes also increases the power of the statistical analyses (Bruhn and McKenzie Reference Bruhn and McKenzie2009). We stratified the POs into ten strata according to DC affiliation. The number of POs per DC per strata varies substantially, with the smallest DC contributing seven and the largest one 30 POs. Furthermore, the smallest DC is exceptional as it does not have a PO allocated to receive the CoD treatment only.Footnote 11
Sample characteristics by treatment status
Table 3 presents descriptive statistics on the PO level by treatment arm. The ultimate goal of the interventions under assessment was to increase the amount of harvest that the PO bulks and sells. No statistically significant differences were observed at baseline for the amount the PO sold to the DC. On average, the organizations in our experimental sample had 25 members at baseline and 27 at endline, with approximately 38 percent of them being female, and 89 percent of the PO leaders having at least completed primary school. Average landholdings were 6.9 acres, with 77 percent of the farmers engaged in coffee production having more than 100 trees. The average walking time to the bulking location was 25 min. There are no significant differences between the treatment arms and the control group at the 5 percent level, and only the average land size shows a significant difference at the 10 percent level for the group of POs that gets both treatments (5.3 acres versus 7.8 acres for the control group).
Table 3. PO level summary statistics at baseline

We interviewed at least two members of each PO, amounting to around 80 respondents per treatment arm. For the analysis, we dropped three households from this sample because they had extreme values on a few characteristics.Footnote 12 Table 4 presents summary statistics for a large number of characteristics at baseline for the household level sample by treatment status. From the 22 variables we report, only 2 show significant differences at the 5 percent level (age of the household head's spouse and number of parcels), and one at the 10 percent level (age of household head). In all three cases, the difference is found when comparing the group that received both treatments (CoD and IoS) against the control group, with the households in the group that received both treatments being slightly older and managing fewer parcels (2 versus 2.5).
Table 4. Summary statistics of household characteristics at baseline

Notes: Trust PO leaders (proxy) is a proxy variable created from a question that asked the respondents to rate the amount of time PO leaders would spend on a hypothetical community project. If the respondent esteemed that the PO leaders would spend more time on the project than ordinary PO members the proxy takes on value one. Age spouse and Yrs schooling spouse are missing-by-construction for single-headed households. Only two observations have missing value despite being married.
At baseline, we find that households in our sample have around seven members. The head is on average roughly 50 years old, the spouse is about 10 years younger, and in only 11 to 15 percent of the cases, depending on the group, is the head of the household a woman. The average schooling of the household head lies between six and seven years and is lowest in the control group. Roughly 50 percent of the treatment sample plants coffee, whereas only 43 percent of the control group does so, although this difference is not significant. Around 34 to 39 percent of the farmers have more than 500 coffee plants. Availability of electricity in the household is low, at 6 to 11 percent, compared to ownership of a mobile telephone, which is at roughly 60 percent. Ownership of savings accounts is at around 23 to 36 percent and about 33 to 41 percent of the respondents hold informal savings. Trust is relatively high given that 75 percent trust their neighbor and over 50 percent trust people in general. Our measure of trust in PO leaders also reveals quite high confidence in them as well.
Table 5 presents summary statistics for the four response variables that measure labor input: household member labor days in farming activities, household member labor days in crop production, hired labor days used on farm, and hired labor days for crop production. The first four columns present these variables for the first agricultural season and the second four for the second.
Table 5. Summary statistics of labor input at baseline

Note: Tables A5 and A6 in the Appendix provide additional information.
At baseline all outcomes are balanced, i.e. we do not find any significant difference either in the first or the second season between the means of the control group and the groups that received an intervention.
Results
We estimate the impact of the interventions on marketing and production outcomes at the PO and household level at endline by comparing the treatment groups to the control group in the following regression:

where Y i denotes the outcome for member i (could be written similarly for PO, j). CoD i is an indicator variable taking on value one if member i is from a PO that was assigned to distribute vouchers for cash on delivery, IoS i is an indicator variable taking on value one if member i is from a PO where information on sales were distributed, and Both i is an indicator variable that denotes affiliation of member i to a PO that received both interventions at the same time. The DC indicators on which we stratified the random allocation of the treatments enter our estimation via DC i,s , where s indicates the DC.
With coefficient β, we estimate the Intention to Treat (ITT) effect of the CoD treatment, with γ the ITT effect of the IoS treatment and with δ the ITT effect of implementing both interventions at the same time. We restrict our estimations to the ITT effect which gives us the average impact of offering the intervention on the PO level, regardless of whether the individual ultimately participates in joint marketing or not.
In addition, we estimate regressions where we control also for the initial value of the outcome variable. As proposed by McKenzie (Reference McKenzie2012), this specification increases the statistical power, which is particularly helpful in this context where the sample size is low:

where Y it captures the outcome at t = 0, 1, i.e. baseline or endline. We complement the right-hand side variables by including vector X i that contains the following control variables assessed at baseline: household size, years of schooling of the household head, age of the household head, a dummy for female household heads, a dummy for land size indicating whether the plot is larger than seven acres, the number of parcels, a dummy indicating whether the farmer plants coffee, a dummy indicating whether the number of coffee trees is above 500, a dummy indicating whether the farmer has savings at a bank, a dummy indicating whether the household has a mobile phone, a dummy indicating whether the household has electricity, a dummy indicating whether the distance to the next producer market is larger than 5 km and a dummy capturing whether the respondent feels her neighbors can be trusted.
In all regressions, we correct the standard errors through clustering on the PO level. This takes into account that the regressors of interest, i.e. the treatment indicators, do not vary on the individual but only on the PO level.
Impact on marketing
The goal of both the CoD and IoS interventions was to reduce the costs associated with marketing through the PO, thereby increasing the degree to which farmers chose to market through the institution. We examine first whether POs that received these interventions were able to encourage their members to sell more through the group.
Table 6 presents estimates of the ITT effect on the total amount sold through the PO using PO data. All treatment arms recorded higher levels of goods sold, but only CoD resulted in significantly higher sales. Total PO sales increased in the CoD group by roughly 450 kg (Column 1). When including covariates, the parameter estimate increases to 570 kg and achieves significance at the 5 percent level.
Table 6. OLS—impacts on PO sales and service—PO level

Notes: Standard errors in parentheses clustered at DC-level. All estimations include fixed effects for the Depot Committee (DC). Columns 1–4 have PO sales to DC (in kg) as dependent variable. All regressions with covariates control for Share of female PO members, Avg. member's land size, Share of leaders with primary education or higher, members’ distance to bulking location (in minutes walking). Two POs are excluded from estimation as they do not report Distance to bulking location (Kitale-nam, Kabimbiri). Two POs are excluded from estimation as they do not report number of members at baseline (Kyantale-n, Biyinzika).
*
$p< 0.10$
 , **p < 0.05.
Any increase in the POs’ total amount of sold harvest could, of course, be a consequence of either an increase in the number of PO members contributing to the bulking or an increase in the amount each member sells. We test whether there was an increase in the amount each member bulked in columns (3) and (4) where we normalize the left-hand side variable by the number of PO members. Taking this transformation into account, the coefficient estimates for PO sales (per member) range in size from 22.3 to 25.3 kg per member depending on the specification but are significant (at the 5 percent level) only when covariates are included.
Table 7 shows that, with regard to sales behavior, the sample of households is well balanced across treatment groups with 22–26 percent of members choosing to sell through the group at baseline. In particular, the CoD group is at 22 percent compared to the control group with 21 percent of members selling through the PO at baseline.
Table 7. Summary statistics of sales characteristics

Table 8 examines the same question—whether the interventions increased the amount sold through the PO—using data collected in the household surveys. Columns (1) to (4) estimate the impact of the interventions on the probability a household sells through the PO and columns (5) to (8) estimate the impact of the interventions on the average quantity sold. The results are consistent with those from the PO level analysis. All interventions increased the probability that members sold through their PO, but only the CoD intervention had a significant impact. Households in POs with the CoD intervention were 24 to 28 percentage points more likely to sell through the PO in their most recent transaction or any of their last three transactions. The significance and size of this estimate are robust to the inclusion of the baseline value of the outcome variable and baseline characteristics. The quantity sold through the PO also increased with the CoD intervention, but we only observe weak significance for these estimates.
Table 8. OLS—Impact on household marketing behavior

Notes: All estimations include fixed effects for the Depot Committee (DC). All Sales is the sum of the last three or the largest sales in the 12 months preceeding the interview.
*p < 0.10, **p < 0.05, ***p < 0.01. Standard errors in parentheses clustered at PO level.
In Table 9, we assess whether the characteristics of transactions improved as a result of the interventions. In the baseline data, members had noted that price and ability to sell quickly were important characteristics that determined the choice of sales outlet. The higher quantities bulked by the PO could facilitate higher prices through economies of scale and increased bargaining power or an increased rationale for trying to go further up the marketing chain, for example, by getting transport and transporting goods to Kampala for sale to an exporter. Alternatively, the faster payment offered by the PO could have forced traders to increase their prices to match the more competitive group offer. CoD should also have resulted in faster payments and shorter gaps between harvest and sales (Table 10).
Table 9. OLS—Impact on sales characteristics

Note: All estimations include fixed effects for the Depot Committee (DC). All Sales is the average of the last three or the largest sales in the twelve months preceding the interview.
*p < 0.10, **p < 0.05, ***p < 0.01. Standard errors in parentheses clustered at PO level.
Table 10. OLS—Impact on nonlabor inputs
Notes: All dependent variables are dummy variables indicating whether the farmer spent money on the specific technique in the last two seasons. All estimations include fixed effects for the Depot Committee (DC). Soil Preparation captures any costs for soil preparation (e.g., oxen, tractor, etc.).
*p < 0.10, **p < 0.05, ***p < 0.01. Standard errors in parentheses clustered at PO level.
The results indicate that prices were indeed higher for farmers in POs in the CoD intervention. Farmers in these POs received prices that were on average 24 to 26 percent higher. Higher prices were observed for farmers who sold through the PO rather than for farmers who did not sell through the PO (results not shown). This suggests that higher average prices were driven by the increased ability of POs to secure better prices for their members rather than the result of increased competition. These results are robust to the inclusion of baseline characteristics and prices. There was no difference in the number of days between harvest and sale for those in intervention POs.
Farmers in the IoS intervention were not significantly more likely to market through their PO and, perhaps as a result, they did not receive higher prices than farmers in the control group. The insignificance of this intervention could in part be due to poor implementation—it took some time for the text messaging system to become a fast conduit of information to members as DCs were initially slow to provide the transaction details to the third party managing the service. However, it could also be that lack of trust was not a major constraint limiting farmers’ sales through the PO. Given the limited effect of IoS it is surprising that in groups that implemented IoS and CoD together, CoD did not seem to have a significant impact. It could be that IoS had an offsetting effect in these groups, but it is not clear why.
Impact on production decisions
We now examine whether, in addition to improving marketing outcomes, the interventions also caused changes in production practices, and, in particular, in the level of labor and nonlabor inputs applied in crop production.
The CoD and IoS interventions were explicitly designed to have an impact on marketing. The objective was to incentivize farmers to transfer their sales from traders to the POs. The major aim was not to increase overall crop production or even affect input decisions. This is reflected in the design, timing, and duration of the interventions, for example, intervention activities started during the harvest season in year 1, not during preparation or planting periods.
However, in the following, we shift the focus of the analysis from marketing outcomes to production and input outcomes. The motivation to conduct these complementary analyses, which stretch outside of the project's initial focus, is that one could expect unintended positive effects of the marketing interventions. In anticipation of improved marketing channels, farmers might have been incited to alter their input decisions, which in turn might have increased production quantities.
Nonlabor inputs
Improved marketing, and the higher prices it brings, could incentivize the use of fertilizer and other inputs. The use of potentially productivity-increasing but costly inorganic fertilizers is low in Uganda, with less than 5 percent reporting they regularly use it (Benson et al. Reference Benson, Lubega, Bayite-Kasule, Mogues and Nyachwo2012). Several reasons have been offered for low usage rates, and one possibility is that the return to using fertilizers is not high enough, meaning that higher prices would help. Local seed varieties (open pollinated varieties) remain the dominant choice for smallholder maize farmers in Uganda. Adoption rates of modern hybrid seeds are low (Doss et al. Reference Doss, Mwangi, Verkuijl and De Groote2003). Coffee is a tree crop and farmers are unlikely to respond to a one-year marketing intervention by planting new trees and, in addition, these trees will start producing coffee only four to five years later.
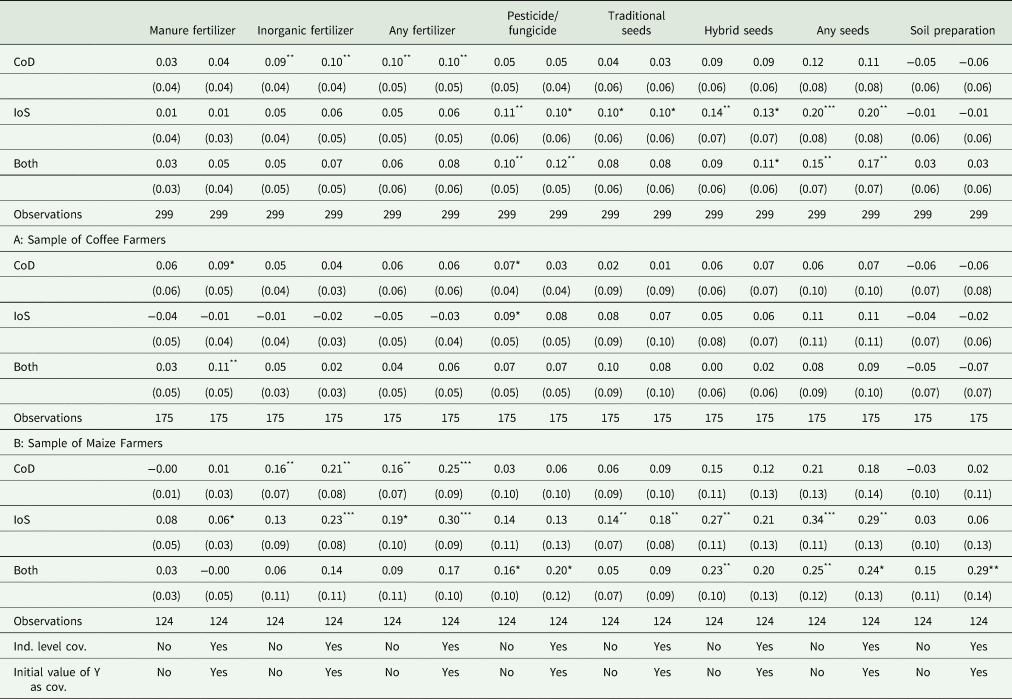
While the period of observation covers two agricultural seasons, the available data on nonlabor inputs do not allow us to distinguish the input use by season. We, therefore, need to consider the interventions’ effect on nonlabor input use in the last two seasons as a whole. For the entire year under study, we find that nonlabor inputs are affected positively and differentially across treatment arms. Panel A of Table A19 presents the impact estimates on nonlabor input factors. It shows that the impact on the use of organic manure fertilizer is close to zero for all treatment arms. For inorganic fertilizer, on the other hand, we obtain significant estimates in the range of a 10 percent increase among the CoD farmers. This is consistent with the hypothesis that if farmers face higher returns to the use of fertilizer, they will be more likely to use it. A question that remains is why higher use of seeds and hybrid seeds does not translate into more transactions through the PO. We know that sales to traders did not increase as a result of the IoS intervention as selling to a trader is the alternative if you do not sell to the PO and we see no difference in sales to the PO for the IoS intervention (Table 8). However, it could be that within traders, farmers are choosing to skip the first level itinerant trader and sell to a larger trader, or that they are improving their bargaining position with the same traders. Although we cannot test for this with the data we have at our disposal.
The estimates on the use of pesticides and fungicides are of similar size and significance for the IoS and the both treatment arms. Spending on traditional seeds also increased by 10 percent in the IoS sample but the coefficients are only significant at the 10 percent level. Spending on hybrid seeds was affected significantly only among IoS farmers. It is not clear what is driving these results.
Labor inputs
The data on labor inputs allow us to distinguish labor used in the August to December season and the March to July agricultural season. Due to the experimental set-up, the “second season” in year 1 (Aug–Dec) was only partially treated as project activities started only during the harvest time. The “first season” in year 2 (March–July) was fully treated. If we would expect any unintended effects on labor inputs, it is thus during this first season in year 2 that these should materialize. In the first intervention season (Aug–Dec of year 1), which we label “second season” in the tables, the impact of the interventions on marketing outcomes could not be anticipated by the farmers at the time when production and input decisions were made since intervention activities only started during the harvest period. Consequently, effects should not occur here.
In the second intervention season (Mar–Jul of year 2), which we label “first season” in the tables, the marketing interventions and their effects on marketing outcomes were known to the farmers. We may thus expect different effects for the first and second intervention seasons. Therefore, we estimate all regressions separately for the season where input decisions are taken without any knowledge of the intervention (Aug–Dec) and for the season where members have some experience with the intervention (Mar–Jul). During the latter, PO members would have had some experience about how the interventions change access to markets, which supposedly might affect their input decisions though this was not intended by the intervention.
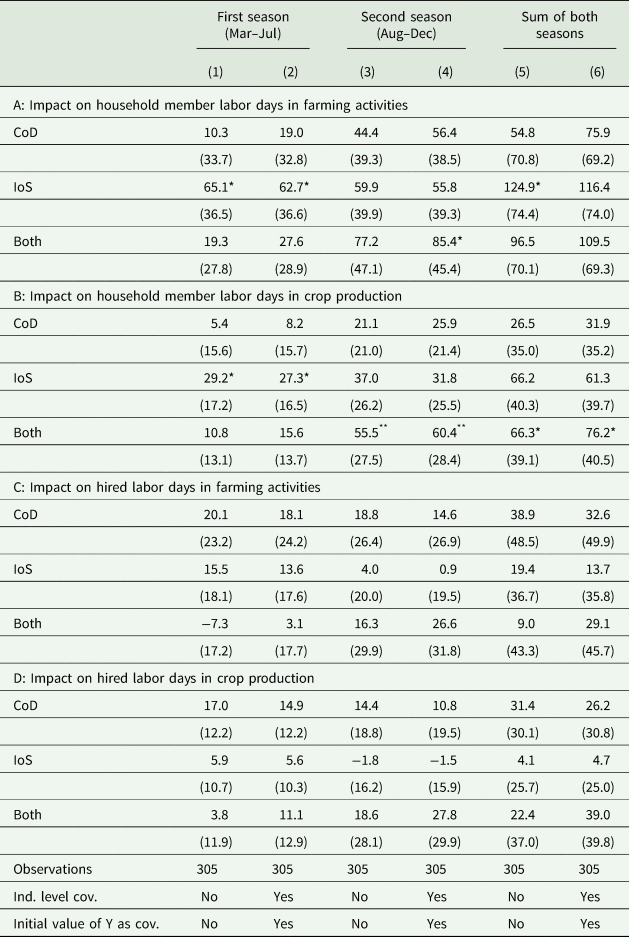
Table 11 presents coefficient estimates of equation 1 in odd columns and of equation 2 in even columns, starting with the first season of year 2, followed by the second season of year 1, and then both seasons combined. During the season at the start of the intervention (the second season of year 1), we see no increase in the household or hired labor for CoD or IoS as expected. However, for those receiving both treatments, higher household labor on crop farming was reported. It is plausible that a labor effect could have resulted from an increase in expectations raised as a result of the intense preparation for the interventions in this group. However, the size of the estimated effect is very large making it unlikely that this is a true impact of intervention activities. There is a significant and large impact of IoS on household member labor days in farming activities during the first season of year 2. However, this is measured imprecisely and is only significant at the 10 percent level. Although, these effects remain even when controlling for baseline characteristics. The same imprecise labor impact is observed when examining the number of days households report spending on crop production (a subset of days spent on farming).
Table 11. OLS—Impact on labor inputs—household level
Note: All estimations include fixed effects for the Depot Committee (DC).
*p < 0.10, **p < 0.05, ***p < 0.01. Standard errors in parentheses clustered at PO level.
A key question is not only whether households adapt their own labor input in anticipation of better market access but whether their demand for external labor is also affected. Panels C and D of Table 11 examine the impact on labor hired for farming and crop production, respectively. We see that there is no significant impact.
Given the positive effects of IoS on labor and nonlabor inputs, one may wonder why there are no effects on hired labor. One reason may still be cash constraints in that hired labor has to be paid well in advance of the harvest and sales. In addition, the final sales price of coffee/maize is unknown in advance when hired labor has to be paid. To some extent, one could also expect effects for hired labor to be smaller than for family labor since the overall higher labor demand in a village because of the IoS intervention will decrease surplus supply (i.e., supply of labor days that are not invested in the own farm) and push up prices for labor. In our setting, we are unable to analyze such effects since we also observed a general increase in hired labor during the study period: Even in the control villages, the amount of hired labor increased from 34 days at baseline to 52 days at endline (Figures 2 and 3). At least in part, these increases in the entire study sample may result from hikes in the prices for coffee. World market prices increased dramatically during the study period (see Figure 4). It is not unlikely that these spikes were passed through to local markets, sparking the farmers’ interest in increased crop production and therefore also the demand for (hired) labor.

Fig. 2. Changes in proportion of hired labor days in total days in crop production.

Fig. 3. Changes in proportion of hired labor days in total days in farming.

Fig. 4. New York cash price for arabica and robusta coffee, US cents per pound (Source: http://www.indexmundi.com). Vertical lines indicate time of survey.
Average impact on agricultural output
The indicative evidence that we provide for a positive effect of our marketing intervention on labor and nonlabor inputs would suggest that, consequently, agricultural outputs should increase as well as a result of the treatment. In this section, we explore whether the improvements in marketing in the second season of year 1, which might have led to increased labor and nonlabor inputs in the first season of year 2, were translated to higher agricultural yields at the end of the first season in year 2. We construct our outcome variable capturing agricultural yield by dividing the quantity of harvest a PO member produced by the total land planted to that crop. Given intercropping, this is an imprecise measure of yields but is the closest measure the data allow for.
Table A9 presents estimation results for the full sample (Panel A) as well as the two sub-samples of coffee and maize farmers (panels B and C, respectively). Columns (1) and (2) present estimates for the first harvest season, Columns (3) and (4) for the second season, and Columns (5) and (6) combine harvest amounts for both seasons.
Regardless of the estimation specification, the results on the full sample do not suggest any significant effects. For the CoD treatment, the estimates on the sub-sample of coffee farmers show significant positive effects on yield in the first season (Mar–Jul of year 2) and when we combine harvest amounts of both seasons. The estimates for the combination of CoD and IoS show similar effects in size though the statistical significance is lower. For the IoS treatment, we did not obtain any significant estimates. For maize farmers, in Panel C, all estimates are insignificant except for the estimates on both when controlling for covariates.
Discussion and conclusion
In the econometric analysis, we found positive and significant effects on the amount of harvest that farmers sell to the PO for the CoD intervention. These effects were significant when estimated using the PO level data, as well as for the household level data. Not only are farmers in the CoD treatment arm significantly more likely to sell through the PO, they also sell larger amounts of the harvest to the PO. Consequently, one can argue that providing CoD was successful in achieving the intervention's main goal, improving the joint marketing of PO members. The IoS treatment, on the other hand, did not produce significant effects on these outcomes. This hints at the relatively higher importance of immediate liquidity constraints compared to the lack of transparency with regard to the farmers’ sales decision.
There is some evidence that the better marketing outcome available for farmers in the CoD intervention resulted in increased investments in fertilizer and pesticide with an impact on the amount of crop harvested. It is not clear whether these results are as a result of higher incomes realized during the intervention or as a result of higher expected prices as a result of the intervention. However, these results were not consistently observed across the sample, they were more in evidence for farmers in coffee marketing groups. There was also no increase in investments in seeds for maize CoD farmers.
Although there was no impact on marketing outcomes for the IoS group when considering the effects on labor and nonlabor inputs, we found positive effects for the IoS intervention. The effects were significant only for use of pesticides and purchase of seeds, whereas no statistically significant effects were found for fertilizer or hired labor.
This would be consistent with a scenario where asymmetric information about prices and transactions is indeed a major concern. However, the mechanisms by which this impacted inputs and why this reported increase in household labor and spending on seeds and pesticides had no impact on output are not clear.
Our results provide evidence that collective action in marketing can aid rural development. When POs that were struggling to encourage their members to sell collectively were strengthened through access to working capital, they were able to pay farmers cash on delivery which increased group sales, amounts bulked, and increased the prices that were offered to farmers. Better marketing outcomes induced by payment of cash on delivery also appear to have encouraged increased use of inorganic fertilizer.
Ultimately, these results are good news for producer organizations and for the role they can play. The challenge ahead is the implementation of changes in their structure similar or identical to those assessed in this article.
Supplementary material
The supplementary material for this article can be found at https://doi.org/10.1017/age.2021.19.


 Open access