


1. Introduction
The central regions of hailstones occasionally appear to be frozen water drops because of air-bubble shells showing drop shapes similar to those observed by Reference MagonoMagono (1954). In most cases, however, the origin of the hailstones can easily be traced back to graupel particles (Reference ListList, 1958), but whenever the origin is questionable, frozen drops may form the core area. Therefore, clear specifications of the properties of frozen water drops are needed to settle this disputed point, in addition to satisfying our general interest in these properties.
Knowledge of the crystallographic orientation, and the actual sizes of the crystals and air bubbles in frozen water drops is limited. Reference Blanchard, Weickmann and SmithBlanchard (1957) observed how the manner of freezing of water drops as large as 10 mm diameter depend upon the temperature of the air, but did not investigate any structural features. Reference Kidder and CarteKidder and Carte (1964) describe nonquantitative observations of the bubble and crystal structure of water drops, as large as 9 mm diameter, frozen at terminal velocity. The purpose of the present paper is to describe quantitatively the freezing of water drops (with diameters 1 to 8 mm and moving at terminal velocity relative to the air) and the properties of the frozen drops. However, due to the fact that no drops froze except by artificially induced contact nucleation, no cases were simulated with active ice nuclei initially imbedded in the drops.
2. Experimental arrangement and techniques
Vertical wind tunnel. The vertical wind tunnel, shown in Figure 1, allows suspension of freely floating water drops of diameter 1 to 8 mm. The closed circuit design permits the temperature and purity if the air to be controlled easily. The tunnel is located in a large cold room which has a minimum temperature of −25° C. However, the lowest tunnel temperature, in spite of a separate tunnel cooling unit, is only about −19° C due to the compressional heating by the air filters.

Fig. 1. The vertical wind tunnel with: 1. fan, 2. cooling elements, 3. air filters, 4. screens, 5. contraction section, 6. test section.
The radial fan, driven by a 5 h.p. (4 kW) motor, forces air vertically upwards through the test section. The air speed is controlled by moveable vanes at the fan inlet. The screens below the test section keep the turbulence level low—the r.m.s. vertical velocity fluctuations were about 2% of the mean flow velocity. Two filters (Fan Flanders Type Airpure Absolute Filters, model 7C62A), arranged in series, keep air impurities to very low concentrations.
Two crossed vertical plates and a 3 cm diameter screen centered on the axis of flow below the test section, an arrangement similar to Reference BlanchardBlanchard’s (1950), create the well-shaped velocity profile that permits drops to be floated in a stable position. A typical velocity profile at the location of the floating drops is shown in Figure 2.

Fig. 2. Typical velocity profile at the 15 cm level of the test section.
An expanding cone, with an included angle of 6 deg, causes the air speed to decrease with height in the test section. Since a drop finds its own level, there is no problem in setting the air speed to the appropriate terminal velocity. Liquid drops could be floated freely up to 30 min and more, even at the lowest operating temperature of −18.5° C. However, freezing and frozen drops normally left the test section rather suddenly unless they were stabilized by the nucleation-inducing thermocouple.
Freezing of the water drops. Single water drops, of diameter 1 to 8 mm, and with a temperature of 0° C, were placed in the test section with a syringe, which was fitted with a millipore filter (type HA) to remove impurities larger than 0.4 μm in size. Distilled de-ionized water, ordinary tap water, and 10−3 and 10−4 molar common salt solutions were used in the experiments. Since the results did not depend much on the origin of the water (except for crystallo-graphic properties) only data for distilled de-ionized water will be presented here.
Each drop was suspended for about five minutes before the initiation of freezing to allow it to attain thermal equilibrium with the surroundings and to become saturated with air. A check was made using our “worst” environmental conditions in the estimates for the time water drops take to approach temperature equilibrium (Murray, unpublished) and air saturation (Reference Johnson and HallettJohnson and Hallett, 1968). It indicated that the time allowed was reasonable, particularly in view of the fact that the above estimates should be reduced due to the circulations set up in the drop when it is detached from the syringe (Reference Grov, Grov, Otto and Schugerl.Grov and others, 1969).
Freezing was initiated by touching the drop surface with a frost crystal mounted on a copper-constantan thermocouple tip (0.079 mm diameter). This permitted the surface temperature of the drop to be monitored on a Honeywell potentiometric recorder.
The equivalent spherical diameter of the drop was found from its weight in the frozen state (accuracy of ±0.1 mg) about five minutes after freezing.
The freezing time was estimated from the curve of temperature versus time obtained from the recorder. The inflection point of this curve, which occurs about the time when the release of latent heat stops, was taken to be the end of freezing. This estimate agreed within 5 to 10 s with visual estimates of the completion of freezing.
After proper storage at ice saturation at −25° C and within a day of freezing, the frozen drops were cut, in a cold room at −10° C, along a major section including the axis of rotational symmetry to reveal their internal structure. Details of the method of preparation of the section are given by Charbonneau (unpublished, p. 3–6). Structural data on etched sections of the frozen drop was recorded on formvar replicas using the technique developed by Reference SchaeferSchaefer (1956) and Reference HiguchiHiguchi (1958).
3. The freezing of drops
Freezing time. The freezing time of a drop is mainly determined by the original supercooling and the heat exchange by convection, conduction and evaporation with the environment during the relatively slow inward freezing of the water trapped between the dendrites which grow rapidly into the drop from the seed crystal. The time during which the artificially induced dendrites grow into the drops, freezing a fraction C w T w /L f of their mass (specific heat C w, wet-bulb or original drop temperature T w, and latent heat of fusion L f) is negligible (≈ 1 s) compared to the time taken to freeze the remaining water (≈ 120 s).
The observed freezing times are compared with freezing times estimated from a modification of the approximate equation by Reference Johnson and HallettJohnson and Hallett (1968) (Fig. 3). Their model applies to the symmetric freezing of a supercooled water drop by the inward growth of a spherical ice shell under steady-state conditions, and assumes that the heat exchange with the environment is proportional to the difference between the surface temperature T s, and the environment temperature T e, and that the air was saturated over ice.

Fig. 3. The dependence of freezing time on wet-bulb temperature and drop radius, with experimental points and a theoretical curve.
This approximate equation was modified to account for variations in humidity of the air essentially by replacing T e by T w, the wet-bulb temperature of the air. Detailed justification for this is given by Murray (unpublished) by consideration of the equilibrium heat exchange with the environment after freezing is complete.
A second modification was that the effective thermal conductivity of the air (K = K g+β D wa L s, where K g is the thermal conductivity of the air, β the slope of the vapor density temperature curve, D wa the diffusivity of water vapor in air, and L s the latent heat of sublimation) was permitted to vary with the environmental conditions rather than be taken as an arbitrary constant. It turns out that K = K 0(1+C w T w/L f) adequately represents this variation, where the constant K 0 = 4.2×10⁻⁴ W m−1 K−1, the value of K for T w = 0° C.
With these modifications, we arrive at a formula for the freezing time

where ρ
w is the density of water, a the equivalent spherical radius of the drop and K
i the thermal conductivity of ice. The ventilation factor f was estimated using an equation ![]() similar to that of Reference Ranz and MarshallRanz and Marshall (1952) and using estimates of the Reynolds number (Re) obtained from the Reference Gunn and KinzerGunn and Kinzer (1949) data for terminal velocities of water drops. Values for the quantities used were obtained from the Smithsonian meteorological tables except that the values of D
wa and the dynamic viscosity (for (Re)) were taken from Reference Beard and PruppacherBeard and Pruppacher (1971).
similar to that of Reference Ranz and MarshallRanz and Marshall (1952) and using estimates of the Reynolds number (Re) obtained from the Reference Gunn and KinzerGunn and Kinzer (1949) data for terminal velocities of water drops. Values for the quantities used were obtained from the Smithsonian meteorological tables except that the values of D
wa and the dynamic viscosity (for (Re)) were taken from Reference Beard and PruppacherBeard and Pruppacher (1971).
The approximate solution (solid curve in Fig. 3) is in good agreement with the observed freezing times, although the supercooled drops were aspherical and did not freeze symmetrically.
Partially frozen drops. The liquid water contents of partially frozen drops, determined by microcalorimetry, were also compared to the predictions of the model of the freezing of supercooled drops. The calorimeter was designed to have a very low heat capacity (40.0 J K−1), so that reasonably large temperature changes would occur despite the small size of the particles. Partially frozen drops were removed from the wind tunnel, weighed and placed in the calorimeter; their liquid water content was then calculated from the temperature change and corrected for heat losses of the calorimeter and its contents with the aid of the equation used by Reference ListList (1961) for determining the liquid water content of spongy hailstones.
The results for ten different partially frozen drops with an average diameter of 2.6 mm and air and wet-bulb temperatures of −6.2 and −7.2° C respectively are shown in Figure 4. In this graph, the liquid water content is plotted against removal time t divided by the total freezing time t f estimated from Equation (1). The division by total freezing time adjusts for the small variations of particle diameters and environmental conditions. The solid curve, which is calculated from the freezing model, agrees within experimental error with the observations and is almost linear. Note that the model, which predicts that the liquid fraction when t = 0 is (1−C w T w/L f), already assumes nucleation and freezing of ice equivalent to the degree of supercooling at the start.
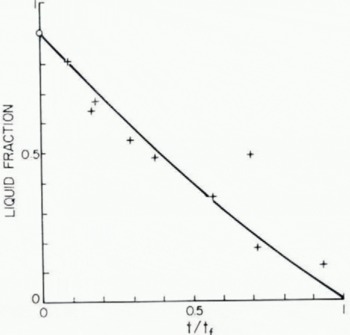
Fig. 4. Fractional progress of freezing of 5.2 mm diameter water drops at an environment temperature of −6.2° C. Experimental results (points) are compared with model (solid curve); t freezing time, tf time for complete freezing of drops.
Asymmetry of freezing. Examination of partially frozen water drops revealed asymmetry of the heat and mass exchange with the environment. The ice shell was thicker on the lower portion of the drops where the heat and mass exchange must be more favourable.
A thin section of a partially frozen drop which illustrates this asymmetric distribution of ice is shown in Figure 5. This section was made by slicing a partially frozen drop with a hot wire, removing the water with a syringe, freezing half of the drop to a slightly warmed glass, and slicing it again to produce a section about 1 mm thick.

Fig. 5. Photograph of a thin section of a partially frozen drop with a maximum diameter of c. 0.5 cm.
In Figure 6 a photograph is shown of a thin section of a frozen drop prepared by a quenching technique used by Knight and Reference Knight and KnightKnight (1968) in which a partially frozen drop is cooled rapidly in an alcohol bath at −60° C. Again an asymmetric distribution of ice in the shell is displayed. In the portion of the drop which was liquid when it was removed from the wind tunnel, clouds of micrometre-size air bubbles are produced by the rapid freezing which occurs during quenching. Thus, the ice shell can be distinguished from the liquid core, i.e. the cloudy central part of the quenched drop.

Fig. 6. Photograph of a thin section of a quenched, partially frozen drop with a maximum diameter of c. 0.5 cm; dark areas represent clear ice. (The cut was taken about 0.06 cm from the minor axis.)
The photographs show variations in thickness of the ice shell consistent with the variation of the local heat and mass transfer around the periphery of spheres (Reference SchueppSchuepp, 1971) at the same flow conditions. The thicker ice in the regions of high surface curvature is most likely to be a shape effect.
The fall behaviour of freezing drops will influence the presence of the inner structural asymmetry while no change in shape is expected on most occasions. In the experiments reported here, the drops were fixed as they froze so the structural asymmetry is present, but in nature, drops with frozen outer shells may tumble as they fall, so the inner structural asymmetry may be different. Occasionally, freely floating drops were observed to flip over when they froze in the wind tunnel and continue to float with the flat side up.
4. Air bubbles and single crystals
Air-bubble sizes from planar cuts. Air-bubble sizes in the frozen water drops were measured on major planar cuts through the drops, rather than in the bulk ice, because it is easier experimentally. Estimates of the true (volumetric) bubble sizes and size distributions can always be made from the apparent sizes (i.e. the bubble sizes on a planar cut) by the method described by Murray (unpublished) which is an extension of the work of Reference WicksellWicksell (1925) to this special problem. This estimation technique takes into account that the planar cut shows a disproportionate number of large bubbles (because the probability of being intersected by the section plane increases with bubble diameter) and that the section plane does not in general pass through the maximum cross-section of a bubble.
The measurements were made by placing the replicas of a major section through the frozen drops on a projection microscope (“Projectina”) and using a plastic template with a series of circles whose areas increased in the progression 1, 2, 4, …, to classify the bubble sizes.
One problem that arises in measuring the bubbles is that in the replication of the cut surface, the formvar faithfully molds bubbles whose maximum cross-section lies below the ice surface. It was found that a stereo microscope could be used in these cases to ensure that the cross-section in the cut plane was measured as required by the method, and not the maximum cross-section of the molded bubble.
The cumulative percentage against bubble diameter in logarithmic form gives straight lines (Fig. 7), indicating that the size distributions are roughly log normal in form, shifting to smaller sizes as the air temperature decreases.

Fig. 7. Cumulative air-bubble size distributions for water drops frozen at different environment temperatures.
Figure 8 shows how the average planar diameter of the air bubbles varies with air temperature. On the average, bubbles are smaller at lower air temperatures, decreasing from a mean planar diameter of 100 μm at −2° C to −25 μm at −18.5° C. This temperature dependence of air bubble size can be represented by the formula:
where x is the mean planar diameter, and T e the air temperature in °C. There is more variability in the results at high temperatures because there are fewer bubbles in a given drop section.

Fig. 8. Mean planar air-bubble size as a function of environment temperature.
The planar concentration of air bubbles in the frozen water drops is high when the bubbles are small, and low when they are large. As a result of this, the density of the frozen water drops varies only slightly from 0.88 to 0.91 Mg m−3. In Figure 9, a line
with n in cm−2 and x in μm, has been fitted by eye to the concentration versus mean planar diameter data.

Fig. 9. Dependence of planar bubble concentrations on mean planar bubble diameters; measured points with approximating curve; + for semi-transparent ice, ʘ for opaque ice.
The air bubbles are not distributed uniformly through the frozen drops. Usually, there is a surface layer 0.4 to 0.8 mm thick which contains very few bubbles, and inside this layer, a partial or complete ring of high concentration of bubbles can be found. Bubbles frequently occur along crystal boundaries, and in some cases in lines parallel to crystal boundaries.
The air-bubble sizes found in this investigation are smaller, and the concentrations larger, than Reference CarteCarte (1961 [a]) obtained for similar two-dimensional ice growth rates. This is not unexpected as the freezing is three-dimensional here, and in addition bubble sizes are determined by a different method.
In Figure 10, the total volume of air per unit volume of ice (estimated from the ratio of total bubble area to the area of the drop cross-section) is compared to the volume of air dissolved in air-saturated water at the nucleation temperature. The saturation volumes were obtained by extrapolation of the data on the solubility of air in water in the International critical tables.

Fig. 10. Comparison of the fractional volume of air observed in frozen water drops with the fractional volume of air dissolved in the water at saturation.
The amount of air observed in the frozen drops is generally smaller than the amount assumed to have been dissolved in the water. At high air temperatures, there may be an incomplete ice shell around the drop as it freezes so that air coming out of solution may diffuse or float as bubbles to the free upper surface and escape. However, even at low air temperatures relatively low amounts of air are observed. A possible explanation is that the air in the bubbles is compressed due to the pressure of the forming ice. Pressure builds up within the ice because when water freezes its density decreases by about 9%. According to Reference VisagieVisagie’s measurements (1969) these pressures can reach tens of bars before the ice cracks.
Crystal areas. The mean crystal area A of cuts through the frozen drops with diameters between 3 and 8 mm increases with air temperature from 8×10⁻⁴ cm2 °C at −18.5 cm2 °C to c. 8×10⁻³ cm2 at −1° C, as shown in Figure 11. The approximating relationship between crystal area and air temperature is given by:
where T e is in °C.

Fig. 11. Variation of average crystal surface with environment temperature; measured points with approximating curve.
Smaller crystals were observed in tap-water drops. This may be caused by impurities in the water interfering with crystal growth. A few smaller frozen drops, with a diameter of about 1 mm, were also examined. As with the larger drops the number of crystals increased with supercooling, however it does not make sense to talk about mean crystal areas because of the small numbers and their statistical fluctuations.
The size distribution of the crystal areas is roughly log normal in form, because the cumulative distribution of crystal size can be approximated by a straight line when plotted on a log-normal probability chart (Fig. 12).

Fig. 12. Cumulative percentage of crystal surface area for water drops frozen at different air temperatures.
There may be ambiguities in crystal-size data because sub-crystals or regions with minor differences in crystallographic orientation may be counted as separate crystals. Some may be generated by distortion of dendrites due to mechanical forces; some may be interconnected to others in the third dimension and appear as two or more crystals when they really represent only one.
In Figure 13, a tracing of the crystal boundaries on a typical section of a water drop frozen at an air temperature of −9° C is shown. The shaded areas which consist of crystals with similar c′ orientation (c′ standing for the projection of the c-axis on the plane of observation) may seem to have been originated by one single crystal each. However, this conclusion is not tenable because in most cases it is clear from the shape of the etch pits that there is considerable variation in inclination of the c-axis and orientation of the a-axes with respect to the section.

Fig. 13. Boundaries, c′-axes and shape of etch pits of crystals of a water drop frozen at an air temperature of −9° C.
The areas of minor variation in crystallographic orientation may be produced by the distortion of the fine dendritic structure caused by the high stresses which can induce breaks or bending in the interior of the freezing drops. The distortion will be greater, and the apparent number of crystals larger, at larger supercoolings because the pressures are higher (Reference VisagieVisagie, 1969) and the dendritic structures thinner and more frail (Reference HallettHallett, 1964). This explanation assumes that after the final freezing of the supercooled drop, the observed crystallographic orientations are determined only by the orientation of the original dendrites.
Some increases in mean crystal size may occur during storage or etching of samples through recrystallization of the ice (Reference RoosRoos, 1966). However, according to Reference CarteCarte (1961 [b]), the changes which occur within a few minutes at 0° C during the etching process and for extended storage at −20° C would be insignificant.
Crystallographic orientation. Examples of the distributions of crystallographic orientation found in drops frozen at different air temperatures are shown in Figure 14, in which the number of crystals is plotted against orientation interval. In the histograms, orientation is the angle between the c′-axis and a radial line from the assumed growth center (Reference ListList, 1961), which was chosen subjectively roughly between the geometric center and the rear stagnation point of the drop, in an attempt to account for the asymmetric nature of the freezing.

Fig. 14. Orientation distributions of c′-axis for different air temperatures; 0° for radially oriented crystals, 90° for c′-axes perpendicular to radial direction.
There is a general tendency for the crystals to grow perpendicular to the c′-axis. The maxima near 90° are pronounced at high air temperatures, but at low temperatures there is a more random distribution of orientation, and perhaps a shift of the maximum to angles smaller than 90°, somewhat similar to the shifts observed by Reference Levi and AufdermaurLevi and Aufdermauer (1970) in artificial hailstones. The form of the orientation distributions was independent of the location of nucleation.
This observed ice structure must be explained by the way in which the growth of the ice in the supercooled drop proceeds from the seed crystal. Until the supercooling of the drop is exhausted, dendrites grow into the bulk of the liquid drop. Thereby, they change as Reference Macklin and RyanMacklin and Ryan (1966) observed, from simple planes to complex but single crystalline three-dimensional structures as the supercooling increases. Dendrites in the bulk melt which are oriented with their maximum growth direction in the radial direction cut off the growth of less favourably oriented dendrites. According to Reference LeviLevi (1970), the main body of the dendrites, are oriented in the direction of the resultant of the growth velocities in the c and a directions. Since the velocity in the a direction is generally much larger than in the c direction, a crystal fabric in which the c-axis tends to be normal to the direction of maximum heat flow would be expected.
The change to a more random orientation at higher supercoolings may be explained by the increased distortion of the dendrites due to higher stresses (mentioned earlier in connection with crystal size). Also, as Reference HallettHallett (1964) suggests, crystals of new orientation, distinct from that of the seeds, may nucleate spontaneously at higher supercoolings.
Interpretation of the structure of hailstone cores. Although there were similarities, comparison of the structural features of the frozen drops with the central regions of hailstones analyzed by Reference List, List, Cantin and FerlandList and others (1970) revealed definite differences in some parameters. Most hailstones cores had a random orientation distribution while frozen drops tended to have a maximum near 90°. All the frozen drops had densities greater than 0.88 Mg m−3, whereas about half the hailstone cores had densities considerably lower than this. Although bubble and crystal sizes were similar in both the hailstone cores and the frozen drops, the probability that hailstone cores are frozen raindrops is therefore rather remote.
5. Summary and Conclusions
The principal structural features and rates of freezing of over 130 supercooled water drops of diameter 1 to 8 mm, nucleated artificially and frozen at air temperatures between −1° C and −18.5° C, have been measured.
The liquid water contents of partially frozen drops and the observed total freezing times are predicted reasonably well by an approximate solution of the heat exchange problem, even though this solution takes no account of the observed asymmetry of the heat exchange or the asphericity of the drops.
The size distributions of both air bubbles and crystals were log normal in form. This makes, as Reference List, List, Murray and DyckList and others (1972) show, a simple conversion from the mean particle sizes measured from planar cuts to true (volumetric) mean particle sizes possible. (They differ only by a few per cent.)
There is a decrease in the mean size of both air bubbles and single crystals in the frozen drops with decreasing air temperature. Planar crystal areas A varied from 8×10⁻³ cm2 at −1° C to 8×10⁻⁴ cm2 at −18.5° C, and air-bubble mean planar diameters x from 100 μm at −1° C to 25 μm at −18.5° C. The dependence of these characteristic properties on air temperature can be described by A = −0.026/(T e−2) cm2 and x = −400/(T e−2) μm where T e is in °C. The air-bubble concentration n is related to the mean planar bubble diameter by n = 2×10⁵ x −1.5 cm−2 where x is in μm.
The discrepancy between the low amounts of air observed in the frozen drops and the much higher amounts assumed to have been in the supercooled liquid may be explained by the effect of high pressures which prevail within the ice shell of a freezing drop.
The orientation of the c′-axes of the crystals in the frozen drop was tangential at high air temperatures, but became more random at the lower air temperatures.
There are normally distinctions between the structure of the frozen drops and that of the cores of a hailstone sample. No hailstones could yet be found to have grown from frozen drops other than when indicated by special air-bubble shells.


