


1. Introduction
More than half of Americans fail to save enough for retirement. According to Rhee (Reference Rhee2013), about 45% of US households lack sufficient retirement savings and, for working households about to retire, the median household's retirement savings is just $12,000.Footnote 1 Kirkham (Reference Kirkham2016) similarly shows that about 33% of Americans do not have any retirement savings and, among those near retirement age, about 54% have retirement-savings amounts that fall below the recommended threshold. Thus, many of these individuals will rely on Social Security, a program that is widely viewed as becoming increasingly financially strained. Therefore, it is generally viewed as important to identify possible mechanisms that can help people save more for retirement. This study investigates how changing the way 401(k) plan information is presented can plausibly impact participation and planning behavior.Footnote 2 In particular, it examines whether presenting (hypothetical) plan information in a more concise and tractable manner with salient recommendation affects: (i) anticipated participation rates, (ii) anticipated contribution levels, and (iii) anticipated asset-allocation decisions.
There are many reasons why Americans are not saving enough for retirement or are doing so (potentially) sub-optimally (Agnew, Reference Agnew2006; Tang et al., Reference Tang, Mitchell, Mottola and Utkus2010; Choi et al., Reference Choi, Laibson and Madrian2011). One important potential explanation is the complexity of the decision-making process (Campbell, Reference Campbell2006; Goldin et al., Reference Goldin, Homonoff, Patterson and Skimmyhorn2020), especially given the excessive paperwork and limited time typically available to make retirement-planning decisions (Madrian and Shea, Reference Madrian and Shea2001; Iyengar et al., Reference Iyengar, Huberman, Jiang, Mitchell and Utkus2004; Beshears et al., Reference Beshears, Choi, Laibson and Madrian2013). In addition, if employees are offered defined-contribution plans, which have become increasingly more likely and now outnumber defined-benefit plans (Campbell et al., Reference Campbell, Jackson, Madrian and Tufano2011), they must decide how much to contribute and in what financial products to invest. This process can be quite challenging and overwhelming, which might cause individuals to procrastinate in their enrollment decision (O'Donoghue and Rabin, Reference O'Donoghue and Rabin1998; Madrian and Shea, Reference Madrian and Shea2001; Carroll et al., Reference Carroll, Choi, Laibson, Madrian and Metrick2009; Beshears et al., Reference Beshears, Choi, Laibson and Madrian2013), fail to enroll (Goldin et al., Reference Goldin, Homonoff, Patterson and Skimmyhorn2020), or make inefficient portfolio decisions (Tang et al., Reference Tang, Mitchell, Mottola and Utkus2010). Moreover, employees often will resort to using ‘rules of thumb’ or rely on the choices or advice of others in making their retirement decisions (Benartzi and Thaler, Reference Benartzi and Thaler2007), and often will stick with default options (e.g., contribution rates and asset allocations) set by the employer, even if it is not optimal for the individual (Choi et al., Reference Choi, Laibson, Madrian, Andrew, Slemrod and McCaffrey2006; Beshears et al., Reference Beshears, Choi, Laibson and Madrian2013; Goda and Manchester, Reference Goda and Manchester2013); thus, tending to follow the ‘path of least resistance’ (Choi et al., Reference Choi, Laibson, Madrian, Andrew, Slemrod and McCaffrey2006).
A possible avenue through which retirement-planning choices might be impacted is the manner in which information is provided (e.g., Tversky and Kahneman, Reference Tversky and Kahneman1981; Kahneman and Tversky, Reference Kahneman and Tversky2000). Specifically, simplifying the enrollment information, which typically is very lengthy and complex (Beshears et al., Reference Beshears, Choi, Laibson and Madrian2013; Clark et al., Reference Clark, Maki and Morrill2014; Bateman et al., Reference Bateman, Eckert, Geweke, Louviere, Satchell and Thorp2016a, Reference Bateman, Dobrescu, Newell, Ortmann and Thorp2016b).Footnote 3 This type of information intervention would fall broadly under the categorization of being a ‘nudge’ (Thaler and Sunstein, Reference Thaler and Sunstein2008).Footnote 4 In contrast to traditional economic levers such as taxes, subsidies, and regulation, nudges alter the choice setting in a way that can predictably impact behavior (e.g., changing the default options), while still preserving the choice set and underlying economic incentives (see Hummel and Maedche, Reference Hummel and Maedche2019 for a review of efficacy of nudges across multiple domains). Because simplicity is widely considered a major component of successful nudges (Sunstein, Reference Sunstein2013; Halpern, Reference Halpern2015), the focus of this study is to consider the extent to which presenting plan information in a simplified way with salient recommendations can impact critical retirement-planning decisions – enrollment, contribution level, and portfolio allocation.Footnote 5
To do so, we conduct a hypothetical choice experiment administered via survey using a Qualtrics Panel of recently hired employees.Footnote 6 For robustness, we utilize two additional samples: a Qualtrics Panel of full-time job seekers, and a sample of business-school students. Respondents were provided with information about a hypothetical, but realistic, employer-sponsored 401(k) plan. We randomly varied whether respondents received plan information in the form of: (i) a convoluted, long description with all information written out in lengthy paragraphs, or (ii) a compact, short description with information presented in a concise table and prominently displayed ‘useful guidelines’ about retirement planning. Respondents were then asked a series of questions related to their anticipated behavior, based on the provided plan information.
The main hypothesis is that presenting the plan information in a more simplified and tractable manner would impact anticipated retirement-planning choices – enrollment, contribution level, and portfolio allocation. Moreover, because the simplified version of the plan information provides recommendations (e.g., rules of thumb) in a more salient manner, we also examine whether choices are more in line with these specific recommendations: (i) increased anticipated participation rates, (ii) increased anticipated contribution rates, and (iii) an anticipated portfolio allocation that reflects a suggested, age-based distribution between stock and bonds. All these outcomes are generally viewed as improved retirement planning outcomes (e.g., Bell, March 21, 2017; https://www.bankrate.com/retirement/8-rules-of-thumb-on-saving-and-retirement/).
After controlling for demographic and other factors, no significant differences were found between the control group that received the long version and the treatment group that received the short version in terms of their anticipated enrollment rates, confidence in their enrollment decisions, anticipated contribution rates, or their anticipated portfolio allocations. These results were robust across the two additional samples we consider. Additional data analysis related to the plan manipulation revealed that respondents, on average, spent more time viewing the long description but tended to process the plan information with a similar degree of accuracy. Overall, we find essentially no effect of providing simplified information on respondent's anticipated retirement-planning behaviors. Thus, our results cast some doubt on the idea that providing plan information in a more concise and tractable way will significantly alter retirement-planning behaviors. However, this could be viewed in a more positive light in that the simplified information will be more accessible and easier to process for employees, which can save time, while generally resulting in similar retirement-planning outcomes. In essence, our results indicate that there is (plausibly) no downside to providing simplified plan information. It is worth noting that the one factor that was consistently associated with anticipated behaviors is financial literacy, suggesting that educational initiatives might be more effective than manipulating plan presentation if the goal is to promote the following retirement planning outcomes – increased participation, increased contribution rates (at least up to taking full advantage of employer-matching), and more prudent, age-based asset allocation.
2. Relevant literature
In this section, we first briefly discuss the prior literature related to how information presentation and complexity specifically impacts retirement planning behaviors.Footnote 7 We then provide a more comprehensive review of the prior literature focusing on retirement-savings decisions and the factors that influence plan-participation behaviors.
2.1 Information presentation and complexity on retirement planning behaviors
Most closely related to the focus of this study, there are a few papers that investigate how information presentation and complexity impact retirement-planning decisions. Beshears et al. (Reference Beshears, Choi, Laibson and Madrian2013) argue that the complexity associated with plan-enrollment decisions can lead to procrastination and a failure to enroll. They examine the impact of a ‘Quick Enrollment’ option that allows individuals to enroll with a pre-selected contribution rate and asset allocation. They find that reducing the complexity of the problem through quick enrollment increases plan participation by about 10–20 percentage points. Moreover, there is strong persistence of the pre-selected option with significantly more people contributing at the pre-specified level (either 2% or 4%) and maintaining the pre-specified asset allocation. However, these interventions reduce the choice set of individuals and the pre-selected contribution rate and asset allocation may not be optimal for all employees. While Beshears et al. (Reference Beshears, Choi, Laibson and Madrian2013) consider a very extreme case of simplification, our study considers a subtler manipulation where the information people receive is simplified but they do not face a restricted choice environment.
Clark et al. (Reference Clark, Maki and Morrill2014) use a field experiment to examine how nudging employees through a follow-up flyer impacts plan enrollment. In particular, they consider a manipulation where non-participating employees at a large institution receive a simplified flyer with information about the benefits of participating in the plan and the importance of saving for retirement. They find that providing this simplified and encouraging information did increase participation, especially for males and younger, lower-income employees. Dolls et al. (Reference Dolls, Doerrenberg, Peichl and Stichnoth2018) document a similar effect that providing information (by letter) about the expected returns in the German pension system increases private retirement savings. Goldin et al. (Reference Goldin, Homonoff, Patterson and Skimmyhorn2020) show that sending an email describing how to enroll improves plan enrollment and also that suggesting a specific contribution rate even further improves participation. These prior studies consider how sending a (simplified) message can increase participation. Our study contributes to this line of research by examining how simplifying the presentation of the plan information impacts plan participation, while holding constant the content of the information that is provided across both the treatment and control conditions; namely, all people got a message, and what varied was the complexity of the message. In addition, we also examine other decisions, including planned contribution percentage and planned asset allocation.
Agnew and Szykman (Reference Agnew and Szykman2005) show that increased complexity can result in information overload, especially for those who are less financially literate, which can result in an increased propensity to stick with defaults. Kaufmann and Weber (Reference Kaufmann and Weber2013) find that more aggregation in presentation of investment returns results in greater risk-taking behavior, suggesting that providing investors with more aggregated information on returns results in more optimal investment choices. Tse et al. (Reference Tse, Friesen and Kalaycı2016) find that more complex advertised fee structures result in more decision errors and higher likelihood of sticking with the default in a stylized, portfolio-choice experiment. Thus, reducing complexity (and the choice set) appears to improve financial decision making.
Relatedly, several papers have shown that the manner by which information is presented can impact retirement savings behaviors (e.g., Bernatzi and Thaler, Reference Benartzi and Thaler1999; Bateman et al., Reference Bateman, Eckert, Geweke, Louviere, Satchell and Thorp2014, Reference Bateman, Stevens and Lai2015, Reference Bateman, Eckert, Geweke, Louviere, Satchell and Thorp2016a; McGowan and Lunn, Reference McGowan and Lunn2020), as well as what specific information is included in plan disclosures (e.g., Bateman et al., Reference Bateman, Dobrescu, Newell, Ortmann and Thorp2016b). Regarding the presentation of information, McGowan and Lunn (Reference McGowan and Lunn2020) use a controlled experiment and show that presenting information on the link between contribution levels and expected retirement outcomes in diagram form (compared to a table) impacts planned behavior; specifically, people are more likely to give advice to increase retirement contributions after seeing the diagram. In a series of choice-experiments, Bateman et al. (Reference Bateman, Eckert, Geweke, Louviere, Satchell and Thorp2014, Reference Bateman, Stevens and Lai2015, Reference Bateman, Eckert, Geweke, Louviere, Satchell and Thorp2016a) show that the manner by which portfolio risk is conveyed can impact planned portfolio decisions.Footnote 8
If suboptimal retirement savings behavior is a result, at least in part, of the complexity associated with the choice environment, then it is important to better understand how streamlining the decision process could possibly lead to improved retirement savings choices. With this aim in mind, our study focuses specifically on streamlining the way that 401(k) plan information is provided to potential participants. In this regard, our current study focuses on the question of how information is provided (holding constant the content of the information) – presenting information in a more concise manner – while much of the prior literature focuses on the questions of what information is provided.
2.2 Factors impacting enrollment decisions
One important set of factors shown to influence 401(k) enrollment is employee characteristics. In particular, age is associated positively with participation rates (Bassett et al., Reference Bassett, Fleming and Rodrigues1998; Madrian and Shea, Reference Madrian and Shea2001; Munnell et al., Reference Munnell, Sunden and Taylor2001). This may be because younger individuals may not yet have access to jobs that offer 401(k) plans, still may be obtaining an education, or are just stepping onto the career ladder. A similar explanation may be used with respect to the level of education as greater education improves access to a 401(k) plan (Brown and Weisbenner, Reference Brown and Weisbenner2014). Another factor that also is associated with enrollment decisions in 401(k) plans is income (Bassett et al., Reference Bassett, Fleming and Rodrigues1998; Madrian and Shea, Reference Madrian and Shea2001; Brown and Weisbenner, Reference Brown and Weisbenner2014). People with low incomes, especially youth, may be overwhelmed with debt payments and other budgetary constraints such that they feel that they cannot participate in 401(k) plans (Clark et al., Reference Clark, Maki and Morrill2014). Longer job tenure also has been found to result in a higher enrollment in 401(k) plans (Bassett et al., Reference Bassett, Fleming and Rodrigues1998; Madrian and Shea, Reference Madrian and Shea2001; Clark et al., Reference Clark, Maki and Morrill2014). Individuals' financial knowledge also correlates positively with enrollment in a 401(k) plan (Lusardi and Mitchell, Reference Lusardi and Mitchell2011; Brown and Weisbenner, Reference Brown and Weisbenner2014).Footnote 9,Footnote 10 Finally, an individual's planning horizon may be an important factor in explaining participation rates in 401(k) plans, with having a shorter planning horizon being associated with lower participation (Munnell et al., Reference Munnell, Sunden and Taylor2001).
Many factors related to specific plan attributes also have been shown to be important determinants in retirement-plan-enrollment decisions. Notably, employer-matching funds provide an incentive to enroll in 401(k) plans, and have been shown to stimulate enrollment (e.g., Papke and Poterba, Reference Papke and Poterba1995; Bassett et al., Reference Bassett, Fleming and Rodrigues1998; Hansen, Reference Hansen1999; Huberman et al., Reference Huberman, Iyengar and Jiang2007; Micthell et al., Reference Mitchell, Utkus and Yang2007; Clark et al., Reference Clark, Maki and Morrill2014). However, after a certain level, participation rates increase at a decreasing rate as the employer match increases. Besides plan features, peer effects also are believed to influence enrollment decisions in 401(k) plans. Duflo and Saez (Reference Duflo and Saez2002) find that employees are more likely to enroll in a retirement plan when their colleagues are enrolled. Thus, participation rates in 401(k) plans are likely to increase in environments where existing employees largely participate in 401(k) plans.
Prior research also suggests that automatic enrollment into a plan (as the default) is very effective at increasing enrollment. Madrian and Shea (Reference Madrian and Shea2001) find that, when a 401(k) plan is set as the default option, enrollment numbers significantly increase in the plan by 86%, from a participation rate of 49% prior to its institution. Similarly, Choi et al. (Reference Choi, Laibson, Madrian, Metrick and Wise2004) extend Madrian and Shea's (Reference Madrian and Shea2001) research and find that automatic enrollment increases participation by 85%. Relatedly, Carroll et al. (Reference Carroll, Choi, Laibson, Madrian and Metrick2009) show that the more subtle intervention of requiring new employees to make an ‘active’ choice also results in a sizable increase in 401(k) plan participation.
2.3 Factors impacting contribution decisions
Employees who enroll in 401(k) plans also are expected to choose their contribution rates. In addition to increasing participation rates, default options have been shown to affect contribution rates. Madrian and Shea (Reference Madrian and Shea2001) and Choi et al. (Reference Choi, Laibson, Madrian, Metrick and Wise2004) report that many new plan participants tend to maintain the default saving rates associated with automatic enrollment. For instance, Madrian and Shea find that 61% of automatically enrolled employees in their study continued to maintain the default rate, likely because some participants take the default rate to be investment advice. The authors explain that, because the default savings rates are low, this phenomenon tends to affect the retirement wealth of participants negatively, which can then result in insufficient retirement income (Benartzi and Thaler, Reference Benartzi and Thaler2007). Thaler and Benartzi (Reference Thaler and Benartzi2004) propose a novel solution to this problem – the ‘Save More Tomorrow’ program – which essentially defaults people into pre-committing to allocating a portion of future raises into their retirement plan. Importantly, the authors find that participation in the program successfully increases savings rates from 3.5% to 13.6% by the 4th pay raise, compared to a 6% rate for those who did not participate.
The availability of an employer match also is expected to motivate 401(k) plan participants to increase their saving rates. For example, Munnell et al. (Reference Munnell, Sunden and Taylor2001) show that the availability of a match increases contribution rates by 0.7 percentage points. However, the effect of match size on contribution rates diminishes over time. In addition to the presence of an employer match, an employee's saving in 401(k) plans may be influenced by the availability of borrowing opportunities. Munnell et al. (Reference Munnell, Sunden and Taylor2001) show that the ability of participants to borrow from their 401(k) contributions, which is valuable particularly for liquidity-constrained employees, positively influences contribution rates by 2.6 percentage points.
In terms of employee characteristics, Clark et al. (Reference Clark, Maki and Morrill2014), Huberman et al. (Reference Huberman, Iyengar and Jiang2007), and Stawski et al. (Reference Stawski, Hershey and Jacobs-Lawson2007) all suggest that contribution rates increase with age. This may be because younger individuals have more debt and/or less goal clarity than older adults. Gender also is found to be a factor determining 401(k) contribution rates. The contribution rates for men exceed those of women (Madrian and Shea, Reference Madrian and Shea2001; Clark et al., Reference Clark, Maki and Morrill2014). Huberman et al. (Reference Huberman, Iyengar and Jiang2007) suggest that this could be because, on average, males earn higher incomes than females.
2.4 Factors impacting asset-allocation decisions
Participants in 401(k) plans typically face the additional decision of how to structure their portfolios. According to Brinson et al. (Reference Brinson, Hood and Beebower1995), asset allocation accounts for approximately 90% of the variation in security returns. Yet, participants spend very little time choosing their asset allocations. In an experiment involving the University of Southern California's staff employees, Benartzi and Thaler (Reference Benartzi and Thaler1999) find that many respondents spend no more than one hour in making their asset-allocation decisions. In another experiment, Choi et al. (Reference Choi, Laibson and Madrian2011) find that people take, on average, 36 minutes to make their asset-allocation decisions.
Bernatzi and Thaler (Reference Benartzi and Thaler2007) offer a few possible explanations as to why employees do not spend much time making their asset-allocation decisions, given their complexity and importance. First, some 401(k) participants prefer instead to rely on the advice of their peers, friends, and family. Second, some participants simply adopt the default investment option associated with automatic enrollment. Third, people have a naïve view of diversification and thus choose to distribute their funds equally among the investment assets available in their company's 401(k) plan. Relatedly, Iyengar and Kamenica (Reference Iyengar and Kamenica2010) show that the number of investment funds offered through a plan impacts asset allocation via the likelihood of contributing to equity funds and the percentage contributed to equity funds.
Automatic enrollment also may affect asset-allocation. Research by Agnew et al. (Reference Agnew, Balduzzi and Sundén2003) shows the prevalence of inertia in asset-allocation decisions; namely, those who are automatically enrolled tend to invest less in equities because they are more likely to stick with conservative defaults. Madrian and Shea (Reference Madrian and Shea2001) and Choi et al. (Reference Choi, Laibson, Madrian, Metrick and Wise2004) provide further evidence to buttress this finding. Choi et al. (Reference Choi, Laibson, Madrian, Metrick and Wise2004) also find that as job tenure increases, the number of participants choosing the default declines. Camilleri et al. (Reference Camilleri, Cam and Hoffmann2019) also find that people are more likely to follow ‘smart’ default allocations that progressively become more conservative in their investment mix as the time window until retirement gets smaller (i.e., the person is closer to retirement).
Lastly, employee attributes also have been shown to shape asset allocations. For example, men are more likely to have stocks in their retirement portfolios and to invest more in stocks than women (Barber and Odean, Reference Barber and Odean2001; Agnew et al., Reference Agnew, Balduzzi and Sundén2003). Similarly, Neelakantan (Reference Neelakantan2010) find that men generally exhibit more risk tolerance than women in their retirement accounts. Heo et al. (Reference Heo, Nobre, Grable and Ruiz-Menjivar2016) also show that risk preferences mediate the relation between gender and investment behavior. According to Agnew et al. (Reference Agnew, Balduzzi and Sundén2003), married individuals also tend to allocate more funds to equities than single adults.Footnote 11 Clark et al. (Reference Clark, Lusardi and Mitchell2017) document that people with more financial knowledge hold a higher proportion of stocks in their portfolio. Lastly, Choi et al. (Reference Choi, Laibson, Madrian, Metrick and Wise2004) show that low-income participants are more likely to stick with a money-market-default allocation, while Agnew et al. (Reference Agnew, Balduzzi and Sundén2003) find that participants in high-income brackets invest a greater proportion of their 401(k) wealth in equities.
3 Experimental design
An online choice experiment was conducted to identify how the presentation of information about a hypothetical retirement-savings plan impacts anticipated savings choices. Respondents were presented with realistic retirement-savings-plan information. We systematically manipulated whether the plan information was presented in either a short, concise format or a long format.
3.1 Survey procedure
Respondents first were asked a series of general demographic questions, followed by five general financial literacy questions (Lusardi and Mitchell, Reference Lusardi and Mitchell2011).Footnote 12 The respondents then were presented with the retirement-savings scenario, followed by some detailed hypothetical information about the plan (discussed in the next section). Respondents then were asked the following questions about their hypothetical, anticipated participation behavior based on the plan information provided:Footnote 13
1) Would you enroll in the plan?
2) How confident are you in your enrollment decision?
3) What percentage of your salary would you contribute to the plan (or stick with the default)?
4) How would you plan on investing your contribution (stick with the default allocation or choose your own allocation)?
5) What percentages of your contribution would you invest in stocks versus bonds?
We then elicited self-reported information about the actual retirement-planning experience of respondents. This information includes: (i) the age they plan to retire; (ii) whether and what type of plan is offered by their current employer; (iii) whether they participate in their current employer's sponsored plan if one is offered; and (iv) how much they currently are saving for retirement.
3.2 Manipulation of the presentation of the plan
The goal of the experimental scenario was to provide plan information that reasonably approximated both the content and the detail that employees might actually receive.Footnote 14 Respondents were given information relating to the following broad categories: overview of the plan, the enrollment process, investment options, level of employer matching, vesting, distributions from the plan, tax benefits, and a general disclaimer about risks and other things to consider. The main manipulation consisted of two conditions: (i) long version (Long) and (ii) short version (Short). A full copy of each of these versions and the information that was provided about the plan is presented in the Supplemental Appendix.
In the Long version, the plan information for each of the categories was written out in full paragraph form (roughly a paragraph for each category). In total, the plan description in the Long version contained 894 words, 5,343 total characters, and was two pages. Alternatively, in the Short version, the information was presented in a much simpler and concise way; respondents were given a table highlighting the key information for each category of plan information. Importantly, the plan description in the Short version contained 331 words, 1,989 total characters, and was less than one standard page. Moreover, in the Short version, respondents were also presented with some key information in the form of useful guidelines that had suggested actions, which were intended to ‘help with their enrollment and contribution decisions’. Importantly, these statements were also provided in the Long version, albeit buried within the written-out text. The following questions and answers were provided in the Short version:
Question: Should you enroll? Answer: Yes, it is generally regarded as a good idea to contribute to an employer-sponsored, 401(k) plan when there is matching.
Question: How much should you invest? Answer: In order to take full advantage of the employer match, you should contribute 4%, but a general rule of thumb is that you should be saving at least 10% of your income toward retirement.
Question: How should you invest your contributions? Answer: A general rule of thumb is that the percentage invested in bonds should equal your age.
3.3 Sample selection of full-time new employees
To ensure that the sample of respondents was representative of the type of person that likely would make retirement-planning decisions, the following inclusion criteria were imposed: (i) current employment, (ii) started their job within the last year, and (iii) annual income over $50,000. The ex-post questionnaire revealed that approximately 87% of respondents reported that their employer offered a retirement savings plan, and 73% of all respondents reported that they participated in their employer's plan (i.e., 83% of the 87% who reported a plan was offered).Footnote 15 Participants were recruited through Qualtrics Panels, which is a survey-recruitment platform that draws from a diverse, national pool of registered users. In this regard, we view this sample as being generally more representative than other possible types of samples (e.g., a regional sample, a firm-specific sample, or a student sample). After completing the survey, the participants were compensated directly by Qualtrics. In total, the sample consists of 600 respondents. Data were collected in the fall of 2017, and the average time to complete the survey was just over 6 minutes.Footnote 16
4. Results
Table 1 shows descriptive statistics for the socioeconomic variables for the entire sample of 600 new employees, and separately for the Short condition (N = 302) and the Long condition (N = 298). Importantly, there are no significant differences across the two conditions (at the 5% level), which is expected given randomization to condition; thus, differences in the measured anticipated choices can be attributed causally to exposure to the experimental condition. One important thing to note is that a very high percentage, 90%, said they anticipated enrolling in the hypothetical 401(k) plan.Footnote 17 While this is higher than the unconditional average empirical enrollment rates in such plans, it is not much higher than the empirical averages reported for comparable individuals with relatively high levels of education and annual income levels over $50,000 per year – 78–85% (Brady and Bass, Reference Brady and Bass2019).
Table 1. Descriptive statistics by condition (new employee sample)

Respondents were allowed to choose any combination of these race and ethnicity categories. No respondents had income of less than $50,000 by survey design. $50,001–$60,000 is the omitted income category in the regressions.
4.1 Enrollment
The first decision for participants was actively choosing whether they anticipate: (1) enrolling in the 401(k) plan, (2) not enrolling in the 401(k) plan, or (3) waiting to enroll at a later time. From Table 2 we see that 88% of respondents who received the Short version selected choice (1) that they would enroll in the plan, while 92% of those who received the Long version selected choice (1) that they would enroll. They are marginally statistically different (χ 2 test: p = 0.084). However, the marginal effects of a probit model presented in the first column of Table 3 show that, after controlling for personal characteristics and other possible explanatory variables, there is no significant difference in the probability of anticipated enrollment in the 401(k) plan across the Short and Long conditions.Footnote 18
Table 2. Comparison of enrollment behavior across conditions (new employee sample)
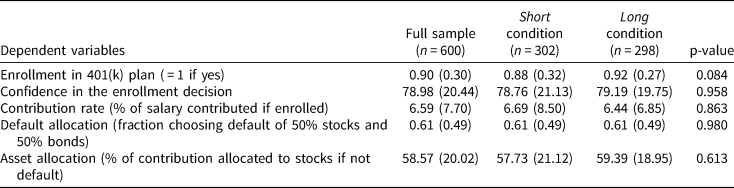
Table 3. Estimated marginal effects on enrollment behavior (new employee sample)
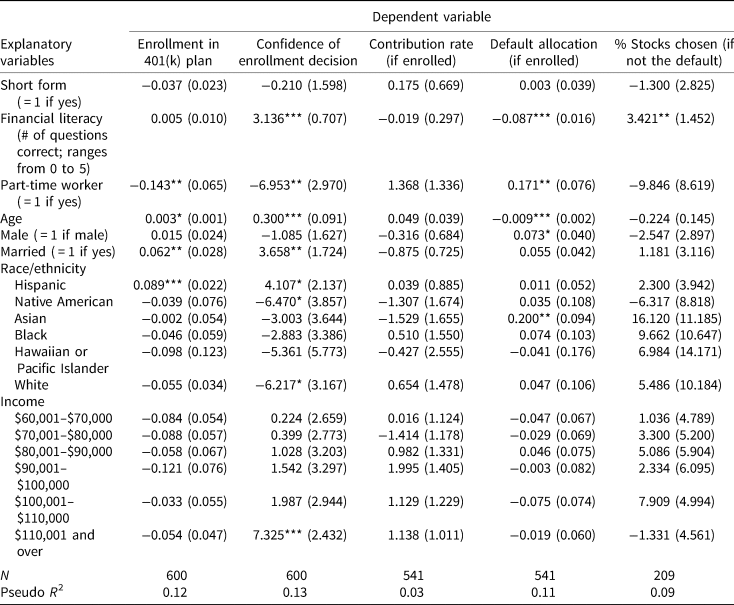
Column 1 reports the marginal effects of a probit regression of the choice to enroll (enroll = 1) in the plan. Column 2 reports the results of an OLS regression of confidence in enrollment decision (measured on a scale from 0 to 100). Column 3 reports the result of an OLS regression of the contribution rate (as a percentage of annual salary) conditional on enrollment = 1. Column 4 reports the marginal effect of a probit regression of the binary choice of staying with the default asset allocation conditional on enrollment = 1. Column 5 presents the results of an OLS regression of the % of contribution allocated toward stocks if the default is not chosen (measured from 0 to 100). In all models, the constant term is included but not shown and standard errors are in parentheses. No respondents had income of less than $50,000 by survey design. $50,001–$60,000 is the omitted income category in the regressions. ***Significance at the 1% level, **significance at the 5% level, *significance at the 10% level.
Respondents who were part-time workers in real life had a 0.14 lower probability of anticipated enrollment, even though the hypothetical job was not part-time. Such workers are less likely to enroll in real life and this is affecting their choices in the hypothetical situation as well. Older respondents also are more likely to choose to enroll in the hypothetical plan as they would in real life. This is also true for married respondents. Thus, real-life choices seem to be affecting choices in the hypothetical situation.
As a follow-up to their enrollment decision, we also asked participants to rate their confidence in their decision (0% = not at all confident to 100% = completely confident). We wanted to allow for the possibility that the plan information manipulation could impact their confidence. Specifically, the Short form with the salient guidelines might reduce their uncertainty and, hence, make them more confident. From Table 2 we see that participants were, on average, quite confident in their enrollment decision: 78.7% in the Short condition and 79.2% in the Long condition. This difference is not statistically significant. The regression specification in column 2 of Table 3 confirms no significant effect of the Short condition on the reported confidence. Overall, providing brief information and recommendations via the short description of the plan had little impact on respondents' hypothetical enrollment in the 401(k) plan or their confidence in this decision.Footnote 19
Examining the other controls, financial literacy – measured as the number of questions answered correctly on the five questions presented in Footnote 12 – is positively related to confidence; getting an additional question correct translates into over a 3-percentage-point increase in confidence. We also see that part-time workers had lower confidence than full-time workers by almost 7 percentage points, while age and married also were positively related to confidence in the enrollment decision.
4.2 Contribution rate
Those respondents who said that they would enroll in the hypothetical plan were then asked what percentage of their salary they anticipated they would contribute. The two options were to: (i) stick with the default contribution level or (ii) write in their desired contribution percentage. The plan information stated that the default contribution level was 4%, the maximum amount that would be fully matched by the employer. It also included a statement that it is a general rule-of-thumb to save 10% of your salary toward retirement.
Table 2 shows that the average anticipated contribution rate was 6.7% in the Short condition and 6.4% in the Long condition. These are not significantly different (t-test: p = 0.655). Column 3 of Table 3 shows the estimated coefficients from an OLS regression of the percentage of earnings contributed to the plan on an indicator for the Short condition and other control variables.Footnote 20 The indicator for receiving the Short condition is insignificant. These results confirm that receiving the Short version did not affect how much people who would enroll would contribute. We also performed some additional analyses on the specific contribution levels that were chosen: (i) the percentage of respondents who stuck with the default 4% contribution level, or (ii) the suggested 10% level. Those results show that 68% of respondents in the Short condition and 69% in the Long condition contributed at the 4% level, while only 7.8% of enrollees in the Short condition and 6.5% in the Long condition contributed at the 10% level. Neither of these differences is statistically significantly different; moreover, we also find no statistically significant differences in the entire distribution of contribution levels across conditions. Overall, providing plan information in the shorter, more concise manner, including a highlighted 10% rule-of-thumb suggestion, seems to have had little impact on the amount contributed. Financial literacy did not appear to have any association with anticipated contribution rates.
4.3 Asset allocation
Conditional on choosing to enroll, respondents were asked how they would allocate their contributions between stocks and bonds. Specifically, they had the following two options: (i) stick with the default allocation (50% stocks and 50% bonds), or (ii) write in the percentages they would allocate toward stocks and bonds (with the total between the two being required to sum to 100%).Footnote 21
Table 2 shows that, of those choosing to enroll, 61% chose the default. Of the remaining 39% who didn't choose the default, the average percentage allocated to stocks was 57.7% in the Short condition and 59.3% in the Long condition. These are not statistically different from each other (t-test: p = 0.548). Furthermore, there are also no statistically significant differences in the distribution of % allocated to stocks across distributions. Lastly, we examine the data concerning the recommendation provided in the Short version that the percentage invested in bonds should be equal to a person's age. We find that virtually none of the respondents followed this recommendation (only five respondents from each condition), and there was no statistically significant difference in this proportion across the Short and Long conditions.
Column 4 of Table 3 shows the marginal effects of a probit model of choosing the default allocation, if enrolled; the Short version condition has no meaningful effect on choosing the default. Column 5 of Table 3 shows the results of an OLS regression of the percent stock allocation, if enrolled and not choosing the default. Again, the Short condition has no effect on the anticipated percentage of funds allocated to stocks. However, higher financial literacy is negatively related to the likelihood of choosing the default, as well as positively related to the percentage allocated to stocks, as we might expect. Part-time and younger workers were more likely to choose the default, as expected. Surprisingly, given their greater confidence on average in real life, males were marginally more likely to choose the default in the hypothetical example. None of these employment and demographic variables affected the anticipated percentage of stocks chosen. Overall, providing the specific recommendations described here seems to have had little impact on the percentages of contributions allocated to stocks and bonds.
5 Replication using two alternative samples
After documenting that making the plan information more concise had little effect on the anticipated decisions of a Qualtrics panel of recently employed adults across the United States, concerns arose about the possibility that respondents' prior enrollment choices acted as an anchor for their behavior in the survey; these prior choices could have then crowded-out the influence of the manipulation of the presentation of the plan information. To mitigate this potential issue and to draw more robust conclusions about the possible impact on enrollment behavior of the way plan information is presented, we replicated the choice experiment using two additional samples. The first was a different Quatrics panel of job seekers, who reported they were not employed full-time but were either currently looking or planned to be looking for full-time employment – referred to as the seeking-employment sample. The second additional sample was business-school students – we refer to this sample as the student sample. The motivation for these additional samples was to capture populations that: (i) presumably were less likely to have been enrolled in an employer-sponsored retirement plan, and (ii) would likely be faced with the opportunity to participate in such an employer-sponsored plan in the near future. Thus, these samples represent the population of soon-to-be, full-time employees who will be making retirement-saving decisions regarding employer-sponsored 401(k) plans.
5.1 Results from seeking employment Qualtrics Panel
Participants were again recruited through Qualtrics Panels. Except for the different inclusion criteria, all other procedural parts of the study were the same. In total, the sample consists of 420 respondents (split between the two conditions: n = 215 for Long version and n = 205 for Short version). Data were collected in spring 2019, and respondents spent roughly 7 minutes, on average, completing the survey. Importantly, only 14% of the sample reported they were currently saving for retirement via an employer-sponsored plan. In terms of age, this sample ranges from 18 to 80 years old with a mean and median of 38.5 and 37 years old, respectively; thus, a diverse set of ages are represented. Table 4 shows the aggregate descriptive statistics for the seeking-employment sample. Importantly, across all the measured socioeconomic characteristics, there is only one significant difference – part-time worker – across the Short and Long conditions within this sample of job seekers; thus, there is sufficient balance across conditions that our randomization into condition appears to be effective.
Table 4. Descriptive statistics by condition (seeking-employment sample)
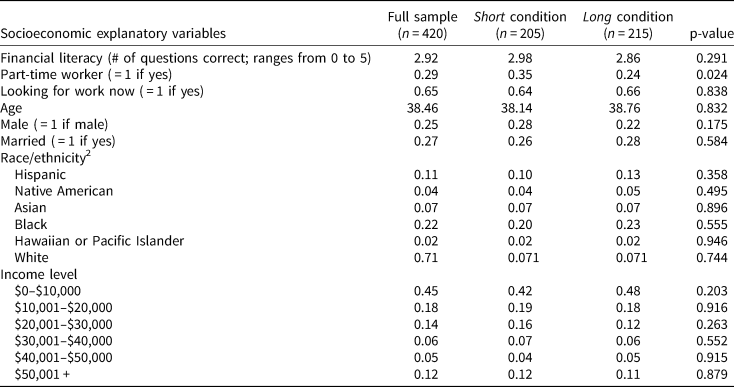
Respondents were allowed to choose any combination of these race and ethnicity categories.
We again examine the five main planning choices of interest: enrollment in 401(k) plan, confidence in the enrollment decision, contribution rate, choice of default allocation, and choice of asset allocation if not the default. Table 5 compares the averages of these five variables across the Short and Long conditions.Footnote 22 Importantly, as with the employed sample, we find little difference in anticipated behaviors across the Short and Long conditions for the seeking-employment sample. Namely, Table 5 reveals that there are no significant differences at the 5% level in any of the five choice variables across the two conditions. Table 6 replicates the regression analysis from Table 3 using only the seeking-employment sample and, consistent with the unconditional means, reveals that the indicator for Short condition is not significant at the 5% level for any of the five models pertaining to the five planning measures. Moreover, we again do not observe any significant differences across conditions in terms of behavior consistent with the specific recommendations – contribution rates of 4% or 10%, or allocation of bonds equal to age. Overall, the data from the full-time job seekers reveal very little impact of receiving the Short form on anticipated retirement-plan choices. However, financial literacy is positively associated with anticipated enrollment and confidence in that decision, and negatively associated with the likelihood of choosing the default, as expected. Older respondents are again more confident and less likely to choose the default. Age is also positively correlated with planned contributions such that older respondents have a marginally higher anticipated contribution rate.
Table 5. Comparison of enrollment behavior across conditions (seeking-employment sample)

Table 6. Estimated marginal effects on enrollment behavior (seeking-employment sample)

Column 1 reports the marginal effects of a probit regression of the choice to enroll (enroll = 1) in the plan. Column 2 reports the results of an OLS regression of confidence in enrollment decision (measured on a scale from 0 to 100). Column 3 reports the result of an OLS regression of the contribution rate (as a percentage of annual salary) conditional on enrollment = 1. Column 4 reports the marginal effect of a probit regression of the binary choice of staying with the default asset allocation conditional on enrollment = 1. Column 5 presents the results of an OLS regression of the % of contribution allocated toward stocks if the default is not chosen (measured from 0 to 100). In all models, the constant term is included but not shown and standard errors are in parentheses. The omitted income category in the regressions is $20,000+.
***Significance at the 1% level, **significance at the 5% level, *significance at the 10% level.
5.2 Results from the student sample
Students composing this sample were enrolled in the Rawls College of Business at Texas Tech University.Footnote 23 In total, 233 participants from this student database completed the survey. Data were collected in fall 2017, and respondents spent roughly 6 minutes on average completing the survey. Importantly, this sample of students is much different from the Qualtrics panel of new employees that we analyzed first. In particular, only 21% (compared to 34%) reported that they currently save for retirement. Moreover, only 19% (compared to 55%) reported that their current employer offers a retirement-savings plan (401(k) or equivalent) and only 6% (compared to 42%) of the total sample actually participates in an employer-sponsored plan in real life. Table 7 shows the descriptive statistics for the sample of students. There are, again, no statistically significant differences in any of these measures (at the 10% level) across conditions, indicating acceptable randomization.
Table 7. Descriptive statistics by condition (student sample)

* Respondents were allowed to choose any combination of these race and ethnicity categories.
Table 8 presents descriptive statistics for the same five planning choices. Importantly, the results from the student sample are generally consistent with the results from the two Qualtrics panels. In particular, we see no significant differences in any of the five outcome variables between the Short and Long conditions. Table 9 shows the effect of being in the Short condition on each of these five dependent variables while controlling for other possible explanatory variables. Consistent with the results from comparisons of the unconditional means reported in Table 8, there are no statistically significant effects of being in the Short condition on anticipated: enrollment, confidence in the enrollment decision, contribution rate, or self-selected asset-allocation; there is a marginally statistically significant positive effect on choosing the default. Consistent with the prior two samples, we also do not find any significant differences in the propensity to follow the recommendations – 4% or 10% contribution level, and % allocated to bonds equal to age. Lastly, greater financial literacy is positively correlated with greater confidence, a greater percentage of stocks chosen, and an increased contribution rate.
Table 8. Comparison of enrollment behavior across conditions (student sample)

Table 9. Estimated marginal effects on enrollment behavior (student sample)

Column 1 reports the marginal effects of a probit regression of the choice to enroll (enroll = 1) in the plan. Column 2 reports the results of an OLS regression of confidence in enrollment decision (measured on a scale from 0 to 100). Column 3 reports the result of an OLS regression of the contribution rate (as a percentage of annual salary) conditional on enrollment = 1. Column 4 reports the marginal effect of a probit regression of the binary choice of staying with the default asset allocation conditional on enrollment = 1. Column 5 presents the results of an OLS regression of the % of contribution allocated toward stocks if the default is not chosen (measured from 0 to 100). In all models, the constant term is included but not shown and standard errors are in parentheses.
***Significance at the 1% level, **significance at the 5% level, *significance at the 10% level.
Overall, the fact that we see little impact of the Short version on anticipated behavior in a diverse sample of newly hired employees with salaries over $50 K (who presumably have experience with retirement planning), a diverse sample of those seeking employment, and a sample of business students (who presumably have no experience with retirement planning), provides a more robust conclusion about the plausibly limited impact of simplified plan information on anticipated enrollment behavior.
6 Evaluation of plan information
Based on the results reported, we provide robust evidence that the Short form manipulation of the presentation of the hypothetical 401(k) plan had little impact on anticipated planning behavior. We collected additional data to gain further insights into possible differences in how the two plan-information presentations were perceived. We solicited responses from an additional sample of 196 business school students from the same database that comprised the student sample. Of these, 100 were presented the Short version and 96 were presented with the Long version. Up through viewing the plan information, the procedure for this sample was identical to the previous samples. Directly after viewing the plan information (but unbeknownst at the time of viewing the plan info), we collected several additional measures related to their comprehension of the plan features, as well as their subjective perceptions regarding the presentation of the plan information. Data were collected in fall 2019, and respondents spent roughly 7 minutes on average completing the survey.
To measure comprehension of the specific plan information, we asked respondents six multiple choice questions testing their knowledge of the plan features that were prominently presented in the plan description. The six questions were the following:
1) How many days do you have to enroll in the plan?
2) Up to what % of your salary will the employer match?
3) What is the general rule of thumb for what percentage you should be contributing?
4) What is the general rule of thumb about what percentage of your portfolio be invested in bonds?
5) If you choose to enroll, but don't make a contribution decision, what happens?
6) If you enroll, but don't make any investment decisions, what happens?
The idea with these questions was to get an objective measure of how presentation of the plan information impacts respondent's knowledge regarding the important plan features. To measure subjective perceptions, we asked five additional Likert-scale questions. These questions related to how easy the plan information was to understand, how easy it was to find the information, how comprehensive the information was, how confident they were in making decisions, and whether the information could have been presented in a more simplified manner. Lastly, we also collected data on how long respondents spent viewing the plan information screen.Footnote 24
Regarding the objective comprehension of the plan, the average number of correctly answered questions (out of a total of 6) was 3.59 for the Long version and 3.57 for the Short version; these are not significantly different from each other. Thus, across both conditions, respondents appeared to accumulate a similar level of knowledge about the plan. In terms of subjective perceptions, the only reported difference was that respondents who viewed the Long version were more likely to agree with the statement ‘the plan information could have been presented in a more simplified way’ compared to respondents viewing the Short version (p = 0.010). There were no differences in perceptions about ease of understanding the plan, ease of finding information about the plan, how comprehensive the plan information was, or how confident they would be making decisions based on the information.
Lastly, we measured how long each participant spent viewing the plan description. Respondents spent, on average, 56 seconds viewing the Short version and nearly three times that long – 152 seconds – viewing the Long version, which is significantly different (p = 0.017).Footnote 25 Taken together, these data suggest that respondents in our study spent less time viewing the Short version and perceived it to have been presented in a more simplified manner, compared to the Long version. Yet, they were able to glean a similar level of information from both plan descriptions and, hence, make similar decisions about anticipated retirement-saving behavior.
7. Conclusion
This paper describes the results of a choice experiment using three distinct samples: a Qualtrics Panel of new employees, a Qualtrics Panel of full-time job seekers, and business-school students. Participants in all three samples were provided with either a long or short description of a hypothetical 401(k) plan, and then asked questions about anticipated retirement-savings behavior. The main hypothesis was that providing abbreviated, concise information with clear recommendations would alter anticipated plan-participation choices. However, controlling for demographic and other factors, this hypothesis was not supported by the data. Namely, we found negligible differences between those who received the long description and those who received the short description in the following self-reported, anticipated outcomes: enrollment rates, contribution levels, and asset allocations. Importantly, this pattern holds in each of the three distinct populations surveyed. To the extent that increased plan participation, increased contribution rates, and asset allocations are more in line with general rules of thumb, which might lead to more desirable outcomes, our results suggest that simplifying the presentation of plan information to employees might not result in improved retirement-planning choices.
Additional data collection revealed that respondents did spend significantly less time viewing the simplified plan description. However, respondents demonstrated a similar (objectively measured) degree of comprehension of the plan information across both conditions. Moreover, they (subjectively) perceived the plan descriptions in a similar way, with the exception that respondents rated the short description as being more simplified. This supports the idea that the long description was, indeed, more complex so they spent more time viewing it; but the long description didn't result in inferior knowledge of the plan and, as a result, did not significantly impact their anticipated retirement-planning decisions.
Overall, the data do not support the idea that presenting 401(k) plan information in a simpler, more compact way (without limiting their choices, as previous studies have done), will alter employees' retirement-planning choices. On the one hand, our study casts some doubt on the potential effectiveness of implementing policies that would mandate concise and more accessible information disclosures about optional, employee-sponsored retirement plans as a means of improving retirement-planning outcomes. On the other hand, when we view these findings through a broader lens where new employees might be time constrained, our results could have a more positive interpretation. That is, reducing the complexity of retirement-planning information might result in qualitatively similar planning outcomes, while enabling employees to focus more time on other tasks (e.g., satisfying other new-hire demands). One potential caveat is that we didn't make the plan information simple enough. This is a valid criticism, but we would also argue that there are certainly bounds as to how simplified you can present information while still providing employees with the requisite amount of information they need to make an informed decision, and also satisfy any mandatory information disclosure obligations. Swinging the pendulum the other way, it is also possible that the long version of the plan information was not long enough to adequately represent real-life plan information. However, given time and feasibility constraints in implementing the experimental study, it was not practical to make the long version much longer. Notwithstanding the differences in the plan description length, the short description also featured guidelines that were displayed in a prominent manner. Overall, what we consider to be a substantially more streamlined plan description with a more salient recommendation did not impact anticipated retirement planning choices in our study.
More generally, our results suggest that subtle or passive manipulations – like changing the way information is presented – are unlikely to result in large behavior changes related to retirement planning. In light of some of the prior literature (e.g., Clark et al., Reference Clark, Maki and Morrill2014; Dolls et al., Reference Dolls, Doerrenberg, Peichl and Stichnoth2018; Goldin et al., Reference Goldin, Homonoff, Patterson and Skimmyhorn2020) pointing toward the effectiveness of reinforcing plan information through follow-up correspondence (flyer, letter, email), our results would indicate that the formulation of the content in these messages is of less importance; rather, what's important is that they actually get these messages.Footnote 26 Our results seem to also reinforce prior findings that stronger policies – like defaulting opt-in (e.g., Madrian and Shea, Reference Madrian and Shea2001; Choi et al., Reference Choi, Laibson, Madrian, Metrick and Wise2004), changing the defaults (e.g., Carroll et al., Reference Carroll, Choi, Laibson, Madrian and Metrick2009; Beshears et al., Reference Beshears, Choi, Laibson and Madrian2013) or creating ‘smart’ defaults (e.g., Thaler and Benartzi, Reference Thaler and Benartzi2004; Camilleri et al., Reference Camilleri, Cam and Hoffmann2019) – are likely to be the most effective way to induce behavioral changes (see Hummel and Maedche, Reference Hummel and Maedche2019 for further discussion on the effectiveness of defaults). Moreover, we did find that financial literacy was positively associated with better choices across all three main samples.Footnote 27 This suggests that increasing financial literacy – possibly through educational programs (as suggested, among others, by Agnew and Szykman, Reference Agnew and Szykman2005; Clark et al., Reference Clark, d'Ambrosio, McDermed and Sawant2006; Tang et al., Reference Tang, Mitchell, Mottola and Utkus2010; Lusardi and Mitchell, Reference Lusardi and Mitchell2014; Jappelli and Padula, Reference Jappelli and Padula2015) – would improve retirement-planning decisions and outcomes. Given that so many people choose the default options, it may be most useful to focus on designing defaults in such a way as to improve individuals' retirement planning outcomes.Footnote 28
Supplementary material
The supplementary material for this article can be found at https://doi.org/10.1017/S1474747221000445


 Open access