


Introduction
Human pressure on nature is growing, resulting in unprecedented rates of biodiversity loss and natural landscape degradation (Laurance et al. Reference Laurance, Sayer and Cassman2014, Pimm et al. Reference Pimm, Jenkins, Abell, Brooks, Gittleman and Joppa2014). At present, the species extinction rate outpaces the historical background rate by a thousand times (Barnosky et al. Reference Barnosky, Matzke, Tomiya, Wogan, Swartz and Quental2011). One of the principal approaches to preserve natural places has been the declaration of protected areas (PAs), which represent a key strategy to address some of the global environmental challenges. PAs not only play a key role in mitigating threats related to human activity (Rodrigues et al. Reference Rodrigues, Akçakaya, Andelman, Bakarr, Boitani and Brooks2004, Rodríguez-Rodríguez et al. Reference Rodríguez-Rodríguez, Sebastiao, Salvo Tierra and Martínez-Vega2019), but they also sustain functional ecosystems and prevent or slow the loss of biodiversity (Joppa et al. Reference Joppa, Loarie and Pimm2008, UNEP-WCMC et al. 2018). Several studies have underlined the importance of PAs for mitigating the adverse effects of human development (Watson et al. Reference Watson, Dudley, Segan and Hockings2014) and climate change (Hannah et al. Reference Hannah, Midgley, Lovejoy, Bond, Bush and Lovett2002a, Reference Hannah, Midgley and Millar2002b, Gaüzère et al. Reference Gaüzère, Jiguet and Devictor2016, Lehikoinen et al. Reference Lehikoinen, Santangeli, Jaatinen, Rajasärkkä and Lehikoinen2019) on biodiversity.
Due to socioeconomic and/or legal constraints, networks of PAs are usually the consequence of unplanned selection strategies that often generate spatially fixed and unconnected reserve designs (Pressey Reference Pressey1994, Joppa & Pfaff Reference Joppa and Pfaff2009). However, nature is dynamic, and the static character of PAs seriously hinders their capacity to allow the persistence of biodiversity and the maintenance of the ecological processes for which these PAs were declared (Burns et al. Reference Burns, Johnston and Schmitz2003, Araújo et al. Reference Araújo, Cabeza, Thuiller, Hannah and Williams2004). This is particularly true for climate (Monzón et al. Reference Monzón, Moyer-Horner and Palamar2011) and land-cover changes (Hansen & Defries Reference Hansen and Defries2007). The ability of static PAs to conserve biodiversity is often questioned because, although they mitigate the negative effects within their boundaries, they are often extremely pressured on their borders. This frequently leaves PAs as conservation islands (Hole et al. Reference Hole, Willis, Pain, Fishpool, Butchart and Collingham2009, Wilson et al. Reference Wilson, Sleeter and Davis2015) that may hamper the movement of species towards other areas with suitable climatic conditions, especially when the surroundings of PAs are human-dominated (Wessely et al. Reference Wessely, Hülber, Gattringer, Kuttner, Moser and Rabitsch2017). In essence, as climate shifts, PAs may tend to lose the particular climatic conditions represented in them and, as a result, may lose populations or even species associated with the particular set of conditions existing in them. Conversely, the environmental conditions formerly represented in a PA can appear in other locations outside this protected territory. All of these areas harbouring in the future the general environmental conditions currently hosted by a PA can be considered ‘recipient areas’ able to support individuals coming from the PA (sensu Mingarro & Lobo Reference Mingarro and Lobo2018). The ‘real’ distribution of species under changing environmental conditions is difficult to predict because of the complexity of the factors that affecting it (Warren et al. Reference Warren, Hill, Thomas, Asher, Fox and Huntley2001, Lobo Reference Lobo2016). Alternatively, the representative environmental regions of each PA can be located under present and future scenarios (Mingarro & Lobo Reference Mingarro and Lobo2018) as a means of increasing the probability of preserving the ecosystem functions and biodiversity represented by PAs (Stralberg et al. Reference Stralberg, Carroll and Nielsen2020). Present representative and future recipient areas may thus be important from a conservation point of view because their protection could facilitate the safeguarding of the environmental conditions under which each PA was declared.
The identification of corridors and the connection between environmentally and biodiversity-important areas is a topic that is recognized as fundamental for the management of biodiversity and environmental resources in the face of climate change (Heller & Zavaleta Reference Heller and Zavaleta2009, Carroll et al. Reference Carroll, Lawler, Roberts and Hamann2015, Choe et al. Reference Choe, Thorne, Hijmans, Kim, Kwon and Seo2017, Littlefield et al. Reference Littlefield, McRae, Michalak, Lawler and Carroll2017, Reference Littlefield, Krosby, Michalak and Lawler2019, Lawler et al. Reference Lawler, Rinnan, Michalak, Withey, Randels and Possingham2020, Parks et al. Reference Parks, Carroll, Dobrowski and Allred2020). The capacity of present representative and future recipient areas to act as refuges for the organisms inhabiting a PA will depend on the availability of corridors allowing their connectivity. Thus, it is vital not only to locate where these climatically representative areas would appear in the future, but also to estimate where the corridors are that would connect these PAs with their future recipient areas (Alagador et al. Reference Alagador, Triviño, Cerdeira, Brás, Cabeza and Araújo2012). We believe that performing these two tasks is essential to improving the sustainability of the biodiversity that PAs seek to safeguard and preserve. In this study, by considering several climatic variables, we delimit the current representative and the future recipient areas for all of the mainland Iberian national parks (INPs) to subsequently delimit the corridors that are able to connect these parks with their representative and recipient areas. Thus, the main aims of this study are: (1) to estimate the location and extent of the present and future climatically representative areas for all of these INPs; (2) to describe the current land cover and conservation status of these areas; and (3) to delimit a network of corridors to connect these representative (present) and recipient (future) areas with their respective parks. Through all of these tasks, we hope to offer some guidelines to improve the future sustainability of the Iberian PAs.
Methods
Study area
Geographically isolated in south-western Europe (latitude 36–44°, longitude 10° and 5°), the Iberian Peninsula covers an area of c. 580 000 km2 at the western limit of the Palaearctic region, a crossroads between Africa and Europe, and influenced both by the North Atlantic Ocean and by the Mediterranean Sea. These characteristics, together with an orography defined by large mountain ranges, mostly west–east orientated and with elevation gradients spanning 3000 m, have a strong influence on the climate. Thus, the Iberian Peninsula harbours a wide range of climates, including desert, Mediterranean, Alpine and Atlantic. Furthermore, the Iberian Peninsula encompasses two main biogeographical regions: the Mediterranean and Atlantic, with a longitudinal gradient of precipitation and a latitudinal gradient of precipitation and temperature (Rivas-Martínez Reference Rivas-Martínez2005). It is also one of the European regions with the greatest diversity of ecosystems, habitats and biodiversity (Ramos et al. Reference Ramos, Lobo and Esteban2001), where the mountain geography has favoured the occurrence of isolated endemic species.
The INP protection status is among the most restrictive concerning land management according to Spanish legislation. There are ten INPs (Fig. 1(a)); nine belong to Spain (Aigüestortes i Estany de Sant Maurici, Ordesa y Monte Perdido, Cabañeros, Monfragüe, Sierra Nevada, Doñana, Sierra de Guadarrama, Tablas de Daimiel, Picos de Europa) and one to Portugal (Peneda-Gerês). The total INP area is 3982.5 km2 (0.68% of the Iberian Peninsula; Table 1), of which the Sierra Nevada is the biggest (859 km2) and Tablas de Daimiel is the smallest (30 km2). In terms of elevational representativeness, only two of these INPs (Table 1) are below the mean elevation of the Iberian Peninsula (1229.46 m above sea level); most of the INPs are in high and mountainous areas, as indicated by their mean elevation and elevational range (Table 1).

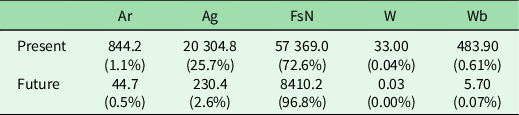
Fig. 1. (a) Iberian areas with similar climatic conditions at present to those in at least two Iberian national parks (INPs; in black). (b) Recipient areas (areas that, in the future, will harbour the climatic conditions currently represented by the INPs) for at least two INPs (core areas, in black). The contours of all of the INPs are shown (white polygons), named in order from north to south OM (Ordesa y Monte Perdido), AE (Aigüestortes i Estany de Sant Maurici), PE (Picos de Europa), PG (Peneda-Geres), SG (Sierra de Guadarrama), M (Monfragüe), C (Cabañeros), TD (Tablas de Daimiel), SN (Sierra Nevada) and D (Doñana). The main Iberian mountain ranges are also shown: P (Pyrenees), L-C (Leon-Cantabric), D-U (Demanda-Urbión), I (Iberian Central System), G (Gredos), T (Montes de Toledo) and B (Baetics). The following principal valley systems are mentioned in the text: E (Ebro), D (Duero), J (Júcar) and G (Guadalquivir).
Table 1. Main geophysical characteristics of the Iberian national parks and Euclidean distances, in kilometres, between each Iberian national park and the Iberian areas that, in the present and future, harbour the climatic conditions currently represented by them. When an Iberian national park loses its climate representativeness in the future, it will not have recipient areas, being represented as D. The acronyms of the Iberian national parks are those of Figure 1. Percentages are based on the total area of the Iberian peninsula (583 113 km2).

A = area in km2; D = disappear; E = mean elevation (in metres above sea level); ER = elevation range (in metres); Max = maximum distance; Mean = mean distance; Min = minimum distance.
Current and future INP climatic representativeness
We used the monthly average values of maximum daily temperatures, minimum daily temperatures and total accumulated rainfall during each month, at 1 km2 resolution, from 1950 to 2007 (see Felicísimo et al. Reference Felicísimo, Muñoz, Villalba and Mateo2011). The data of these three variables and the equations provided by Valencia-Barrera et al. (Reference Valencia-Barrera, Comtois and Fernández-González2002), López Fernández and López (Reference López Fernández and López2008) and Hijmans et al. (Reference Hijmans, Cameron, Parra, Jones and Jarvis2005) allowed us to build 23 bioclimatic variables. Briefly, we submitted all of these variables to a principal component analysis (PCA) that generates three non-correlated factors with eigenvalues higher than unity, representing 93.5% of all the climatic variability in the Iberian Peninsula (see Mingarro & Lobo Reference Mingarro and Lobo2018 for details). Considering each one of these three factors, we selected the original variable with the highest factor loading in order to use variables with clear interpretability. Furthermore, the original variables that were poorly represented by the three selected PCA factors were also included (see Mingarro & Lobo Reference Mingarro and Lobo2018). This process enabled the final selection of five climatic variables with little or no correlation to each other: precipitation during the wettest month; annual average temperature; thermal contrast; isothermality; and average monthly maximum temperature.
Iberian future climatic data are from the WorldClim database (Hijmans et al. Reference Hijmans, Cameron, Parra, Jones and Jarvis2005) with a 0.86 km2 resolution at the equator. The data provide two different temporal scenarios (2050 and 2070) and we chose six different global climate models (GCMs): BCC-CSM1-1 (Xin et al. Reference Xin, Wu and Zhang2013), CCSM4 (Gent et al. Reference Gent, Danabasoglu, Donner, Holland, Hunke and Jayne2011), GISS-E2-R (Nazarenko et al. Reference Nazarenko, Schmidt, Miller, Tausnev, Kelley and Ruedy2015), HadGEM2-ES (Jones et al. Reference Jones, Hughes, Bellouin, Hardiman, Jones and Knight2011), IPSL-CM5A-LR (Dufresne et al. Reference Dufresne, Foujols, Denvil, Caubel, Marti and Aumont2013) and MRI-CGCM3 (Yukimoto et al. Reference Yukimoto, Adachi, Hosaka, Sakami, Yoshimura and Hirabara2012). As the data of the two temporal scenarios offer very similar results (see Supplementary Figs S1–S4, available online), we chose to average them. Thus, we averaged the values of the three previously mentioned primary climatic variables (mean monthly values of maximum daily temperatures, mean monthly values of minimum daily temperatures and monthly precipitation) considering these 12 datasets (2 temporal scenarios × 6 climatic models) to offer a general picture of the future climate. We assume that the recipient areas identified using these averaged data could be important in the future, regardless of the scenario or time window and despite uncertainties in climate models. We used the derived climatic data to estimate the same five climatic variables selected in the case of the current climate (precipitation of the wettest month, annual average temperature, thermal contrast, isothermality and average monthly maximum temperature).
All of the considered future climatic simulations were generated in the fifth evaluation report (AR5) according to two scenarios of representative concentration routes. The Representative Concentration Pathway (RCP) 4.5 scenario represents a population stabilization scenario, with stable or decreasing future greenhouse gas emissions that are associated with increased carbon stocks in forests and a decrease of agricultural land (van Vuuren et al. Reference van Vuuren, Edmonds, Kainuma, Riahi, Thomson and Hibbard2011). In contrast, in the RCP 8.5 scenario, high human population growth rate is expected, with constant emissions and both population and anthropogenic land cover increases (Hurtt et al. Reference Hurtt, Chini, Frolking, Betts, Feddema and Fischer2011, van Vuuren et al. Reference van Vuuren, Edmonds, Kainuma, Riahi, Thomson and Hibbard2011). Climatic variables were thus calculated independently for each one of these two RCP scenarios.
We delimited representative (present) and recipient (future) climatic areas for each INP following a previously published methodology (Mingarro & Lobo Reference Mingarro and Lobo2018). The values of the five selected climatic variables were used to estimate the Mahalanobis distance (MD) between the conditions in the 1 km2 cells of each INP and the cells of the whole Iberian Peninsula. MD was chosen to measure climate similarity because this multidimensional measure takes into account the correlations of the variables and it is scale-invariant regardless of the units used for each variable (Farber & Kadmon Reference Farber and Kadmon2003, Xiang et al. Reference Xiang, Nie and Zhang2008). The 95th percentile of the MD values obtained in the cells located inside each INP was chosen as the decision threshold to delimit the areas with a climate similar to the one experienced in each INP (hereafter referred as climatically representative areas). In order to facilitate the design of corridors (see below), we reduced the selected MD threshold to the 80th percentile in the case of the climatically heterogeneous Sierra Nevada National Park to diminish its wide climatically representative area. We added together climatically representative areas belonging to all of the INPs in order to capture the extent and location of the Iberian areas now harbouring climatic conditions similar to those experienced in the INPs. When these climatically representative areas are shared by at least two INPs, they will be denominated as ‘core areas’.
We used a similar procedure to delimit the recipient areas that in the future will harbour the climatic conditions currently represented by each INP. In this case, the same five climatic variables were used to calculate the MD between the current conditions in the 1-km2 cells of each INP and all of the Iberian cells according to the two future RCP climatic scenarios. Once identified and mapped, we overlaid the future recipient areas according to the RCP 4.5 and RCP 8.5 scenarios to generate a unique representation of the probable location of recipient areas (Figs S1–S4 show the locations of recipient areas for each climatic scenario). Afterwards, the derived recipient areas were overlapped with the land-cover data coming from the CORINE Land Cover project (2018 data at level 1; see www.eea.europa.eu) to delimit those areas representing in the future the climate of INPs that in turn have a forest or semi-natural land cover. Similarly, we overlapped the obtained recipient areas with the Iberian PAs included in the Protected Planet database (www.protectedplanet.net) in order to identify their current conservation status.
Creating a corridor network
For each INP, we created an ecological corridor network by connecting its location and the location of its representative and recipient areas, as described above. We used the Linkage Mapper ArcGIS tool for this purpose (McRae & Kavanagh Reference McRae and Kavanagh2011), which is based on a cost–distance methodology considering a resistance surface. Resistance surfaces represent the relative cost, or permeability, of passing through a gridded mapped surface and can be used to calculate cost-weighted distance away from different patches (Villalba et al. Reference Villalba, Gulinck, Verbeylen, Matthysen, Dover and Bunce1998, Zeller et al. Reference Zeller, McGarigal and Whiteley2012). On the one hand, we used a raster file representing the MD between the current conditions in the 1-km2 cells of each INP and the present conditions of all of the Iberian 1-km2 cells. Moreover, we used another raster file representing the MD between the current conditions in the 1-km2 cells of each INP and the future conditions of all of the Iberian 1-km2 cells. These two raster files acted as a resistance surface, thus enabling the creation of corridors. We used cost–distance models because they are computationally efficient (Adriaensen et al. Reference Adriaensen, Chardona, De Blust, Swinnen, Villalba, Gulinck and Matthysena2003) and allow us to determine routes with the least cost-weighted distance among the selected patches. The cost value is the cumulative resistance found when moving along the optimal route from one place to another through the resistance surface (Adriaensen et al. Reference Adriaensen, Chardona, De Blust, Swinnen, Villalba, Gulinck and Matthysena2003, McRae et al. Reference McRae, Hall, Beier and Theobald2012). We chose a cost-weighted distance value of 10 000 as a threshold to obtain ecological corridors that are more limited in their extent (see McRae et al. Reference McRae, Hall, Beier and Theobald2012).
Once the corridor network was established for each INP, we added all the corridors together, in accordance with the considered climatic scenarios, to obtain a whole corridor network for all of the INPs. In addition, these results are shown, disaggregated by scenario and by period time, in the Supplementary Material (Figs S4–S8). When two or more corridors overlapped in a 1-km2 cell, we selected the minimum cost value. To reduce the computational time, we discarded all of the representative areas with an area smaller than the smallest INP (Tablas de Daimiel with 30 km2); however, due to the comparatively small extent of recipient areas, this area limitation was not used. This methodology allowed us to create an ecological corridor network in which all INPs were connected with their corresponding representative and recipient areas.
We used the CORINE Land Cover database of 2018 to identify the possible barriers to the connectivity of INPs with the future recipient areas by overlaying this corridor network with the current anthropogenic land uses. Two kinds of barriers were differentiated depending on the anthropogenic use of the land: artificial barriers and agricultural barriers. The first is regarded as a land use that acts as a barrier in which return to a natural status is unlikely. Agricultural barriers, on the other hand, are considered a land use that might become natural.
Results
Climatic representativeness
The current climatic representativeness of the INPs covers 13.6% (c. 79 050 km2) of the total area of the Iberian Peninsula. Most of the Iberian mountainous regions are included within this climatically representative area (Fig. 1(a)); the mean elevation of these areas is 1220 m, with an elevation range of 2199 m. Five areas climatically represent at least two INPs (core areas): the Pyrenees, the León-Cantabric Mountains, the Iberian Central System, nearby areas of the southern Iberian plateau and the Baetic Mountain Ranges (Fig. 1(a)).
Climatically representative areas will decline by 89% (c. 8691 km2) in the future. These future representative or recipient areas will be greatly reduced, both in area and number, or disappear in the south and central part of the Iberian Peninsula as well as in the Pyrenees (Fig. 1(b)). Thus, the main areas in the future are located in the Cantabrian and Leon mountains, the Gredos Mountains and the Demanda and Urbión Mountains. Importantly, the elevational range in these future climatically representative areas declines (1163 m), while the mean elevation increases notably (1770 m). At present, the distances between the outer border of the INPs and the continuous areas that represent their climate is always zero (Table 1), which means that all of the INPs have contiguous areas with a similar climate. However, in the future, many of the INPs will lose a large part of these climatically representative areas, and those remaining will appear in places far from the target INP. All of these representative areas increase their distances from INPs except in the case of the Ordesa y Monte Perdido National Park (Table 1).
Present climatically representative areas are almost three-quarters covered by forest and semi-natural areas and a quarter covered by agricultural areas (Table 2). However, future recipient areas are located in areas almost entirely covered by forest and semi-natural vegetation (Table 2). With regards to the protected status criteria, future recipient areas covered by forest and semi-natural vegetation that, at the same time, are included in any type of PA category represent 65% of the total (5481 km2), while c. 2929 km2 (35%) would not be covered by any PA category. The geographical distribution of these areas shows that the Cantabric Mountains at the north-western region, the Iberian Central System and the Urbión Mountains in the north-central region would be those harbouring the most important recipient areas that are currently protected.
Table 2. Areas of the different land-cover types (km2) for the climatically representative areas of all the Iberian national parks in the present and future. The percentages in parentheses are calculated based on the total representative area.
Ag = agricultural areas; Ar = artificial land cover; FsN = forest and semi-natural areas; W = wetlands; Wb = water bodies.
Corridor networks
The obtained corridor network allows all of the INPs to connect with one another, as well as to their corresponding climatically representative areas at present (Fig. 2(a)). The exception is the Doñana National Park, which remains isolated in the south-western Iberian Peninsula (see Fig. 1), and its representative areas are very close to the park itself. In total, the INP corridor network connecting present climatic representative areas covers almost 36% of the Iberian territory (Table 3). Interestingly, this corridor network connects most areas of the Iberian Peninsula except the south-western portion (Fig. 2(a)), and just over half of its area is currently under forest and semi-natural land-cover categories (without agricultural and artificial barriers; Table 3).
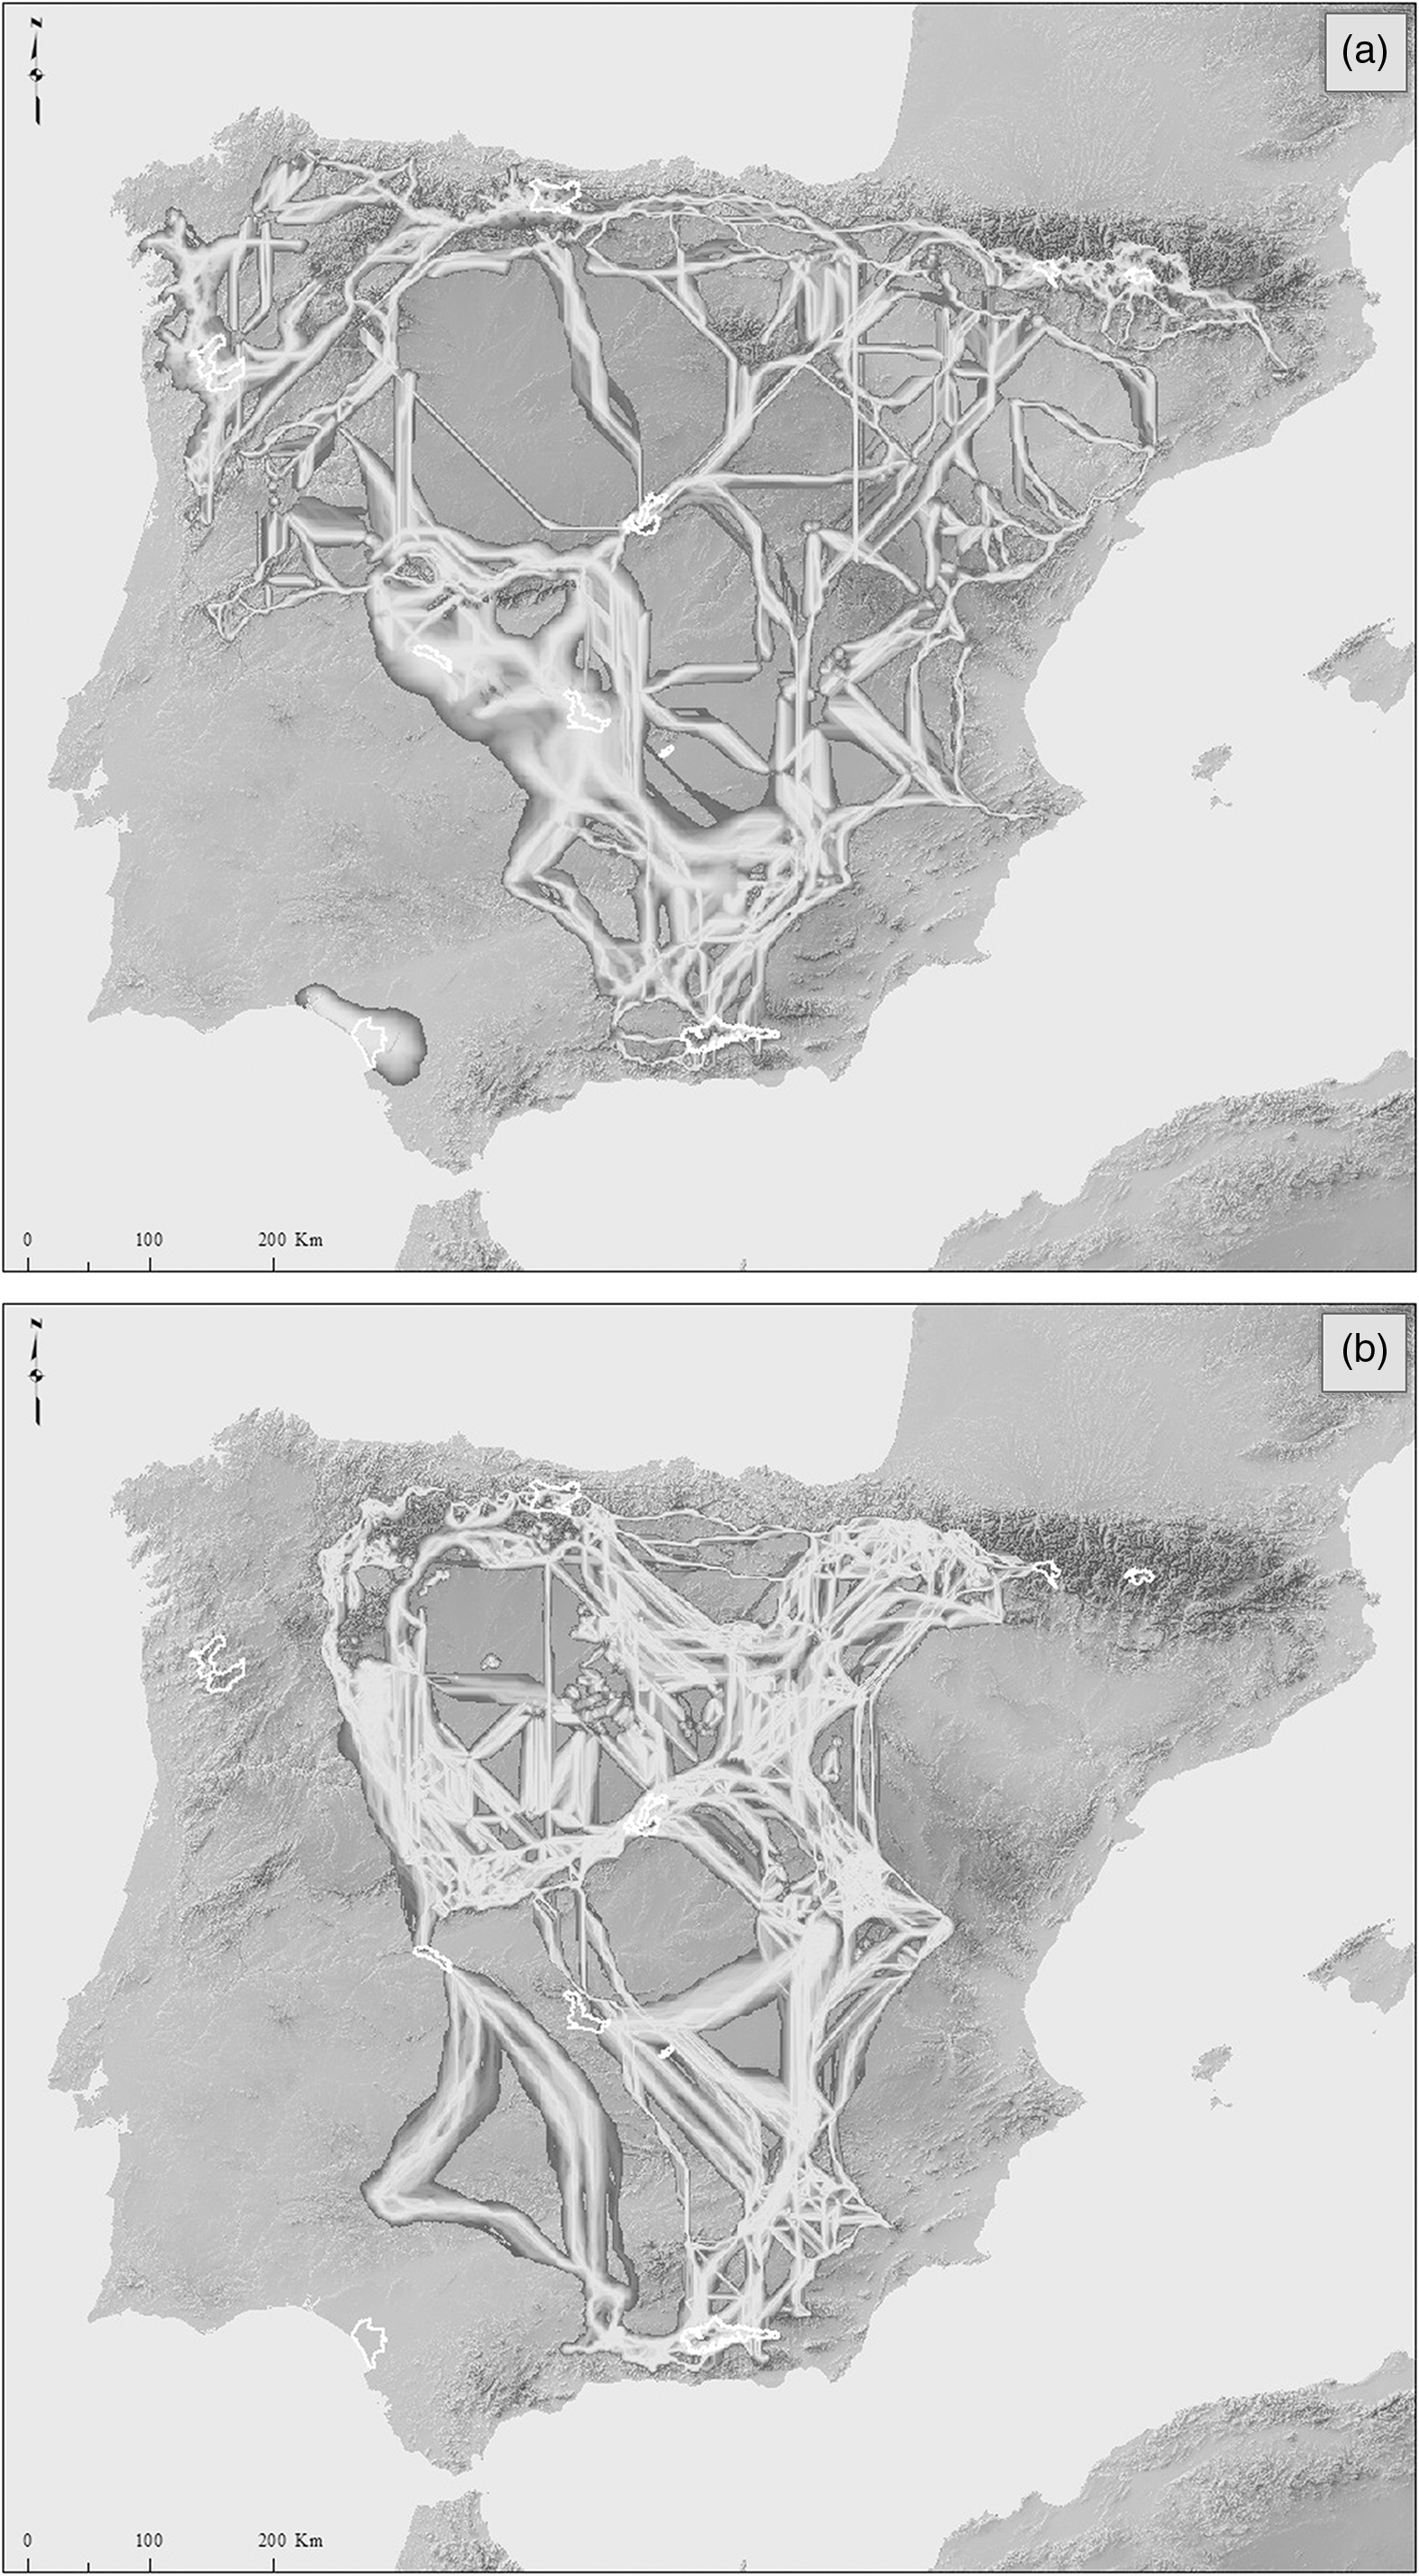
Fig. 2. Network of corridors climatically connecting Iberian national parks with (a) their present representative areas and (b) their future recipient areas. The light grey (low) to dark grey (high) colour gradient indicates cost-weighted distance values. A lower cost-weighted distance value implies a better aptitude for corridor development. Light grey pathways show the corridors with lower cost-weighted distance values.
Table 3. Basic statistics of the corridor network connecting Iberian national parks with their climatically representative areas at present and for the future (recipient areas).

A = total area (in km2); AA = total area without artificial barriers (km2 and percentage with respect to the total corridor network area); AAA = total area without artificial and agricultural barriers (km2 and percentage with respect to the total corridors network area); CW = mean of the cost-weighted distance of the total area; CWA = mean of the cost-weighted distance of the total area without artificial barriers; CWAA = mean of the cost-weighted distance of the total area without artificial or agricultural barriers.
The area of the corridor network decreases considerably when future recipient areas are considered (Fig. 2(b)). Three national parks (Doñana, Peneda-Gerês and Aiguestortes) will completely lose their climatically representative areas, and indeed, they are located far from the corridor network. The other two INPs (Picos de Europa and Tablas de Daimiel) will not have recipient areas in the future, but they could be connected with other PAs due to their proximity to the corridor network. The remaining five INPs will connect with each other and with their corresponding recipient areas (Fig. 2(b)). All corridors, which at present are spatially dispersed (Fig. 2(a)), could be summarized into four main corridors (Fig. 2(b)): (1) that connecting the Iberian Central System with the Sierra de Gredos to Leon and the Cantabrian mountains range; (2) that connecting the Iberian System with the occidental part of the Pyrenees; (3) that which joins the Baetic Mountains ranges with the Iberian System; and (4) that which allows the connection between the Baetic Mountain ranges and the Mediterranean national parks (Cabañeros and Monfragüe), located in the Toledo mountains (see Fig. 1(a)). Although the area of this corridor network decreases moderately in the future scenario, representing 32% of the Iberian area, half of this area is again currently covered by forest and semi-natural land uses (Table 3). Furthermore, the global cost-weighted distance mean is lower than in the network corridor connecting INPs at present with their climatically representative areas (Table 3).
The areas most conflicting and preventing of network connectivity with the future recipient areas can be discerned by examining the current extent of artificial and agricultural land uses within the corridor network. These main barriers to connectivity are located in the main Iberian basins (Fig. 3): Duero and Tajo (B1), Ebro (B2), Jucar (B3) and Guadalquivir (B4). These valleys, subject to substantial and ancient human impact, would seriously compromise the connectivity of INPs with the areas that in the future will harbour their current climatic conditions.

Fig. 3. Main areas preventing the connectivity between Iberian national parks and their future recipient areas: Duero and Tajo basins (B1), Ebro basin (B2), Jucar basin (B3) and Guadalquivir basin (B4). Each area is enlarged in its corresponding circle. Artificial (in red) and agricultural barriers (in yellow) and networks of corridors (light blue to dark blue) are shown.
Discussion
Although many approaches have been proposed to identify areas whose conservation would facilitate biodiversity persistence in the face of climate change (Lawler et al. Reference Lawler, Ackerly, Albano, Anderson, Dobrowski and Gill2015, Reference Lawler, Rinnan, Michalak, Withey, Randels and Possingham2020, Alagador et al. Reference Alagador, Cerdeira and Araújo2016, Jones et al. Reference Jones, Watson, Possingham and Klein2016), this study attempts to offer a different perspective. Our approach aims to promote the sustainability and conservation of PAs by considering their abiotic/climatic characteristics and the expected effects of climatic changes in altering the original environmental profile under which these PAs were established. We demonstrate here that the location and extent to which areas representing the climatic conditions of the Iberian national parks could in the future undergo a drastic transformation. The areas representing in the future the present climatic conditions of the INPs will be located c. 500 m higher in altitude and could have a total area nine times smaller than the areas representing the contemporary climate. Furthermore, half of the considered INPs will lack an equivalent climatic area on the Iberian Peninsula, and the climatically representative areas of the other half of the INPs will be situated 180–470 km away, often dissected by valleys greatly impacted by human activities. As a consequence, if the fundamental niche of the species is directly or indirectly determined by climatic variables, we could assume that many populations and species now inhabiting INPs will tend to disperse towards those areas in which these INP’s conditions will appear in the future (Heller & Zavaleta Reference Heller and Zavaleta2009, Mingarro & Lobo Reference Mingarro and Lobo2018). However, the responses of the organisms to changes in land use can vary and depend on their dispersal capacity (Newbold et al. Reference Newbold, Bentley, Hill, Edgar, Horton and Su2020). In general, the ability to adjust species’ geographical distribution in response to climate change decreases in organisms as human land uses increase in intensity (Williams & Newbold Reference Williams and Newbold2020). It is thus difficult, if not impossible, to understand how climate change will affect the future abundance and distribution of each one of the species inhabiting an INP. Each species may experience: (1) a decrease or even the disappearance of individuals and populations (Bestion et al. Reference Bestion, Teyssier, Richard, Clobert and Cote2015); (2) an increase in the evolutionary forces promoting in situ adaptation to new conditions (Hoffmann & Sgrò Reference Hoffmann and Sgrò2011); and (3) the dispersal of individuals towards new suitable territories (Mason et al. Reference Mason, Palmer, Fox, Gillings, Hill, Thomas and Oliver2015, ‘spatial adaptation’ according to Hengeveld Reference Hengeveld1997). We propose here to overcome this drawback by focusing on the characteristics of spaces and not on the probable response of the species (e.g., Sarkar et al. Reference Sarkar, Justus, Fuller, Kelley, Garson and Mayfield2005, Hortal et al. Reference Hortal, Araújo and Lobo2009), considering that an approach directed at improving the representation of the climatic variability can act as a surrogate to represent biodiversity.
Our results identify some important areas for maintaining the climatic representativeness of INPs in the future. These regions are located in the northern half of the Iberian Peninsula, but also in the Sierra Nevada or in its proximity. The Gredos, Demanda-Urbion, León and Cantabric mountain areas have emerged as key regions for the future maintenance of INP climatic characteristics. Unfortunately, some of these areas do not have the severe restriction of human uses as in the INPs. Our results also indicate that in addition to the disappearance of climatically representative areas in half of the INPs, those maintaining future recipient areas may not be close to the INP itself, thus entailing its isolation. Consequently, it is necessary to anticipate possible alterations in order to avoid the functional isolation of each INP and facilitate the flow from the INP to the suitable recipient areas through a corridor network. Enhancing the connectivity among important biodiversity areas was considered as one of the most important conservation biodiversity approaches for coping with climate changes (Heller & Zavaleta Reference Heller and Zavaleta2009). However, the benefit of connecting PAs may be limited if this fails to facilitate the interconnection between current PAs and their future recipient regions. Only in this way will it be possible for corridor networks to allow species to track their suitable climatic conditions, particularly in human-dominated landscapes such as those of the Iberian Peninsula. Hence, the successful development of the proposed corridor network not only requires the existence of natural or semi-natural habitats within it, but also discriminating the places where connectivity is prevented. Our results clearly show that current land uses in the Iberian Peninsula severely obstruct the corridor network connecting INPs and recipient areas. Thus, if we aim to promote the connectivity between these environmentally important areas, it is necessary to make an effort to restore the locations that can facilitate this connectivity. At this point, the involvement of public authorities, managers and policymakers will be essential to bring this project to a successful end.
PA categories such as those in the Natura 2000 network could dovetail and develop an essential role (Mazaris et al. Reference Mazaris, Papanikolaou, Barbet-Massin, Kallimanis, Jiguet, Schmeller and Pantis2013, Nila et al. Reference Nila, Beierkuhnlein, Jaeschke, Hoffmann and Hossain2019), as they promote sustainable development together with traditional use and conservation (Popescu et al. Reference Popescu, Rozylowicz, Niculae, Cucu and Hartel2014, Jackson Reference Jackson2018). Conservation planners should focus on the possible transitions of agricultural land use, encouraging natural restoration in some ‘hurdle’ areas previously identified and agreed upon. In this study, we propose four main such areas where the land-use transition will determine the successful development of a corridor network capable of addressing the effects of climate change on INPs. Two of these areas are located close to the Sierra Nevada National Park, which has the widest representative climatic area. A third hurdle area would prevent the connection between the Gredos and Leon mountain ranges along the Duero valley in the north-western part of the Iberian Peninsula. The fourth hurdle would make it difficult to connect the Pyrenees Mountains with other places due to the extensive agricultural land use in the Ebro valley.
The bleak picture that emerges from these results is mitigated to some extent because most of the recipient areas now having forest and semi-natural land uses and more than half of their whole area having protected status. Furthermore, the potential corridor network is hardly affected by current human land uses (which decreased by 18%), although it will be necessary to perform land-cover simulations under different climate change scenarios in order to better identify how future land-use changes may affect the observed connectivity between INPs and recipient areas (Mingarro et al. Reference Mingarro, Aguilera and Lobo2020). It is important to highlight that the Iberian Peninsula is largely mountainous and that this characteristic seems to be decisive in mitigating the effects of climatic change on biodiversity loss (Littlefield et al. Reference Littlefield, Krosby, Michalak and Lawler2019), in a way that is comparable to that seen during Pleistocene times (Schmitt Reference Schmitt2007). Hence, keeping these mountain ranges connected is likely the most ambitious conservation strategy that can be pursued in the Iberian Peninsula (Saura et al. Reference Saura, Bertzky, Bastin, Battistella, Mandrici and Dubois2018, WWF 2018). Our results demonstrate the need for proactive measures that are able to improve the capacity of PAs to host biodiversity and facilitate the movement of species, including efforts for the proper functioning of climate corridors.
Our results are based on the study of the PAs categorized as national parks, and other configurations can emerge when other protection categories are included. However, the network of INPs was established with the intention of constituting a representative sample of the major Iberian natural systems (see https://www.miteco.gob.es/es/red-parques-nacionales/divulgacion). Our analysis provides a general overview, and performing specific analyses for each INP at a higher resolution would allow us to detect fine-grained recipient areas. This work does not focus purely on PA connectivity as other studies have done (Choe et al. Reference Choe, Thorne, Hijmans, Kim, Kwon and Seo2017, Littlefield et al. Reference Littlefield, McRae, Michalak, Lawler and Carroll2017, Reference Littlefield, Krosby, Michalak and Lawler2019, Lawler et al. Reference Lawler, Rinnan, Michalak, Withey, Randels and Possingham2020, Parks et al. Reference Parks, Carroll, Dobrowski and Allred2020). The methodology developed in the present study provides the ability to identify all climates, current and future, analogous to those within existing PAs, to subsequently identify candidate corridors to connect them. Furthermore, the focus on climates representative of those of PAs is novel in that it is not limited to considering only the connectivity of existing PAs. Here, we performed a basic connectivity network analysis covering a huge study area, and so it is important to identify more precisely where to focus conservation strategies (Margules & Pressey Reference Margules and Pressey2000). To improve this approach, a more exhaustive analysis could be carried out in which the connectivity between the recipient areas and the INPs is analysed in detail, attending to potential barriers and proposing different ecological corridor networks. Utilizing land-use simulations and later connecting the recipient areas with the INPs containing places where forest and semi-natural land use is maintained could become an ideal methodology to delimit where natural climatic corridors could be.
This study has identified some key areas that are going to fulfil a very relevant role in mitigating climate change effects and that lack the protection they deserve. On top of this, these areas currently have forest and semi-natural land uses, so we need to be ambitious with the protection status of these places. These results highlight an important step in the Iberian conservation strategies by indicating that connectivity could be an effective measure to adapt to the climate change threat faced in this region. Moreover, this work is well suited to the EU Biodiversity Strategy for 2030, which emphasizes that the protection and restoration of nature must be intensified. This will need to be done by improving and expanding the network of PAs and developing an ambitious EU Nature Restoration Plan, integrating ecological corridors as part of a true trans-European Nature Network. Therefore, the first steps to developing effective conservation strategies in the face of climate change could be the protection of those key places, but also the creation of a network of corridors capable of facilitating the species flow between national parks and their recipient areas, keeping the most demanding PA category effective against the effects of climate change.
Supplementary material
To view supplementary material for this article, please visit https://doi.org/10.1017/S037689292100014X.
Acknowledgements
This study has been developed despite the lack of scientific funding.
Financial support
This research received no specific grant from any funding agency, commercial or not-for-profit sectors. We acknowledge support of the publication fee by the CSIC Open Access Publication Support Initiative through its Unit of Information Resources for Research (URICI).
Conflict of interest
None.
Ethical standards
No human or animal subjects have been involved in this study.


 Open access