


Introduction
Snow cover contains various impurities from natural and anthropogenic sources. These impurities percolate into the soil, groundwater and surface water during snowmelt, significantly influencing their composition.
The ingress of chemical elements to snow cover is conditioned by the content of substances in atmospheric precipitations, gas absorption from the atmosphere, substance loss by evaporation, deposition of soluble substances from the atmosphere, the interaction of snow cover with vegetative ground cover, wind activity, the influence of microorganisms and animals, and economic activity (Reference IvanovIvanov 1987). Metals constitute a significant part of these impurities.
In this paper, we consider the metals content in snow cover in south Sakhalin, Sea of Okhotsk, and its regional distribution. The major task was to retrace the variation of the metals content in the snow cover with distance from its main sources (water surface of the sea and anthropogenic sources, i.e. the main traffic arteries, urban areas and agricultural fields).
Methodology
The chemical composition of snow cover has been analyzed in several studies (e.g. Reference Gray and MaleGray and Male, 1981; Reference Shah, Tanaka, Kuramoto and SuzukiShah and others 2008; Reference NovorotskayaNovorotskaya 2011; Reference WatanabeWatanabe and others 2011). In the majority of these, the total snow thickness is studied, not taking into account its stratification. In this study, we took samples from specific snow layers formed by specific snowfalls. This enabled us to detect the metals content for specific snow layers and to retrace the metals’ concentration along the territory of south Sakhalin for the specific layer.
Samples were taken from three sections in south Sakhalin (Fig. 1):
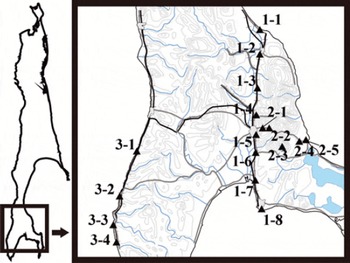
Fig. 1. Location map of sampling points in south Sakhalin island.
1. Eight sampling points in Susunajskaja lowland, from Starodubskoe village to the city of Korsakov.
2. Five sampling points across Susunajskiy ridge, from Lesnoe village to the city of Yuzhno-Sakhalinsk.
3. Four sampling points along the west coast, from Kalinino village to Shebunino village.
In sections 1 and 2, samples were taken from a snow layer formed by snowfall on 14–17 January 2011. The age of the layer at the time of sampling was 25 days (Fig. 2).
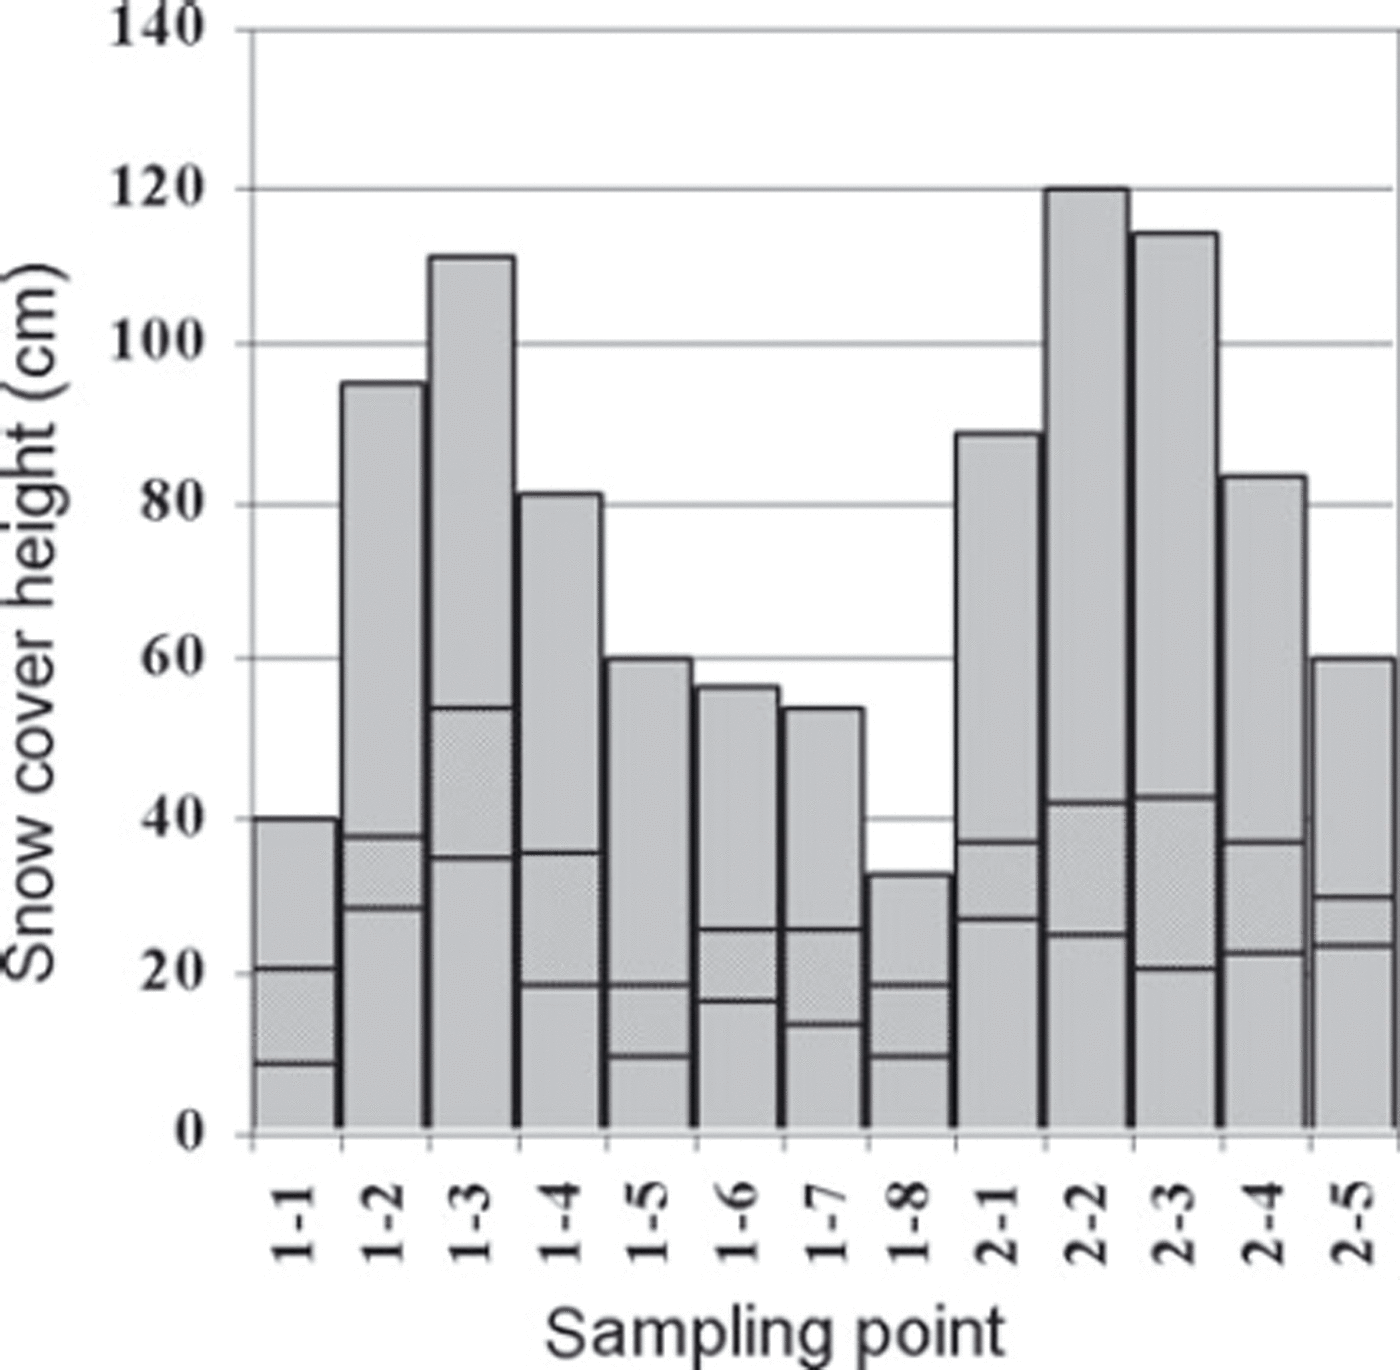
Fig. 2. Profile of snow layers from which samples were taken in sections 1 and 2. Shaded area is sampling layer. Age of layer is 25 days.
In section 3, samples were taken from the layer of new snow formed by the snowfall of 15 March 2011 (layer 1) and from the snow layer formed by the snowfall of 14–17 January 2011 (layer 2). The ages of the layers at the time of sampling were 1 and 60 days respectively (Fig. 3).
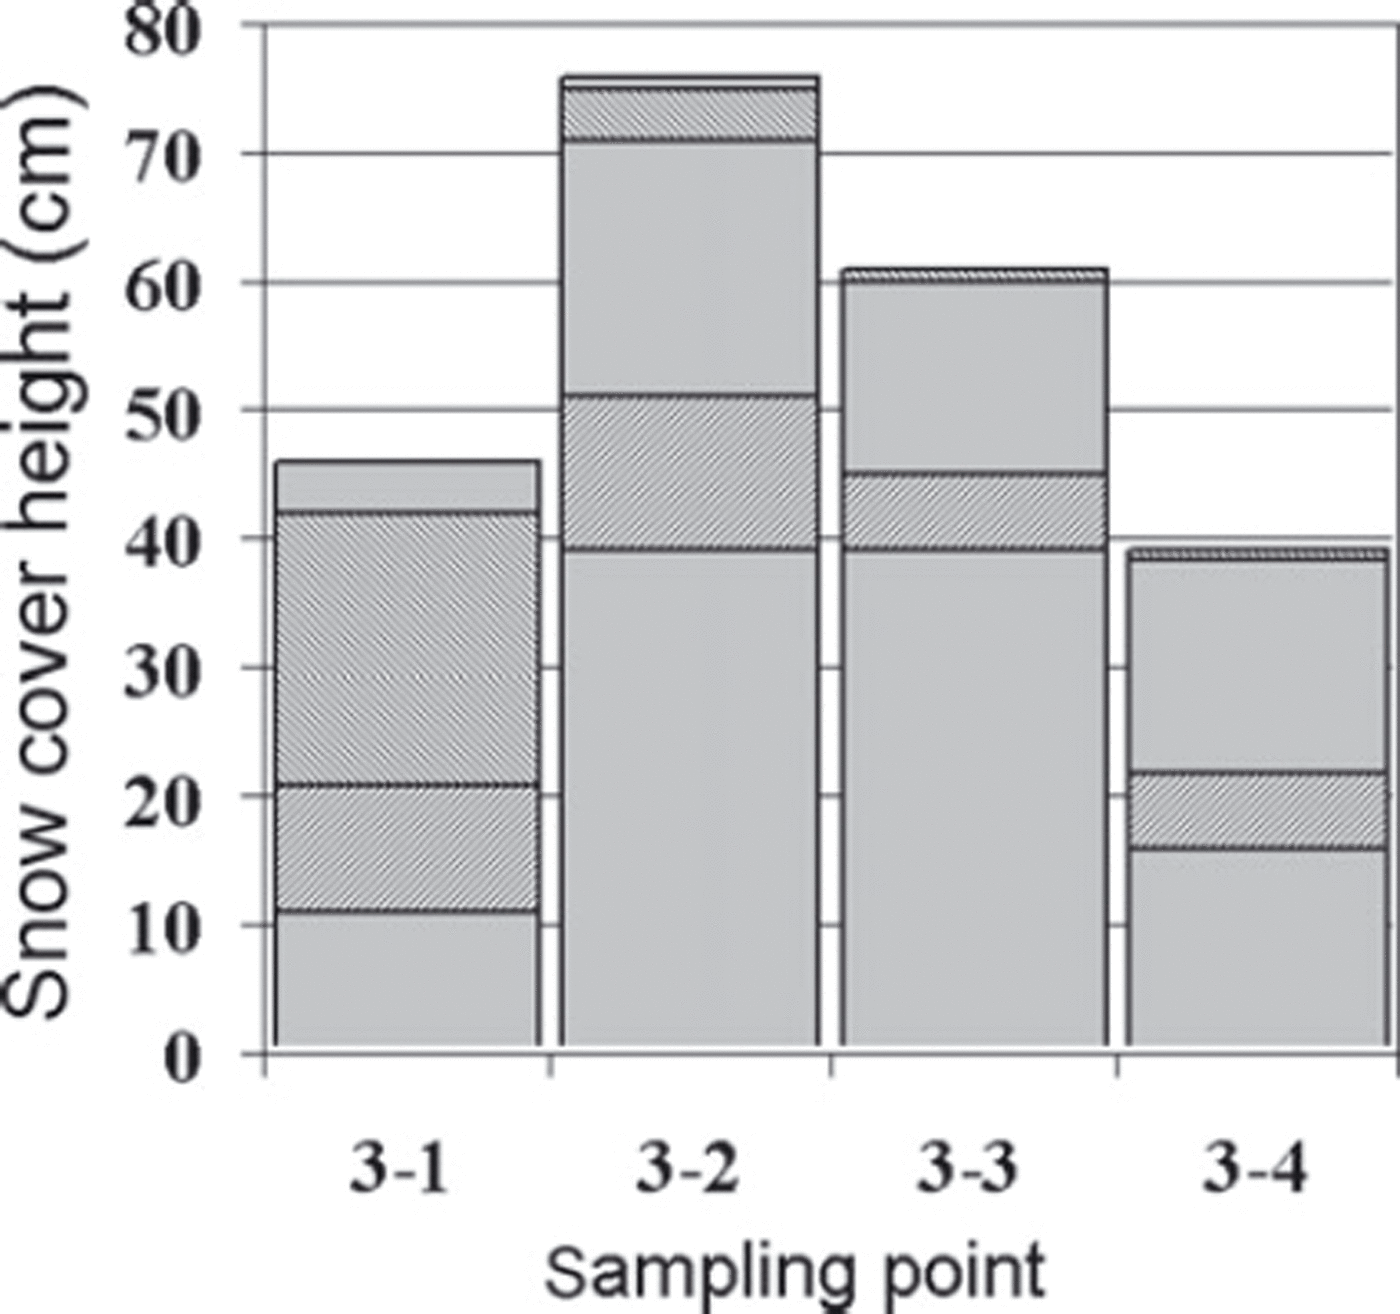
Fig. 3. Profile of snow layers from which samples were taken in section 3. Shaded areas are sampling layers, with layer 1 uppermost. Age of layer 1 is 1 day; age of layer 2 is 60 days.
Samples were taken by the Laboratory of Avalanche and Debris-flow Processes of the Sakhalin Department of FEGI FEB RAS in February–April 2011. Analysis of the samples was performed by the Laboratory of Analytical Chemistry of FEGI FEB RAS.
Meteorological Conditions
The formation of snow cover on south Sakhalin in winter 2010/11 took place in the first 10 days of December, which is, on average, 10–15 days later than the long-term average annual mean. The average height of snow cover during winter 2010/11 was ∼50 cm (according to data from south Sakhalin hydrometeorological stations). The average height of snow at the time of sampling was 70 cm in section 1 (8 February 2011) and 65cm in section 3 (16 March 2011). The total number of cyclones with >5mm precipitation in 24 hours on south Sakhalin in winter 2010/11 was 20, which is 30% fewer than the long-term average annual mean.
The reference direction of the wind in winter is north on south Sakhalin. An accumulation of aerosols of marine genesis in snow cover in the coastal zone of south Sakhalin is due to breeze from the sea.
Destruction of stable snow cover occurred within the long-term averages in the first 10 days of April.
Characteristics of Sampling Points
Sampling points were located in different landscapes and at different distances from the sea and anthropogenic facilities (the main traffic arteries, urban areas and agricultural fields). Sampling points 1-5, 1-6 and 2-1 to 2-4 were located under
a canopy of mixed forest. All sampling points except 2-1 and 2-2 were located <100m from roads; sampling points 1-8, 2-1 to 2-5, 3-3 and 3-4 were located near roads with very low traffic load.
The characteristics of each section were as follows:
1. All section 1 sampling points (1-1 to 1-8) were located on a sub-horizontal surface in Susunajskaja lowland (Table 1).
Table 1. Characteristics of sampling points in sections 1 and 2

2. Sampling points 2-1 to 2-3 were located in Susunajskiy ridge, sampling points 2-4 and 2-5 were located on the coast of the Sea of Okhotsk (Lesnoe village), and all section 2 sampling points except 2-1 were located on a sub-horizontal surface (Table 1).
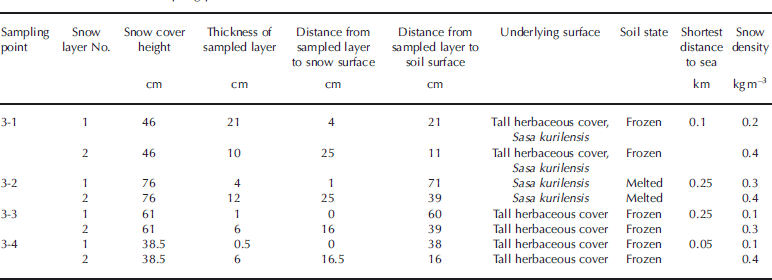
3. All section 3 sampling points (3-1 to 3-4) were located on a sea cliff with slope 35–458. Sampling points 3-1, 3-3 and 3-4 were of westerly aspect, and sampling point 3-2 was of southerly aspect (Table 2).
Table 2. Characteristics of sampling points in section 3
The underlying surface for all sample points was herbaceous vegetation.
Results
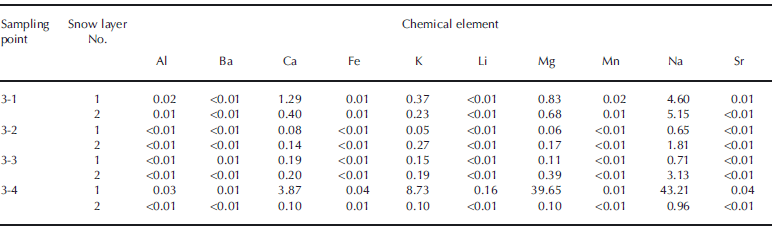
We determined the content of the following metals: Al, Ba, Ca, Cd, Co, Cr, Cu, Fe, K, Li, Mg, Mn, Na, Ni, Pb, Sr and Zn (Tables 3 and 4).
Table 3. Metals content in snow cover in sections 1 and 2
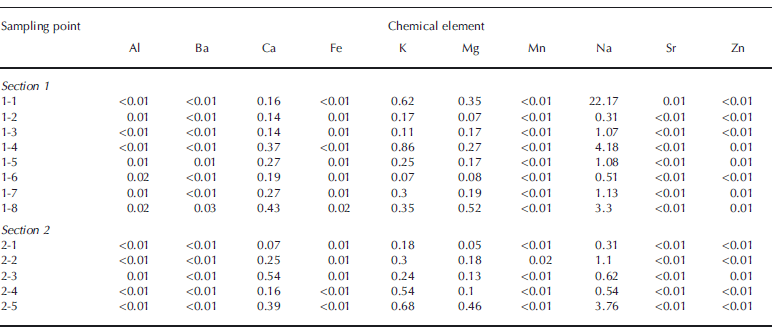
Table 4. Metals content in snow cover in section 3
The analysis was performed using inductively coupled plasma atomic emission spectrometry on the spectrometer iCAP 6500Duo (Thermo Scientific Corporation, USA) in the Laboratory of Analytical Chemistry, FEGI FEB RAS. The content of Cd, Co, Cr, Cu, Ni and Pb was lower than the sensitivity of the analyzer, i.e. <0.01mgL–1.
The metals content in south Sakhalin snow cover is very varied (Figs 4 –6). It is higher on the sea coasts and near settlements and agricultural fields. The two main sources of metals are the water surface of the sea and
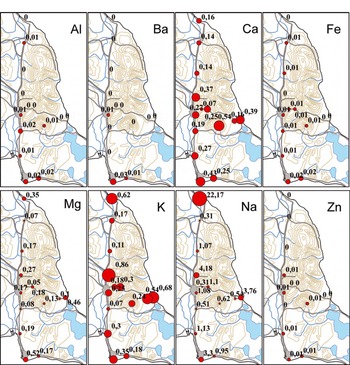
Fig. 4. Metals content (mgL–1) in snow cover in sections 1 and 2.
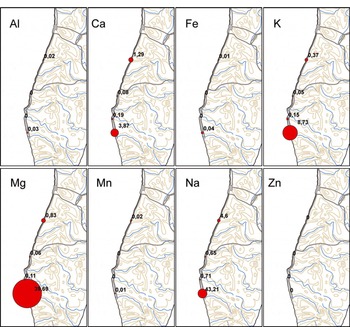
Fig. 5. Metals content (mgL–1) in snow cover in section 3, layer 1.
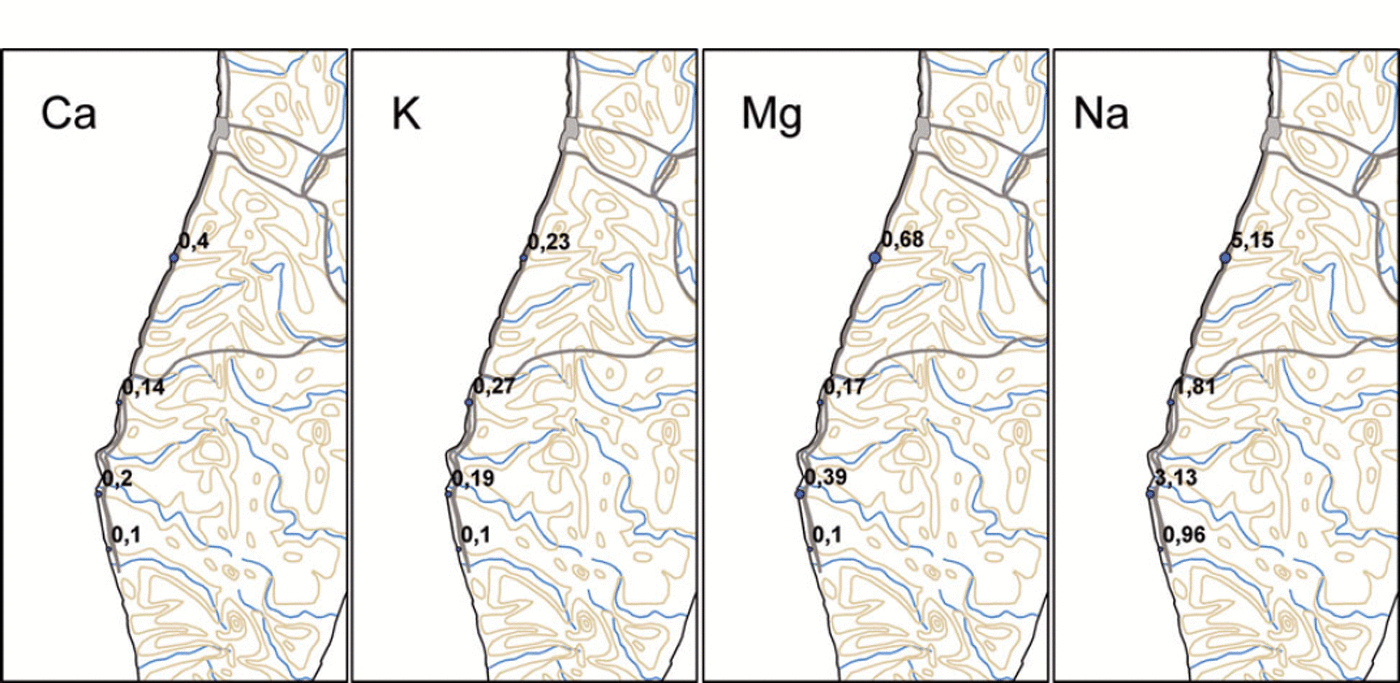
Fig. 6. Metals content (mgL–1) in snow cover in section 3, layer 2.
anthropogenic sources (the main traffic arteries, urban areas and agricultural fields).
Source of Metals in Snow Cover
Water surface of the sea
The major source of Ca, K, Mg and Na in snow cover of the sea coasts of south Sakhalin is aerosols of marine genesis.
Sampling points were located at different distances from the sea, causing considerable fluctuations of the content of Ca, K, Mg and Na in snow cover.
The content of Ca, K, Mg and Na is visibly higher for slopes with westerly aspect, i.e. rotated to the sea, and visibly lower in sample 3-2 (southwesterly aspect, sampling point located at an angle to the prevailing wind direction from the sea). High concentrations of Ca, K, Mg and Na were therefore detected at sampling point 3-4 in comparison with other sampling points.
At sampling points 1-1, 3-1 and 3-4, Sr was detected (0.01–0.04mgL–1). An aerosol of marine genesis is a source of the high concentration of Sr at these sampling points compared with other points.
Regularity of metals content in new and old snow was not detected in section 3, so the main factor that defines the concentration of aerosols of marine genesis in snow cover is wind direction during the period from snowfall forming a snow layer to the next snowfall.
Anthropogenic facility
Zn in concentrations of 0.01mgL–1 was detected at sampling points located on the outskirts of the city of Yuzhno-Sakhalinsk, the city of Korsakov and the village of Lesnoe and near the ‘Izvestkoviy’ quarry (sections 1 and 2).
High concentration of Al was detected at sampling points located near anthropogenic facilities (population centres, roads with high traffic load, ‘Izvestkoviy’ quarry) and in some sampling points located on the sea coast where transfer of sand from the beach by the wind was possible.
Fe content was higher at sampling points 1-8 and 3-4 than at other sampling points.
In addition, Ba was detected at five sampling points (in concentrations more than 0.01mgL–1).
Fe was detected at practically all sampling points (in concentrations of 0.01–0.04mgL–1).
K and Na contents were higher at sampling points located in the agricultural fields because of fertilizer usage.
A high concentration of Ca was detected at sampling point 2-3 due to wind transport of limestone dust from the ‘Izvestkoviy’ quarry.
However, sampling points located at <200m from roads (except sampling points 2-1 and 2-2) had concentrations of heavy metals such as Cd, Co, Cu, Ni and Pb that were lower than the sensitivity of the analyzer, i.e. <0.01mgL–1. An exception is Zn, whose concentration at sampling points located on the settlement outskirts was 0.01mgL–1.
Summary
Overall, the metals present in the highest concentrations are Na in sections 1 and 2 and Ca, K, Mg and Na in section 3, i.e. metals associated with aerosols of marine genesis.
Metals whose source is aerosols of marine genesis were detected along the whole of section 1 due to the prevailing northerly wind in winter.
Other metals have low concentrations at the level of total mineralization of surface water and groundwater of south Sakhalin.
The concentrations of metals in separate snow layers substantially depend on ingress of metals during the period from snowfall, forming a snow layer, to the time when this snow layer is overlapped by the next snowfall. Thus in general the major source of metals in snow cover is atmospheric aerosols.
Migration of metals from soil to snow cover is generally slight. An exception is snow cover on agricultural fields without vegetation, where the soil is oversaturated with fertilizers and tilled.
The metals content was higher at sampling points located under a forest canopy.
Thus, the main sources of metals in the snow cover of south Sakhalin are the water surface of the sea and anthropogenic sources (the main traffic arteries, urban areas and agricultural fields).
Acknowledgements
This research was made possible by the assistance of our colleagues from the Far East Geological Institute of the Far East Branch of the Russian Academy of Sciences: D.A. Bobrova, Y.V. Gensiorovskij, S.P. Zhiruev, N.A. Kazakov, I.A. Kononov, V.I. Okopnyj, S.V. Rybal’chenko, V.K. Stavnijchuk, G.A. Chelnokov and N.A. Kharitonova.


