


Introduction
Historically, scientists have utilized a countless variety of microscopes to qualitatively inspect their specimens of interest. Today, an increasing number of scientific applications, including volumetric cell analysis, surface profiling, and refractive index tomography, demand quantitative measurements during experimentation. When light interacts with a specimen of interest, such as biological tissue, two primary contrast mechanisms leave a footprint on the incident radiation. First, the specimen can attenuate the incident light due to absorption. Second, the specimen can deform an incident optical wavefront, thereby imprinting phase contrast. Resulting images thus carry information about both the spatially varying absorptive and phase-dependent properties of a given specimen. A key goal of many digital microscope users is to disentangle and extract quantitative information regarding absorption and phase, which can unveil key properties of cells, tissues, and other materials.
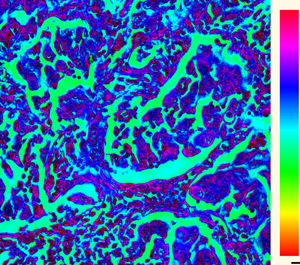
Due to the detrimental impact of optical scattering when imaging a thick specimen, it is generally beneficial to work with microscopically thin specimens during imaging experiments. As the cumulative absorption of light that occurs within a specimen decreases exponentially with a reduced thickness, many thin materials and organic compounds exhibit relatively low absorption of visible light. Accurate light absorption measurements of thin biological specimens, for example, is therefore often quite challenging. A common way to bypass this issue in biomedical imaging is to stain the specimen of interest with a chemical agent to enhance absorption contrast (see Figures 1a and 1b). While staining provides access to chemical information, it unfortunately alters the natural properties of the specimen and is rarely feasible for in vivo or in vitro studies.

Figure 1: Conventional light microscopes typically measure brightfield images (a) highlighting specimen absorption, here of a stained thin tissue section. (b) Darkfield illumination highlights phase-sensitive features but lacks quantitative information. Fourier ptychography improves the overall image quality by using FP amplitude to measure absorption contrast (c), and also recovers quantitative phase information (d), crucial for imaging of weakly absorbing samples such as cells.
An alternative method to assess properties of specimens such as living biological tissue is via quantitative phase imaging (QPI). QPI measures the deformation of a wavefront, or the phase shift, that is caused by the specimen's interaction with light. Accurate analysis of this phase shift enables quantification of specimen dry mass concentration, shape, and composition, for example. The history of phase-sensitive techniques is long, including Zernike phase contrast microscopy, Gabor inline holography, and Nomarski's differential interference contrast (DIC) microscopy, to list a few examples. While phase-sensitive, the above methods are typically not quantitative. For example, halo artifacts observed at phase discontinuities in Zernike's phase contrast microscopy can prevent direct phase quantification. Additional hardware components such as phase shifting elements or polarization optics are also required, which adds to cost, complexity, and calibration challenges, which is not ideal for non-experts.
Phase contrast microscopy underwent a conceptual shift toward data-driven approaches with the introduction of digital microscopy. Many QPI setups now capture and digitally process intensity images to convert measurements into quantitative phase estimates. Two early examples include phase-shifting digital holography and off-axis digital holography. These techniques leverage the growing capabilities of coherent light sources, digital sensor hardware, and modern computing architectures. However, digital holography techniques suffer from several shortcomings, including the introduction of speckle noise, requirements for interferometric stability, and at times a non-ideal utilization of the microscopes’ bandwidth. Several alternative methods are now available [Reference Park1].
Fourier Ptychography Measures the Quantitative Phase
Fourier ptychography (FP) [Reference Konda2,Reference Zheng3] is a relatively new member in the family of digital microscopy techniques with unique advantages over its analog and digital predecessors. These include generating images with improved spatial resolution, the ability to digitally calibrate and correct for aberrations and specimen misalignments, and, as most relevant to this article, measurement of amplitude and quantitative phase (Figures 1c and 1d). The first article in this three-part series provided the basics of FP [Reference Zhou4]. The focus of this second article is to shed light on how FP digitally extracts quantitative measurements of specimen phase via a process termed “phase retrieval.”
In short, FP is a synthetic aperture imaging technique that works within a standard microscope to computationally improve its imaging resolution. The only required hardware modification is a source of angularly varying illumination to shine light onto a specimen of interest from multiple unique angles. A common choice for this source is a light emitting diode (LED) array, although other options are available [Reference Konda2,Reference Zheng3]. We note here that standard digital image sensors are used in FP microscopes, which do not measure phase—only image intensity. Resolution enhancement is achieved computationally, by combining multiple digital images captured under unique illumination while jointly solving a “phase retrieval” problem (see details below). This process can result in a high-resolution map of both specimen absorption and phase, making FP a QPI method that offers the added benefit of improved image resolution (Figure 1).
The Importance of Phase
Before diving into details of phase retrieval, it is first helpful to highlight the importance of optical phase with a famous numerical experiment reported by Oppenheim [Reference Oppenheim and Lim5] (Figure 2). Suppose we measure the amplitude of two images in a FP experiment. For simplicity, the phase of the images is assumed to be uniform. Upon Fourier transformation, we obtain spectra (signals in the pupil plane of the optical system). These signals have two components, namely amplitude and phase. Suppose the phase information of the spectra are exchanged (that is, swapped), while the amplitude is left unchanged. This results in two new signals, which upon inverse Fourier transformation give two new images, whose spatial arrangement is mainly determined by the phase information of the other respective image, as illustrated in the right panel in Figure 2. This observation shows that phase information in the pupil plane plays an important role in the spatial formation and composition of an image.

Figure 2: In a simple experiment that highlights the importance of image phase two images, g1 and g2 (left), are first each Fourier transformed (F), resulting in signals that contain amplitude and phase. If the phases are exchanged (middle) and the results inverse Fourier transformed, the resulting spatial arrangement of the images appears to be primarily exchanged as well (right). We note that a Fourier transform mathematically describes the mapping of light at the sample (or image) plane into the pupil plane of a microscope. As described below, Fourier ptychography builds upon this principle by computationally estimating phase in the microscope pupil plane that is self-consistent with intensities measured in the image plane through iterative update and refinement. Adapted from [Reference Oppenheim and Lim5].
Phase Retrieval in Fourier Ptychography
As previously detailed [Reference Konda2] and diagrammed in Figure 3a, FP's name arises from a key Fourier transform relationship that describes how light propagates within a microscope. Specifically, when the optical field emanating from the surface of a sample propagates to a particular plane within the microscope (here termed the pupil plane), it undergoes a spatial Fourier transform. In other words, the physics of light propagation within the microscope performs a Fourier transform operation to form what is referred to as a “sample spectrum.” Accordingly, the simple example in Figure 2 highlights the importance of phase within the sample spectrum (that is, at the pupil plane), as it has a key role in describing how each image appears during an FP experiment.

Figure 3: Principle of FP phase retrieval. (a) A sample is illuminated from various angles, (b) effectively shifting the sample spectrum over the microscope's low numerical aperture lens to form (c) a series of uniquely illuminated images. Spectrum and sample/image fields are spatial Fourier transform pairs (denoted by F). (d–i) An iterative phase retrieval loop computationally fuses low-resolution images into a complex estimate of the sample spectrum, in essence forming a virtual lens with a vastly improved numerical aperture and a large field of view. In addition, the phase retrieval process yields phase information about the specimen, encoded by the color in panel (i).
As diagrammed in Figure 3a–3b, each image snapshot is associated with the sample spectrum shifted to a particular location in the pupil plane. However, since no phase information is directly obtained at the detector plane (Figure 3c), information measured there cannot simply be numerically back-propagated (that is, inverse Fourier transformed) to produce a complex-valued spectrum estimate. Instead, FP adopts an iterative approach. As with most iterative computational methods, FP first begins with a suitable initial sample spectrum guess. For example, one can combine a measured low-resolution brightfield image (Figure 3d) with a uniform (or random) phase map estimate and inverse Fourier transform the result to the pupil plane (Figure 3f) for initialization. Next, FP's phase retrieval algorithm aims to slowly modify this initial estimate such that its values accurately and consistently predict the measured intensities that were captured within the FP dataset (that is, the uniquely illuminated images).
The reader may intuitively think of phase retrieval as a sudoku puzzle [Reference Elser6]. We know the rules of the game, namely, every row, column, and box must contain each integer from 1 to 9. In addition, we have data, just as some of the entries in a sudoku puzzle are known. The rules of the game allow us to infer the missing entries, for instance, by testing candidate solutions and checking for consistency among neighboring rows, columns, and boxes. Phase retrieval in FP is similar. The rules of the game now correspond to the physical laws of coherent image formation, while the known entries correspond to the captured observations. More precisely, we know that the spatial distribution of light in the image and the pupil plane are linked via Fourier transformation, and we additionally have data to guide us along the way by allowing for self-consistency checks.
Of course, the ability to computationally determine phase information is not for free. A key requirement for successful algorithm convergence is measurement overlap within the pupil plane (Figure 3g), which allows acquired images to share information regarding sample spectra locations. This, in turn, allows the phase retrieval algorithm to progressively estimate a spectrum phase that is self-consistent across all of the captured images. With this in mind, the FP algorithm will select a segment of the Fourier spectrum estimate that corresponds to a particular image. By Fourier transforming this segment back into the image plane, we can directly check for consistency of our phase initial estimate with other data points in our scan. As a next step, any deviations from the measured amplitude in the detector plane are corrected, while the phase information is left unchanged (Figure 3h). The resulting signal is then back-propagated once more into the pupil plane, and spectrum segment values are accordingly updated. This process is then repeated with neighboring overlapped Fourier spectrum estimate segments. At each iteration, the estimated phase in the pupil plane is improved, and convergence is reached once the partitioned signals in the pupil plane exhibit a minimum deviation from the measured data upon propagation into the detector plane, which is typically quantified by means of a suitable loss function [Reference Fienup7]. The resulting measured data, attributed with the retrieved phase information, can now be fused together over a synthetic lens aperture that is larger than the original lens aperture. A final Fourier transform of the resulting synthetic aperture signal then gives a high-resolution, wide-area, and phase-sensitive image of the specimen (Figure 3i).
Practical Considerations
From a practitioner's perspective, the question arises concerning how much the shifted pupil plane signals should overlap. With regard to Figure 3g, the linear overlap parameter [Reference Bunk8] quantifies the amount of self-consistency checks in a captured data set. Here the shift between spectra from adjacent illumination directions needs to be smaller than the objective numerical aperture of the imaging system. Oftentimes a linear overlap of 50% or even less is reported. However, the phase retrieval process underlying FP is generally a nonlinear optimization process [Reference Horstmeyer9] that lacks solution guarantees. Chances for convergence are increased when we provide highly overlapping data, which in turn avoids ambiguities and improves convergence toward the solution via an increased number of self-consistency checks. Moreover, a higher overlap has the additional benefit that other errors in the system can be detected and corrected for. For instance, the illumination directions and/or the pupil aberrations in the system may not be perfectly known prior to capturing data. It is then safer to choose a higher overlap, which allows for calibrating the system by embedding both pupil aberrations and the illumination directions as part of the optimization problem [Reference Ou10,Reference Eckert11]. In such situations we recommend a linear overlap of 70% or more.
Preview for the Next Article
As hinted above, FP's ability to computationally improve image resolution and measure quantitative phase leads to many new and exciting possibilities for today's digital microscopes. This includes digital correction of imaging system aberrations and measurement of 3D specimen properties and extends into new domains such as fluorescence and X-ray measurement, which we will detail in the next and final article of this series.


