


The association between socio-economic position (SEP) and takeaway food has been examined in a number of Australian(Reference Inglis, Ball and Crawford1–Reference Smith, McNaughton and Gall6) and international studies(Reference Fanning, Marsh and Stiegert7–Reference Schröder, Fïto and Covas9). To date, the findings of such studies are mixed, with some studies showing that socio-economically advantaged groups are more likely to purchase or consume takeaway food(Reference Miura, Giskes and Turrell2, Reference Turrell and Giskes5, Reference Fanning, Marsh and Stiegert7) and others reporting the opposite(Reference Inglis, Ball and Crawford1, Reference Thornton, Bentley and Kavanagh4, Reference Pereira, Kartashov and Ebbeling8, Reference Schröder, Fïto and Covas9) or no association(Reference Mohr, Wilson and Dunn3, Reference Smith, McNaughton and Gall6). This mixed evidence is hindering efforts to better understand dietary inequalities among socio-economic groups and ultimately address diet-related risk factors and higher rates of chronic disease among the disadvantaged.
The inconsistent evidence in relation to SEP and takeaway food may be due to the fact that studies have conceptualised and measured takeaway foods in different ways. Most have used measures that reflect the consumption of so-called ‘fast foods’ such as hamburgers, pizza, chips and meat pies, which are typically purchased from fast-food restaurants, snack bars or convenience stores(Reference Inglis, Ball and Crawford1, Reference Mohr, Wilson and Dunn3, Reference Thornton, Bentley and Kavanagh4, Reference Fanning, Marsh and Stiegert7–Reference Paeratakul, Ferdinand and Champagne10). Other studies have used a more encompassing definition of takeaway food that includes fast food and other food types such as sandwiches, Asian takeaway foods, kebabs and sushi(Reference Miura, Giskes and Turrell2, Reference Turrell and Giskes5, Reference Smith, McNaughton and Gall6). Although there is no standard definition of ‘takeaway’ foods, they comprise a wide variety of foods that may be more (or less) consistent with dietary recommendations (hereafter termed ‘healthy’ and ‘less healthy’ choices). Socio-economic groups may differ in their choices of these types of takeaway foods; for example, disadvantaged groups may be more likely to choose ‘less healthy’ options such as hot chips, whereas advantaged groups may select ‘healthy’ options such as sushi. Differences in the nature of takeaway food choices may account for the inconsistent evidence in the findings of studies that examined SEP and takeaway food. Furthermore, different takeaway choices by socio-economic groups may be reflected in higher intakes of fat and sugar and lower fibre intakes among disadvantaged groups(Reference Beydoun and Wang11), and may thus contribute to inequalities in diet-related chronic disease and associated risk factors such as obesity.
Other factors exist that limit our understanding of the socio-economic differences in takeaway food consumption. First, there is a lack of up-to-date information about takeaway consumption among socio-economic groups in Australia using a more inclusive definition of takeaway foods, with the most recent Australian estimates being derived from the 1995 National Nutrition Survey(Reference Miura, Giskes and Turrell2). The intervening 15 years have been characterised by marked changes in the takeaway and fast-food environment in Australia, with a significant increase in takeaway food sales(12) and product diversification to include healthier takeaway food choices(13). Given the fact that takeaway food has become an increasingly important part of the diet in Australia(Reference Miura, Giskes and Turrell2), the USA(Reference Paeratakul, Ferdinand and Champagne10) and other countries, examining socio-economic differences in takeaway consumption, and the types of choices made, is a necessary prelude to addressing diet-related health inequalities.
Second, no known study has examined the reliability of survey items designed to elicit information about takeaway food consumption using an FFQ, which is one of the most widely used methods of collecting habitual dietary information in epidemiological research(Reference Willett14). A number of studies have discussed the reproducibility of an FFQ; however, most of these have assessed reproducibility of nutrient intakes rather than intakes of specific food groups(Reference Boucher, Cotterchio and Kreiger15–Reference Stevens, Metcalf and Dennis17). Takeaway food consumption is a specific dietary behaviour that can affect nutrient intakes and thereby dietary quality. Assessing the reliability of self-reported responses to items measuring takeaway food consumption is critical, as self-reports can introduce substantial measurement error, which may lead to biased risk estimates(Reference Kipnis, Subar and Midthune18). These errors may contribute to the inconsistent findings of studies examining socio-economic variations in takeaway food consumption. Therefore, reliability assessment is necessary to estimate the quality of takeaway food consumption information collected to determine the reproducibility of peoples’ responses(Reference Willett14).
The aim of the present study was to examine the association between SEP and takeaway food, where ‘takeaway’ is defined as foods or meals that are pre-prepared commercially and hence require no further preparation by the consumer and can be consumed immediately after purchase. Takeaway food data were collected in 2009, and consumption patterns are examined on the basis of food types that reflect the large diversity and ‘healthiness’ of takeaway foods available in contemporary Australia. Further, the study assesses the reliability of people's responses to questions on takeaway food consumption using a test–retest study.
Methods
Ethical approval for the present research was obtained from the Queensland University of Technology Human Research Ethics Committee (ID 0900000445).
Participants
The present cross-sectional study was conducted in the Brisbane metropolitan area, Australia, in 2009. The sampling frame was the electoral roll for the Brisbane local government area and comprised men and women aged between 25 and 64 years. This age group was chosen since takeaway food consumption patterns are likely to be well established by adulthood and will not be influenced by transitory life circumstances (e.g. being a student) that characterise younger age groups. Furthermore, individuals’ socio-economic circumstances are established by 25 years of age, as education is often completed and they are more likely to be in occupations within their chosen profession. The sample was drawn using a two-step process. First, the Australian Electoral Commission (AEC) randomly selected 20 000 individuals residing in the study area; second, the principal author (K.M.) selected 1500 individuals by simple random sampling from the AEC list using a random number generator in the Statistical Package for the Social Sciences statistical software package version 16·0 (SPSS Inc., Chicago, IL, USA).
Data were collected using a self-administered sixteen-page mail survey that asked about usual takeaway food consumption patterns and sociodemographic characteristics. The selected participants received questionnaires with postage-paid return envelopes. Participants were contacted three times after they received the first survey to maximise the response rate(Reference Dillman19). A total of 903 participants returned the survey questionnaire (response rate: 63·7 %). Those who did not report or provide sufficient information on age, education and takeaway food consumption were excluded (n 44), which reduced the analytic sample to 859.
Measures
Overall takeaway food consumption
Participants were asked whether they had consumed any takeaway food in the past 12 months. Response options were: never, rarely, <1 time/month, 1–3 times/month, 1 time/week, 2–4 times/week, 5–6 times/week and 1 time/d. To characterise participants as frequent takeaway food consumers, these responses were subsequently categorised into two groups: <4 times/month and ≥4 times/month. This decision was taken according to the sample distribution of takeaway food consumption.
Consumption of specific takeaway items
Participants who reported consuming takeaway food (n 841) were asked how often they usually ate each of the twenty-two takeaway items. Similar to the overall takeaway food measure, seven response options ranged from ‘never or rarely’ to ‘≥1 time/d’. Initially, these responses were grouped into two groups in the same manner as overall takeaway food; however, a small number of participants reported consuming some takeaway items ≥4 times/month. Consequently, responses for the twenty-two takeaway items were dichotomised into two groups for analysis: <1 time/month and ≥1 time/month. The twenty-two takeaway items were identified from the 1995 National Nutrition Survey and from a more recent marketing report as the most frequently consumed takeaway items in the Australian population(Reference Miura, Giskes and Turrell2, 20).
To characterise takeaway food consumption patterns, each of these twenty-two items were classified as either ‘healthy’ or ‘less healthy’ choices. Similar to a previous study(Reference Miura, Giskes and Turrell2), this classification was based on the Australian Guide to Healthy Eating (AGHE)(21), which categorises foods into five core food groups and one ‘extra’ food group. The ‘extra’ foods (e.g. cakes, pastry, deep-fried takeaway foods, ice cream and non-diet soft drinks) are a non-essential part of a diet; they do not provide many essential nutrients and are typically high in fat, salt or sugar. Most of the ‘less healthy’ takeaway items in the present study were consistent with the ‘extra’ foods as defined in the AGHE. Nutrient composition data were used to classify foods not identified in the ‘extra’ food list(22, 23). Foods meeting one or more of the following criteria were classified as ‘less healthy’: >2500 kJ of energy per serving; >3 g of saturated fat; and <2 g of fibre per serving. Beverages classified as ‘less healthy’ were those containing ≥600 kJ of energy per serving and/or >3 g of saturated fat per 100 g. Foods or beverages not meeting any of these criteria were considered ‘healthy’ options. This classification resulted in nine ‘healthy’ and thirteen ‘less healthy’ items.
Socio-economic measure
SEP was measured using the respondent's highest completed education qualification and total gross household income. Education was coded as: (i) Bachelor's degree or higher (including graduate diploma or graduate certificate, Master's degree or doctorate); (ii) diploma; (iii) vocational (trade or business certificate); and (iv) no post-school qualifications. This educational classification has been used in other Australian studies examining SEP and diet(Reference Turrell, Hewitt and Patterson24, Reference Turrell and Kavanagh25).
For household income, participants were asked to estimate their total pre-tax household income from eleven pre-defined categories. Equivalised household income was calculated by allocating a weight of 1·0 point to the first adult in the household, additional adults thereafter were weighted as 0·5 points and children under 18 years were weighted as 0·3 points(Reference Atkinson, Rainwater and Smeeding26, 27). Total annual household income was then divided by the number of household income units. Equivalised household income was categorised into quartiles: (i) ≥$AUS 62 000; (ii) $AUS 46 501–61 999; (iii) $AUS 30 001–46 500; and (iv) ≤$AUS 30 000.
Test–retest reliability
A separate sample of 100 individuals in the target age range was randomly selected from the electoral roll. These participants were administered the same survey twice, 4 weeks apart. Eight individuals did not reside at the same address; fifty-three replied to the first questionnaire (response rate: 57·6 %) and thirty-seven replied to the second questionnaire (response rate: 69·8 %). Reliability for the measures of overall takeaway food consumption and consumption of the twenty-two takeaway items was assessed by the linear weighted κ statistic(Reference Lantz28, Reference Sim and Wright29). The original categories for each measure (eight categories for the consumption of overall takeaway food and seven categories for the twenty-two takeaway items) were used to obtain κ statistics. Interpretation of the κ coefficient was based on Landis and Koch's classification: ≤0 = poor agreement; 0·01–0·20 = slight; 0·21–0·40 = fair; 0·41–0·60 = moderate; 0·61–0·80 = substantial; and 0·81–1·00 = almost perfect agreement(Reference Landis and Koch30). Crude agreement (%) for each measure was also presented, as low κ values can result from skewed distributions (which actually reflect a highly reliable response pattern).
Statistical analyses
Descriptive statistics were used to describe the participants’ demographic and takeaway food consumption characteristics. Socio-economic differences in the consumption of overall takeaway food and of the twenty-two takeaway items were assessed by calculating prevalence ratios and their 95 % CI using log binomial regression(Reference Barros and Hirakata31, Reference Blizzard and Hosmer32). The highest-education and -income groups were the categories of reference in these analyses. All multivariable analyses were adjusted for age and sex. Bivariate analyses were carried out using the SPSS 18·0·1 (SPSS Inc.), and log binomial regression was computed using the SAS statistical software package version 6·2 (SAS Institute, Cary, NC, USA).
Results
Table 1 shows the participants’ sociodemographic characteristics. More than 50 % of participants were female and the mean age was 44·2 years. Compared with the Brisbane population(33) the study sample slightly over-represented female, older and more educated groups. Participants in the test–retest reliability study had gender proportions similar to those of the main study. However, they were slightly younger (mean age of 43·2 years), with fewer participants from the highest educated and household income groups.
Table 1 Sociodemographic characteristics of participants
*Compared with 2006 Census data(33).
†People who answered ‘not applicable’ to non-school qualifications.
Frequency of takeaway food consumption
Over one-third (37·7 %) of participants reported consuming takeaway foods ≥4 times/month (Fig. 1, Table 2). Among the twenty-two takeaway items, salads (18·4 %) and fruit or vegetable juices (20·9 %) were the most frequently consumed ‘healthy’ takeaway items. Potato chips, fries or wedges (14·6 %) and non-diet soft drinks (15·9 %) were the most frequently consumed ‘less healthy’ takeaway items.
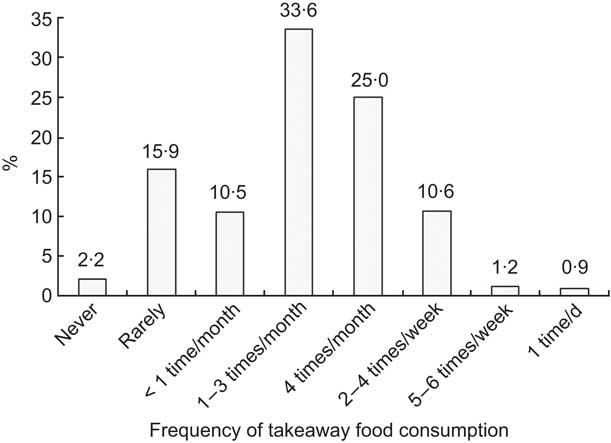
Fig. 1 Frequency of takeaway food consumption among Australian adults aged between 25 and 64 years (n 859)
Table 2 Frequencies of consumption of different types of takeaway items
*Does not add to 100 % as numbers are rounded.
Educational differences in takeaway food consumption
The least educated group was significantly more likely to have reported consuming overall takeaway foods ≥4 times/month compared with their highly educated counterparts (Table 3). For the individual takeaway items, participants with no post-school and vocational qualifications were less likely to consume sushi and more likely to consume fruit or vegetable juice compared with those having a Bachelor's degree or higher. Participants with diploma qualifications were more likely to consume kebabs, pasta, diet soft drinks and fruit or vegetable juice compared with those having a Bachelor's degree or higher. In contrast, most ‘less healthy’ takeaway foods were more likely to be consumed ≥1 time/month by lower educated groups, although the higher prevalence often did not reach statistical significance. Participants with no post-school qualifications were significantly more likely to consume potato chips, fries or wedges; savoury pies, sausage rolls or pastries; fried chicken; and non-diet soft drinks; they were also less likely to consume curry ≥1 time/month compared with those having a Bachelor's degree or higher. Participants with vocational and diploma qualifications were also more likely to consume fried chicken compared with those having a Bachelor's degree or higher.
Table 3 PR and 95 % CI for differences in takeaway food consumption by educationFootnote *
PR, prevalence ratios.
* Adjusted by age and sex.
Income differences in takeaway food consumption
There was no association between household income and overall takeaway food consumption, and there were only a few discernable income differences in the consumption of individual items (Table 4). For the ‘healthy’ takeaway items, residents of households in the lowest-income group were more likely to consume fruit or vegetable juice compared with those in the highest-income group. On the other hand, the second lowest-income group was less likely to consume sushi and sandwiches and the second highest-income group was less likely to consume salad compared with the highest-income group. For the ‘less healthy’ takeaway items, residents of households in the lowest-income group were more likely to report consuming fried fish or seafood; ice cream, ice confection or frozen yoghurt; and thick shakes or milk shakes; they were also less likely to consume curry compared with the highest-income group.
Table 4 PR and 95 % CI for differences in takeaway food consumption by household incomeFootnote *
PR, prevalence ratios.
* Adjusted by age and sex.
Test–retest reliability of takeaway food consumption measures
Table 5 presents reliability estimates for the takeaway food items. Kappa coefficients for overall and three takeaway items had ‘substantial’ agreement. Most takeaway foods (ten ‘less healthy’ and six ‘healthy’ items) had ‘moderate’ agreement, three items had ‘fair’ agreement and one item had ‘slight’ agreement. All crude percentage agreements exceeded 50 % (mean = 65·3, sd 7·8, minimum = 51·4, maximum = 77·8).
Table 5 Test–retest reliability of overall takeaway foods and of twenty-two takeaway food measures

*Original categories for each measure were used to calculate κ coefficients: overall takeaway foods were divided into eight categories; the twenty-two specific takeaway items were divided into seven categories.
Discussion
Educational differences in takeaway food consumption
The present study of socio-economic differences in takeaway food consumption found that lower educated groups consumed takeaway foods more frequently and were more likely to choose ‘less healthy’ options compared with their higher educated counterparts. This finding was consistent with previous studies that reported that lower educated groups were more likely to consume or purchase fast food(Reference Thornton, Bentley and Kavanagh4, Reference Pereira, Kartashov and Ebbeling8, Reference Schröder, Fïto and Covas9). Similar to our findings, previous Australian research (using data from the most recent Australian National Nutrition Survey in 1995) found that the least educated groups were significantly more likely to consume potato chips, non-diet soft drinks and fried chicken compared with the highly educated group(Reference Miura, Giskes and Turrell2). These items are generally high in fat or sugar and low in fibre and can contribute to higher energy intakes(Reference Burns, Jackson and Gibbons34). Increased energy intake from eating such takeaway foods, in particular ‘less healthy’ takeaway foods, can lead to overconsumption of energy and saturated fat(Reference Bowman and Vinyard35). Consequently, frequent consumption of these items over a long period of time may influence weight status and increase the risks of development of CVD and type 2 diabetes(Reference Pereira, Kartashov and Ebbeling8).
Contrary to our findings, some studies have reported a reverse association between education and takeaway food consumption or purchase(Reference Miura, Giskes and Turrell2, Reference Turrell and Giskes5) and still others have shown no association(Reference Inglis, Ball and Crawford1, Reference Mohr, Wilson and Dunn3, Reference Smith, McNaughton and Gall6). Inconsistencies in the directions of the associations found in the current and previous studies may be due to the following reasons: differences in the scope of takeaway foods considered (many studies have focused only on ‘fast food’); differences in how education was measured (highest education achieved or age when participants left school); and the type of dietary behaviour examined (i.e. some studies have examined intakes, whereas others have examined purchasing behaviour).
Income differences in takeaway food consumption
Previous research has reported that higher-income groups are more likely to consume or purchase takeaway food or fast food(Reference Mohr, Wilson and Dunn3–Reference Turrell and Giskes5, Reference Paeratakul, Ferdinand and Champagne10). The results of the present study were inconsistent with those of the earlier study: we found no association between household income and overall takeaway consumption and found limited associations between income and the consumption of ‘healthy’ and ‘less healthy’ takeaway items. In an attempt to understand these results, we further examined the association between household income and takeaway consumption using a number of different analytic approaches. First, the largely null associations may have been attributable to misclassification error: income was measured at the household level and takeaway consumption at the individual level; hence, individuals of low SEP measured on the basis of education (who were more likely to consume less healthy takeaway) may have been classified in the high-income category at the household level, thereby weakening associations. To test for this, we delimited our income analysis to single-person households, which resulted in both the predictor and outcome variables being operationalised at the same (individual) level. Second, takeaway consumption was regressed on household income using different income categories: (i) ≤$AUS 25 000; (ii) $AUS 25 001–52 000; (iii) $AUS 52 001–71 999; and (iv) ≥$AUS 72 000 to increase the socio-economic variability among the income groups. Third, we adjusted the association between household income and takeaway consumption for respondent's education to determine whether the unmeasured effects of this socio-economic factor were confounding the income–takeaway association. None of these analytic approaches made an appreciable difference in the direction or magnitude of the association between household income and takeaway consumption. In addition, these three analyses did not change the original findings. On the basis of this evidence, we cautiously conclude that in the contemporary Australian context, where the range of inexpensive takeaway foods is extensive, households differing in their income may not have a measurably different consumption pattern for most types of takeaway food.
Test–retest reliability of takeaway food consumption measures
The present study assessed the reliability of self-reported takeaway food consumption measures and most showed moderate agreement. Although one takeaway item (pasta) exhibited only ‘slight’ agreement (κ = 0·17), this low coefficient was not necessarily indicative of the measure's poor reliability, as κ is affected by prevalence(Reference Feinstein and Cicchetti36). For pasta, there was a very high prevalence of responses in the never/rarely group and very low prevalence in the remaining categories, which resulted in a low κ even though the crude agreement was 65·7 %. Overall, the guideline for interpretation of κ (Reference Landis and Koch30) indicates that the reliability of takeaway food measures was in moderate agreement and supports their use for population-based dietary research among adults.
Strengths and limitations
The present study has several strengths. First, socio-economic differences in takeaway food consumption were examined using a more inclusive definition of takeaway food compared with previous research, which has tended to focus on ‘fast food’. Second, each specific type of takeaway item was examined across socio-economic groups. Third, this is a population-based study with a moderately high response rate and the sample's sociodemographic characteristics were similar to that of the target population (i.e. Brisbane residents aged 25–64 years).
A number of limitations of the present study need to be taken into account in the interpretation of the findings. First, there are likely to be variations in nutrient contents within each type of specific takeaway item. The classification of ‘healthy’ or ‘less healthy’ choices was made according to the AGHE(21) and nutrient composition criteria. However, not all items in the ‘healthy’ and ‘unhealthy’ choice categories were actually healthy or unhealthy, respectively, as there were variations in nutrient content within each food group(Reference Dunford, Webster and Barzi37). For example, in the present study, sandwiches were considered a healthy option; however, the nutrient content would vary greatly depending on what the sandwich contained. In addition, the twenty-two specific takeaway food choices were not inclusive of all takeaway items sold in Australia. Marked socio-economic differences may occur in less frequently consumed takeaway items not considered in the present study. However, the list comprises the most popular takeaway items in Australia(Reference Miura, Giskes and Turrell2) and is therefore likely to represent the takeaway items contributing to the dietary intakes of most Australians.
Second, the present study used self-reported data measured by an FFQ. This method is prone to bias, especially social desirability bias, given that the items considered as ‘less healthy’ tend to be under-reported(Reference Gibson38). Likewise, a postal survey cannot validate who has actually completed the questionnaire or whether they have understood the questions. However, to prevent the latter, the questionnaire was validated with various socio-economic groups during a pilot study.
Third, although the present study achieved a moderately high response rate, 36·7 % of those sampled did not respond. Similar to other studies(Reference Batty and Gale39, Reference Tolonen, Dobson and Kulathinal40), disadvantaged groups were under-represented; these groups are more likely to have adverse health behaviours and risk factors compared with advantaged groups(Reference Tolonen, Dobson and Kulathinal40). Therefore, disadvantaged non-respondents to the survey may possibly be consuming takeaway food more frequently compared with disadvantaged respondents; hence, the magnitude of socio-economic differences in the consumption of takeaway items reported in the present study may be underestimated. In addition, participants were Brisbane residents and are not a representative sample of the Australian population. The findings may not be generalisable, especially to non-metropolitan areas where more limited takeaway food options are available. Finally, the present study is cross-sectional in nature; therefore, any association observed cannot be ascribed as causal.
In conclusion, more frequent takeaway food consumption among less educated groups, and especially takeaway food choices that are less consistent with recommendations for good health, may be contributing to higher rates of overweight or obesity and to diet-related chronic diseases among the socio-economically disadvantaged population. Health promotion programmes may be needed to encourage people to choose healthier takeaway food options. Furthermore, policies that reduce access to less healthy options and increase the availability of healthy choices may improve the diet of the whole population, particularly among disadvantaged groups, leading to reductions in socio-economic inequalities in diet-related diseases. Further research is required to investigate the factors that may contribute to socio-economic differences in takeaway food consumption. The present study also suggests that self-report measures of takeaway food consumption are acceptably reliable and are suitable for use in population-based dietary research.
Acknowledgements
The present study received no specific grant from any funding agency in the public, commercial or not-for-profit sectors. G.T. is supported by a National Health and Medical Research Council Senior Research Fellowship (Grant no. 390109). The authors have no conflict of interest to declare. K.M. collected data, conceptualised the paper, conducted the data analyses and wrote the manuscript; K.G. and G.T. contributed to conceptualisation, planning of the analysis and to editing of the manuscript. All authors contributed to the final version of the paper.


