


Introduction
The critical period of weed control (CPWC) is defined as the period of time in crop development in which weeds must be controlled to avoid unacceptable yield loss (Zimdahl Reference Zimdahl, Altieri and Liebmann1988). Weeds can only be present with a crop for a limited period of time without causing excessive yield reduction due to resource competition between the crop and weed species, as well as changes in crop physiology induced by changes in light quality (Rajcan and Swanton Reference Rajcan and Swanton2001). The CPWC has been established in many major agronomic crops, such as corn (Zea mays L.) (Evans et al. Reference Evans, Knezevic, Lindquist, Shapiro and Blankenship2003; Hall et al. Reference Hall, Swanton and Anderson1992), soybean [Glycine max (L.) Merr.] (Van Acker et al. Reference Van Acker, Swanton and Weise1993), dry bean (Phaseolus vulgaris L.) (Burnside et al. Reference Burnside, Wiens, Holder, Weisberg, Ristau, Johnson and Cameron1998; Mohamed Reference Mohamed2012; Woolley et al. Reference Woolley, Michaels, Hall and Swanton1993), cotton (Gossypium L. spp.) (Bukun Reference Bukun2004), winter wheat (Triticum aestivum, cv. ‘Mercia’) (Welsh et al. Reference Welsh, Bulson, Stopes, Froud-Williams and Murdoch1999), sunflower (Helianthus annuus L.) (Knezevic et al. Reference Knezevic, Elezovic, Datta, Vrbnicanin, Glamoclija, Simic and Malidza2013), and spring canola (Brassica napus L.) (Martin et al. Reference Martin, Van Acker and Friesen2001).
Competitive interactions between plant species are influenced by resource availability (Gough et al. Reference Gough, Osenberg, Gross and Collins2000; Tilman Reference Tilman1982). Agronomic practices that manage resource availability can influence competitive interactions between the crop and weed species (Liebman et al. Reference Liebman, Gallandt, Jackson and Jackson1997) and can therefore affect the CPWC (Knezevic et al. Reference Knezevic, Evans, Blankenship, Van Acker and Lindquist2002). Nutrient management (Evans et al. Reference Evans, Knezevic, Lindquist, Shapiro and Blankenship2003; Mohammadi and Amiri Reference Mohammadi and Amiri2011), crop row spacing (Knezevic et al. Reference Knezevic, Evans and Mainz2003; Tursun et al. Reference Tursun, Datta, Budak, Kantarci and Knezevic2016), planting date (Williams Reference Williams2006), and crop density (Ahmadvand et al. Reference Ahmadvand, Mondani and Golzardi2009) are all variables that have been shown to influence the CPWC.
The beginning of the CPWC is the critical timing of weed removal (CTWR), which is the point in crop development when weed competition must be removed to preserve yield potential and avoid significant yield loss (Knezevic et al. Reference Knezevic, Evans, Blankenship, Van Acker and Lindquist2002). The CTWR is determined by modeling crop yield reduction, based on duration of weed competition, to determine when yield is reduced beyond an acceptable level (Knezevic et al. Reference Knezevic, Evans, Blankenship, Van Acker and Lindquist2002). The CPWC varies depending on environmental factors, including the timing of weed emergence relative to crop emergence, and the density and composition of weed species present at the experiment sight (Knezevic et al. Reference Knezevic, Evans, Blankenship, Van Acker and Lindquist2002). The application of soil-active preemergence herbicides delays weed emergence, in comparison to cropping systems utilizing only postemergence-applied herbicides, and can therefore affect the CTWR (Barnes et al. Reference Barnes, Knezevic, Lawrence, Irmak, Rodriguez and Jhala2019). Soil-active preemergence-applied herbicides have shown to delay the CTWR in corn (Ulusoy et al. Reference Ulusoy, Osipitan, Scott, Jhala, Lawrence and Knezevic2020), soybean (Knezevic et al. Reference Knezevic, Pavlovic, Osipitan, Barnes, Beiermann, Oliveira, Lawrence, Scott and Jhala2019), and popcorn (Barnes et al. Reference Barnes, Knezevic, Lawrence, Irmak, Rodriguez and Jhala2019).
Dry bean is a pulse crop commonly produced in arid and semi-arid climates of the US West and western Great Plains. In 2019 there were 521,000 ha planted in the United States (USDA 2019). The top five US states in rank of total dry bean production are North Dakota, Minnesota, Michigan, Nebraska, and Idaho, representing 48%, 16%, 14%, 9%, and 4% of total US production, respectively (USDA 2019). Dry bean is normally planted in late May to early June in the northern High Plains and harvested in September (Pearson et al. Reference Pearson, Brick, Smith, Schwartz and Brick2015). Without effective weed control, it is estimated that dry bean yields in the State of Nebraska would be reduced by 59%, compared to 71% nationally (Soltani et al. Reference Soltani, Dille, Gulden, Sprague, Zollinger, Morishita, Lawrence, Sbatella, Kniss, Jha and Sikkema2017b). Soybean production has been estimated to be reduced by 52% nationally without effective weed control (Soltani et al. Reference Soltani, Dille, Burke, Everman, VanGessel, Davis and Sikkema2017a), indicating that dry bean is less competitive against weeds than soybean.
Dry bean is planted later in the growing season than corn, sugarbeet (Beta vulgaris L.), and soybean. Late-season emerging weeds, such as pigweeds (Amaranthus spp.) and nightshades (Solanum spp.), emerge after dry bean is planted (Ogg and Dawson Reference Ogg and Dawson1984). Late-emerging weeds have been shown to interfere with the development of dry bean and reduce yield and quality (Amini et al. Reference Amini, Alizadeh and Yousefi2014; Blackshaw Reference Blackshaw1991; Fennimore et al. Reference Fennimore, Mitich and Radosevich1984). Grass weed species such as wild proso millet (Panicum miliaceum L.) (Wilson Reference Wilson1993), and barnyardgrass [Echinochloa crus-galli (L.) P. Beauv.] (Fennimore et al. Reference Fennimore, Mitich and Radosevich1984) have also been shown to have negative effects on dry bean development.
According to previous studies in dry bean, the CPWC begins 3 wk after planting and continued to 5 wk after planting (Burnside et al. Reference Burnside, Wiens, Holder, Weisberg, Ristau, Johnson and Cameron1998), or 4 to 6 wk after planting (Mohamed Reference Mohamed2012). Although the Burnside et al. (Reference Burnside, Wiens, Holder, Weisberg, Ristau, Johnson and Cameron1998) and Mohamed (Reference Mohamed2012) studies are of sound methodology, utilizing weeks after planting as the measure of timing for weed control, rather than growing degree days (GDDs) or crop growth stage, they lack precision when comparing results to other studies, or when using research results to inform management decisions. Woolley et al. (Reference Woolley, Michaels, Hall and Swanton1993) reported that the CPWC for navy bean (Phaseolus vulgaris L.) based on 3% yield loss threshold, begins at the second trifoliate growth stage (V2) and continues to the first bloom growth stage (R1). Qasem (Reference Qasem1995) found that snap bean (Phaseolus vulgaris L.) should be maintained weed-free from 14 to 21 DAE to avoid significant yield reduction. The results reported by Qasem (Reference Qasem1995) agree with those of Stagnari and Pisante (Reference Stagnari and Pisante2011), who reported that the CPWC for snap bean at a 5% yield reduction threshold, began 11 DAE and ended 28 DAE, corresponding to 50 and 284 GDD (base temperature 10 C), respectively.
None of the aforementioned studies on the CPWC in dry bean or snap bean utilized soil-active herbicides. It is a common practice for dry bean growers in Nebraska and other regions of the Great Plains to apply soil-active herbicides, either preemergence or preplant incorporated, to ensure effective weed control, as postemergence herbicide options are limited in dry bean. Information pertaining to the effects of soil-active herbicides on the CTWR in dry bean is lacking. As soil-active herbicides form the foundation of dry bean weed control, estimating the CTWR without the use of soil-applied herbicides does not reflect grower practices and may have contributed to inaccurate estimates of the CTWR in previous research. The objective of this study is to estimate the CTWR when a preemergence herbicide is used, which better matches actual grower practices and will provide more actionable guidelines for postemergence weed control timing for dry bean producers.
Materials and Methods
Site Description
Field studies were conducted in 2018, 2019, and 2020; however, only the 2018 and 2020 results will be reported, as significant hail events caused total crop failure in 2019. Field studies during the 2018 and 2020 growing seasons were conducted at the University of Nebraska–Lincoln Panhandle Research and Extension Center near Scottsbluff, NE (41.89° N, 103.68° W). Soil texture was a Glenberg sandy loam (Ustic Torrifluvents), with a pH of 7.7, 65% sand, 18% silt, 17% clay, and 1.2% organic matter. Dry fertilizer was spread across the experiment area prior to planting, providing 112 kg ha–1 nitrogen and 45 kg ha–1 phosphorus. No tillage was performed prior to planting to help ensure that weed seed remained near the soil surface. The crop present in the preceding year was sugarbeet in 2018 and corn in 2020. Supplemental irrigation applied to the crop each week was based on recorded weather data and evapotranspiration models for dry bean.
Treatments and Experimental Design
This experiment was designed as a split plot with four replications. Preemergence herbicide was the main plot factor and consisted of dimethenamid-P (790 g ae ha–1) + pendimethalin (1,070 g ae ha–1), referred to as preemergence; or nontreated, referred to as no-preemergence. The sub-plot factor was weed removal timing. Treatments were as follows: weed-free control, season-long weedy control, weed removal at dry bean growth stages V1, V3, V6, R2, R5. Main plot size was 15.4 m by 7.6 m, and sub-plot size was 2.2 m by 7.6 m. Plots were maintained weed-free for the remainder of the season through hoeing and hand pulling multiple times per week after a weed removal event occurred.
The dry bean variety Sinaloa (ADM Seedwest, Decatur, IL) was planted on June 13, 2018. The dry bean variety SV6139 (Seminis Vegetable Seeds, St. Louis, MO) was planted on May 26, 2020. Sinaloa is an indeterminate pinto variety, and SV6139 is a semi-determinate pinto variety; both exhibit upright plant architecture. Dry bean was planted in a 56-cm row configuration at a population of approximately 210,000 plants ha–1. Fifteen millimeters of water as irrigation were applied within 12 h to incorporate soil-active herbicides following planting and the application of preemergence herbicides. Glyphosate was applied at 1,261 g ae ha–1 1 d prior to planting to control kochia (Bassia scoparia L.) and common lambsquarters (Chenopodium album L.) that emerged prior to the start of the experiment.
Data Collection
Two 1-m2 quadrats were randomly placed in each weed removal plot to record weed density and biomass when dry bean reached the growth stage for weed removal. All aboveground biomass was collected separately for each weed species present, and the density of each weed species was recorded. Weed biomass was oven-dried at 59 C for 48 h before being weighed.
Dry bean was harvested for yield on September 19, 2018 and September 17, 2020 by hand pulling all plants from 6 m of row. The number of dry bean plants harvested was recorded to establish an end-of-season stand count. Plants were air-dried in paper bags until they were at a moisture to be threshed by a stationary combine. Yields were adjusted to a standard moisture of 15%. Ten consecutive plants were removed from each plot to sample yield components, in the form of number of pods per plant and number of seeds per pod. Samples for 100-seed weight were taken from the main yield sample.
Statistical Analysis
Data was analyzed with R software (R Core Team 2019). Regression models were fit utilizing the DRC package (Ritz et al. Reference Ritz, Baty, Streibig and Gerhard2015). Response variables are modeled based on GDD accumulation from the time of crop emergence, as described in Knezevic and Datta (Reference Knezevic and Datta2015). GDDs were calculated in base 10 C:
 $GD{D_{10{\rm{ C}}}} = \sum \left[ {\left\{ {{T_{max}} + {T_{min}}/2} \right\} - {T_{base}}} \right]$
Yield reduction was calculated as follows:
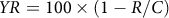 $$YR = {\rm{1}}00 \times \left( {{\rm{1}}-R/C} \right)$$
Where yield reduction (YR) is relative to the weed-free control, R is the yield of weed removal treatment, and C is the yield of the weed-free control. Data were analyzed utilizing a four-parameter logistic model (Knezevic et al. Reference Knezevic, Streibig and Ritz2007).
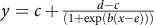 $y = c + {{d - c} \over {\left( {1 + \exp \left( {b\left( {x - e} \right)} \right)} \right)}}$
Where y is the response of [yield (kg ha–1), % yield reduction, number of pods per plant, number of seeds per pod, number of dry bean plants m row–1, and 100-seed weight (g)], c is the lower limit, d is the upper limit, x is GDD10 C accumulation from the time of crop emergence, e is the ED50 (50% response between the upper and lower limit), and b is the slope at the ED50.
Results and Discussion
Temperature and Rainfall
Average monthly temperature in 2018 was greater (> 2 C) than the 30-year average for the months of May and June, but near average in July through September (∼ 2 C) (Table 1). Average monthly temperature in 2020 was near the 30-yr average in the months of May, July, August, and September (∼ 2 C) but was warmer than the average in June (> 2 C) (Table 1). The average temperature for the growing season was 1.7 C and 1.1 C greater in 2018 and 2020, respectively, than the 30-yr average (Table 1).
Table 1. Average air temperature, total rainfall, and irrigation during 2018 and 2020 growing seasons, and the 30-yr average at the University of Nebraska-Lincoln, Panhandle Research and Extension Center near Scottsbluff, NE. a
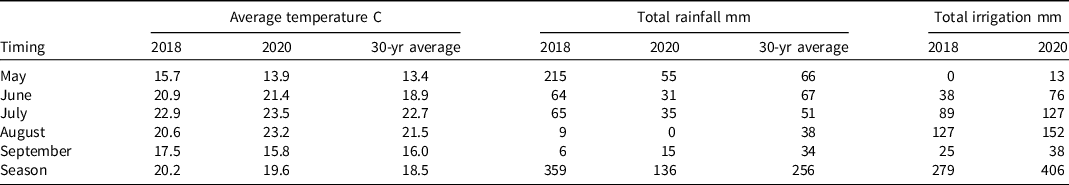
a Air temperature and rainfall data were collected from High Plains Regional Climate Center weather station, located within 1 km of the field experiment.
In 2018, three times the 30-year average rainfall was received in May (Table 1). The unusually large rainfall received in May 2018 delayed the planting of the experiment until mid-June, compared to a normal planting date between May 20 and June 10. Total rainfall in the 2018 growing season was 76% of the 30-yr average comparing the months of June through August, whereas the rainfall for the 2020 growing season was nearly 50% less than the 30-yr average for the same time period (Table 1). Rainfall differences between years would not have influenced results, as irrigation was provided through an overhead sprinkler system for both seasons.
Weed Density, Species Composition, and Biomass
2018 Field Site
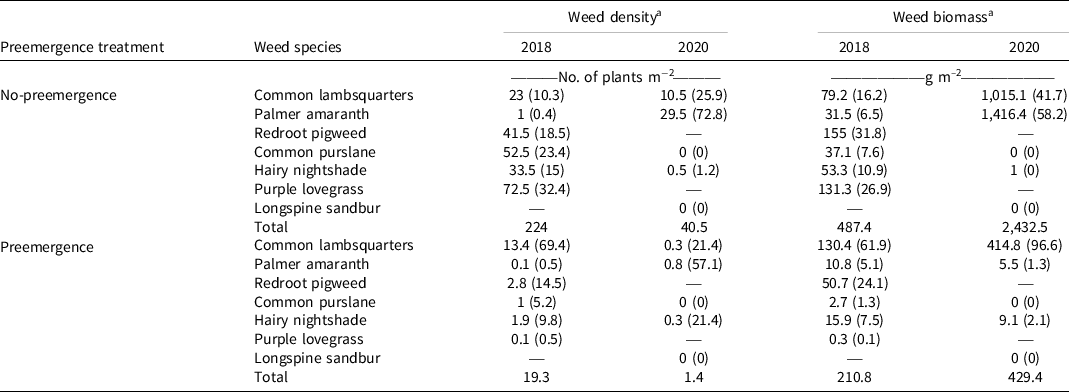
Total weed density and biomass was reduced from 224 plants m–2 and 487 g m–2 in no-preemergence plots to 19 plants m–2 and 211 g m–2 in the preemergence-applied season-long weedy plots (Table 2). Weed species composition in the preemergence-applied treatment compared to the no-preemergence treatment was similar, with the exception of purple lovegrass [Eragrostis spectabilis (Pursh) Steud.] and common purslane (Portulaca oleracea L.). Purple lovegrass and common purslane were the two most abundant species, based on density, in the no-preemergence treatment, whereas purple lovegrass and redroot pigweed (Amaranthus retroflexus L.) made up a large percentage of the biomass collected (Table 2). Common lambsquarters was the most dominant species and accounted for more than half of all weed density and biomass, whereas redroot pigweed was the second must abundant weed species in terms of density and biomass in the preemergence-applied season-long weedy plots. (Table 2).
Table 2. Weed species density and biomass from no-preemergence and pendimethalin (1,070 g ai ha–1) +dimethenamid-P (790 g ai ha−1)–applied preemergence treatments in 2018 and 2020.
a Numbers in parentheses represent percent of total.
Although purple lovegrass was not present in the preemergence-applied season-long weedy treatment, it was present in other preemergence-applied plots with weed removal at the R2 growth stage (Figure 1), indicating that the preemergence herbicides used did not provide complete control of purple lovegrass but did reduce density and biomass in most treatments relative to the no-preemergence treatments.
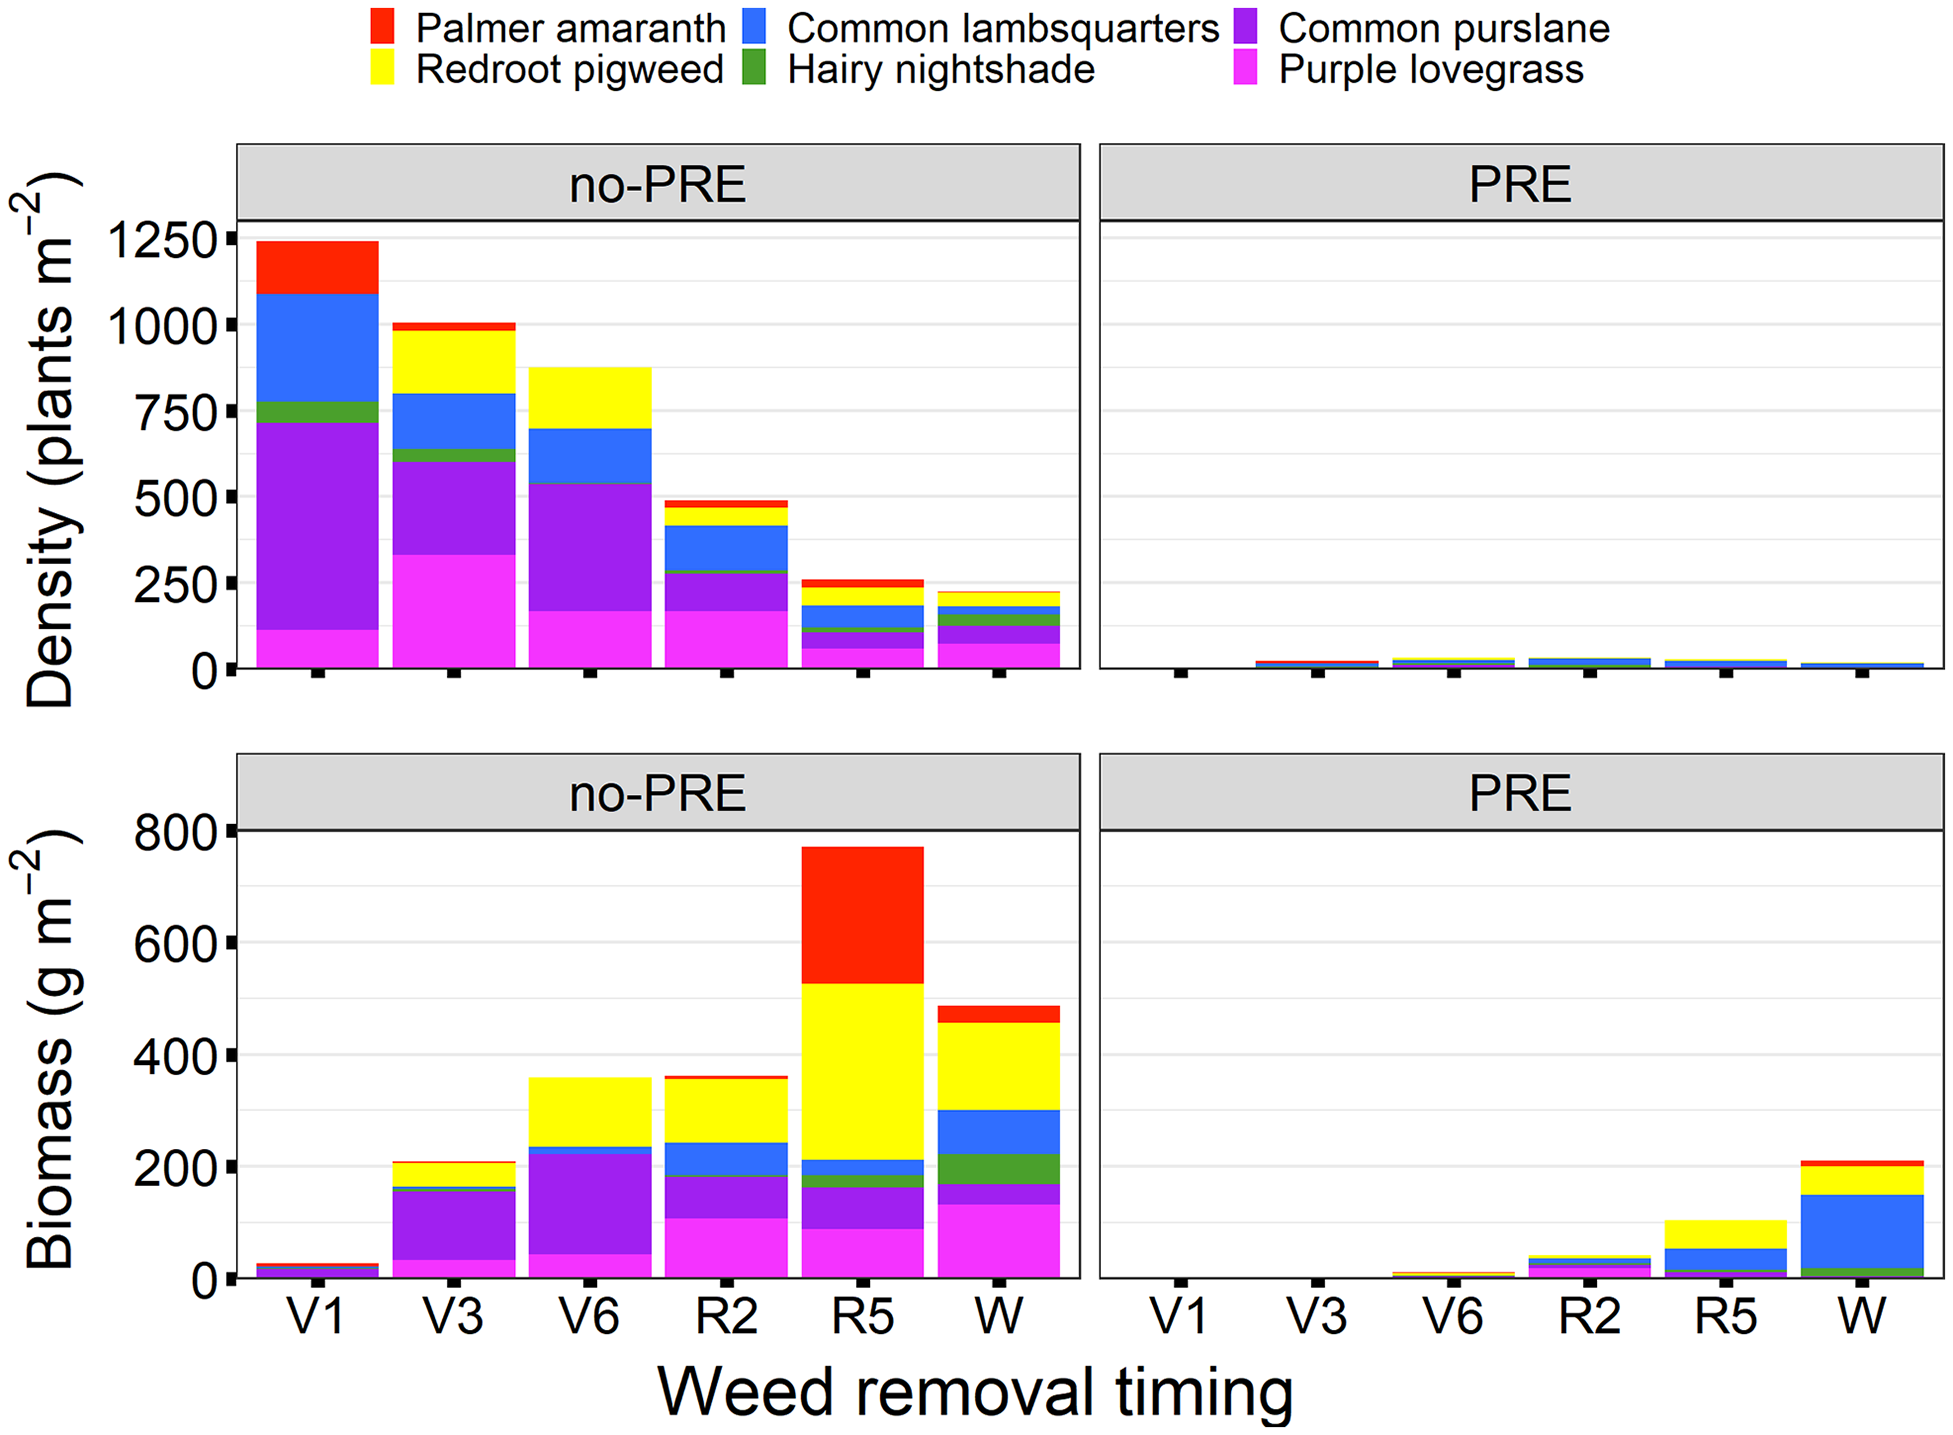
Figure 1. Weed density in number of plants m–2 and weed biomass in g m–2 by species at weed removal timings, noted by dry bean growth stage, for no-preemergence (no-PRE) and preemergence (PRE) treatments in 2018. ‘W’ represents season-long weedy control.
Total weed density was near 1,200 plants m–2 at the V1 weed removal and was reduced at each subsequent weed removal time (Figure 1). At the V1 weed removal, the soil was covered with small newly emerged weeds. Weeds became more competitive and began to compete intra- and interspecifically with each other, as the season progressed, causing a reduction in density.
Total weed biomass increased with later weed removals, in both the no-preemergence and preemergence treatments, with the exception of the no-preemergence season-long weedy treatment (Figure 1). In the no-preemergence treatment the R5 weed removal had higher weed biomass than the season-long weedy treatment (Figure 1). This is explained by the higher density of Palmer amaranth present in the R5 weed removal, compared to season-long weedy.
2020 Field Site
Palmer amaranth was the predominant weed species at the experiment site in 2020, making up 73% of total weed density and 58% of total weed biomass in season-long weedy no-preemergence treatment (Table 2). The second most dominant species was common lambsquarters, making up 26% of total weed density and 42% of total weed biomass in season-long weedy no-preemergence treatment (Table 2). Hairy nightshade [Solanum villosum (L.) Mill.] made up 21% of weed density in preemergence-applied season-long weedy plots; however, across the experiment hairy nightshade made small contributions to total weed biomass due to the low-statured growth habit of this species (Table 2).
There was considerable reduction in weed density and biomass in 2020 from the preemergence herbicide application. No-preemergence season-long weedy treatments had an average density of 41 plants m–2 compared to 1.4 plants m–2 when preemergence herbicides were applied (Table 2). Total weed biomass was reduced from 2,433 g m–2 in no-preemergence season-long weedy plots, to 429 g m–2 in preemergence-applied season-long weedy plots (Table 2). The composition of weed species was similar across weed removal timings in the 2020 growing season. However, in preemergence-applied season-long weedy plots, common lambsquarters made up 97% of total weed biomass, whereas Palmer amaranth made up 1%. This high abundance of common lambsquarters varies from other treatments in the experiment, where Palmer amaranth was the most dominant species (Figure 2).

Figure 2. Weed density in number of plants m–2 and weed biomass in g m–2 by species at weed removal timings, noted by dry bean growth stage for no-preemergence (no-PRE) and preemergence (PRE) treatments in 2020. ‘W’ represents season-long weedy control.
Common purslane and longspine sandbur [Cenchrus longispinus (Hack.) Fernald] were present in the experiment in 2020; however, they were not present in season-long weedy plots (Table 2, Figure 2). Their absence in season-long weedy plots is probably due to interspecific competition from taller-growing weed species such as Palmer amaranth and common lambsquarters that suppressed them. The only grass species present was longspine sandbur, which made up a minimal amount of total weed density and was not present in season-long weedy plots (Figure 2).
Dry Bean Yield
In the preemergence-applied weed-free treatment, dry bean yield was greater than in the no-preemergence weed-free treatment. Weed-free yield was 3,886 kg ha–1 and 5,466 kg ha–1 in preemergence-applied compared to 3,563 kg ha–1 and 5,145 kg ha–1 in no-preemergence in 2018 and 2020, respectively (Table 3). Even when diligent hand weeding was performed on no-preemergence weed-free plots, dry bean yield was reduced from the presence of newly emerged weeds before they could be removed by hand weeding. In no-preemergence plots dry bean yield reduction began before the V1 growth stage, as indicated by the decline of the modeled curve at the V1 weed removal in 2018 (Figure 3). In 2020, dry bean yield reduction began in no-preemergence plots near the R1 growth stage, where the model begins to decline (Figure 3). In preemergence-applied plots, yield reduction did not begin until near the R2 growth stage in 2018, and in 2020 yield reduction did not occur (Figure 3).
Table 3. Parameter estimates (b, c, d, and e) and standard errors (SE) of the four-parameter logistic model, for dry bean yield with (PRE) and without (no-PRE) pendimethalin + dimethenamid-P applied preemergence in 2018 and 2020. a
a Abbreviations: b, slope; c, lower limit; d, upper limit; e, ED50; GDDs, growing degree days, base 10 C.
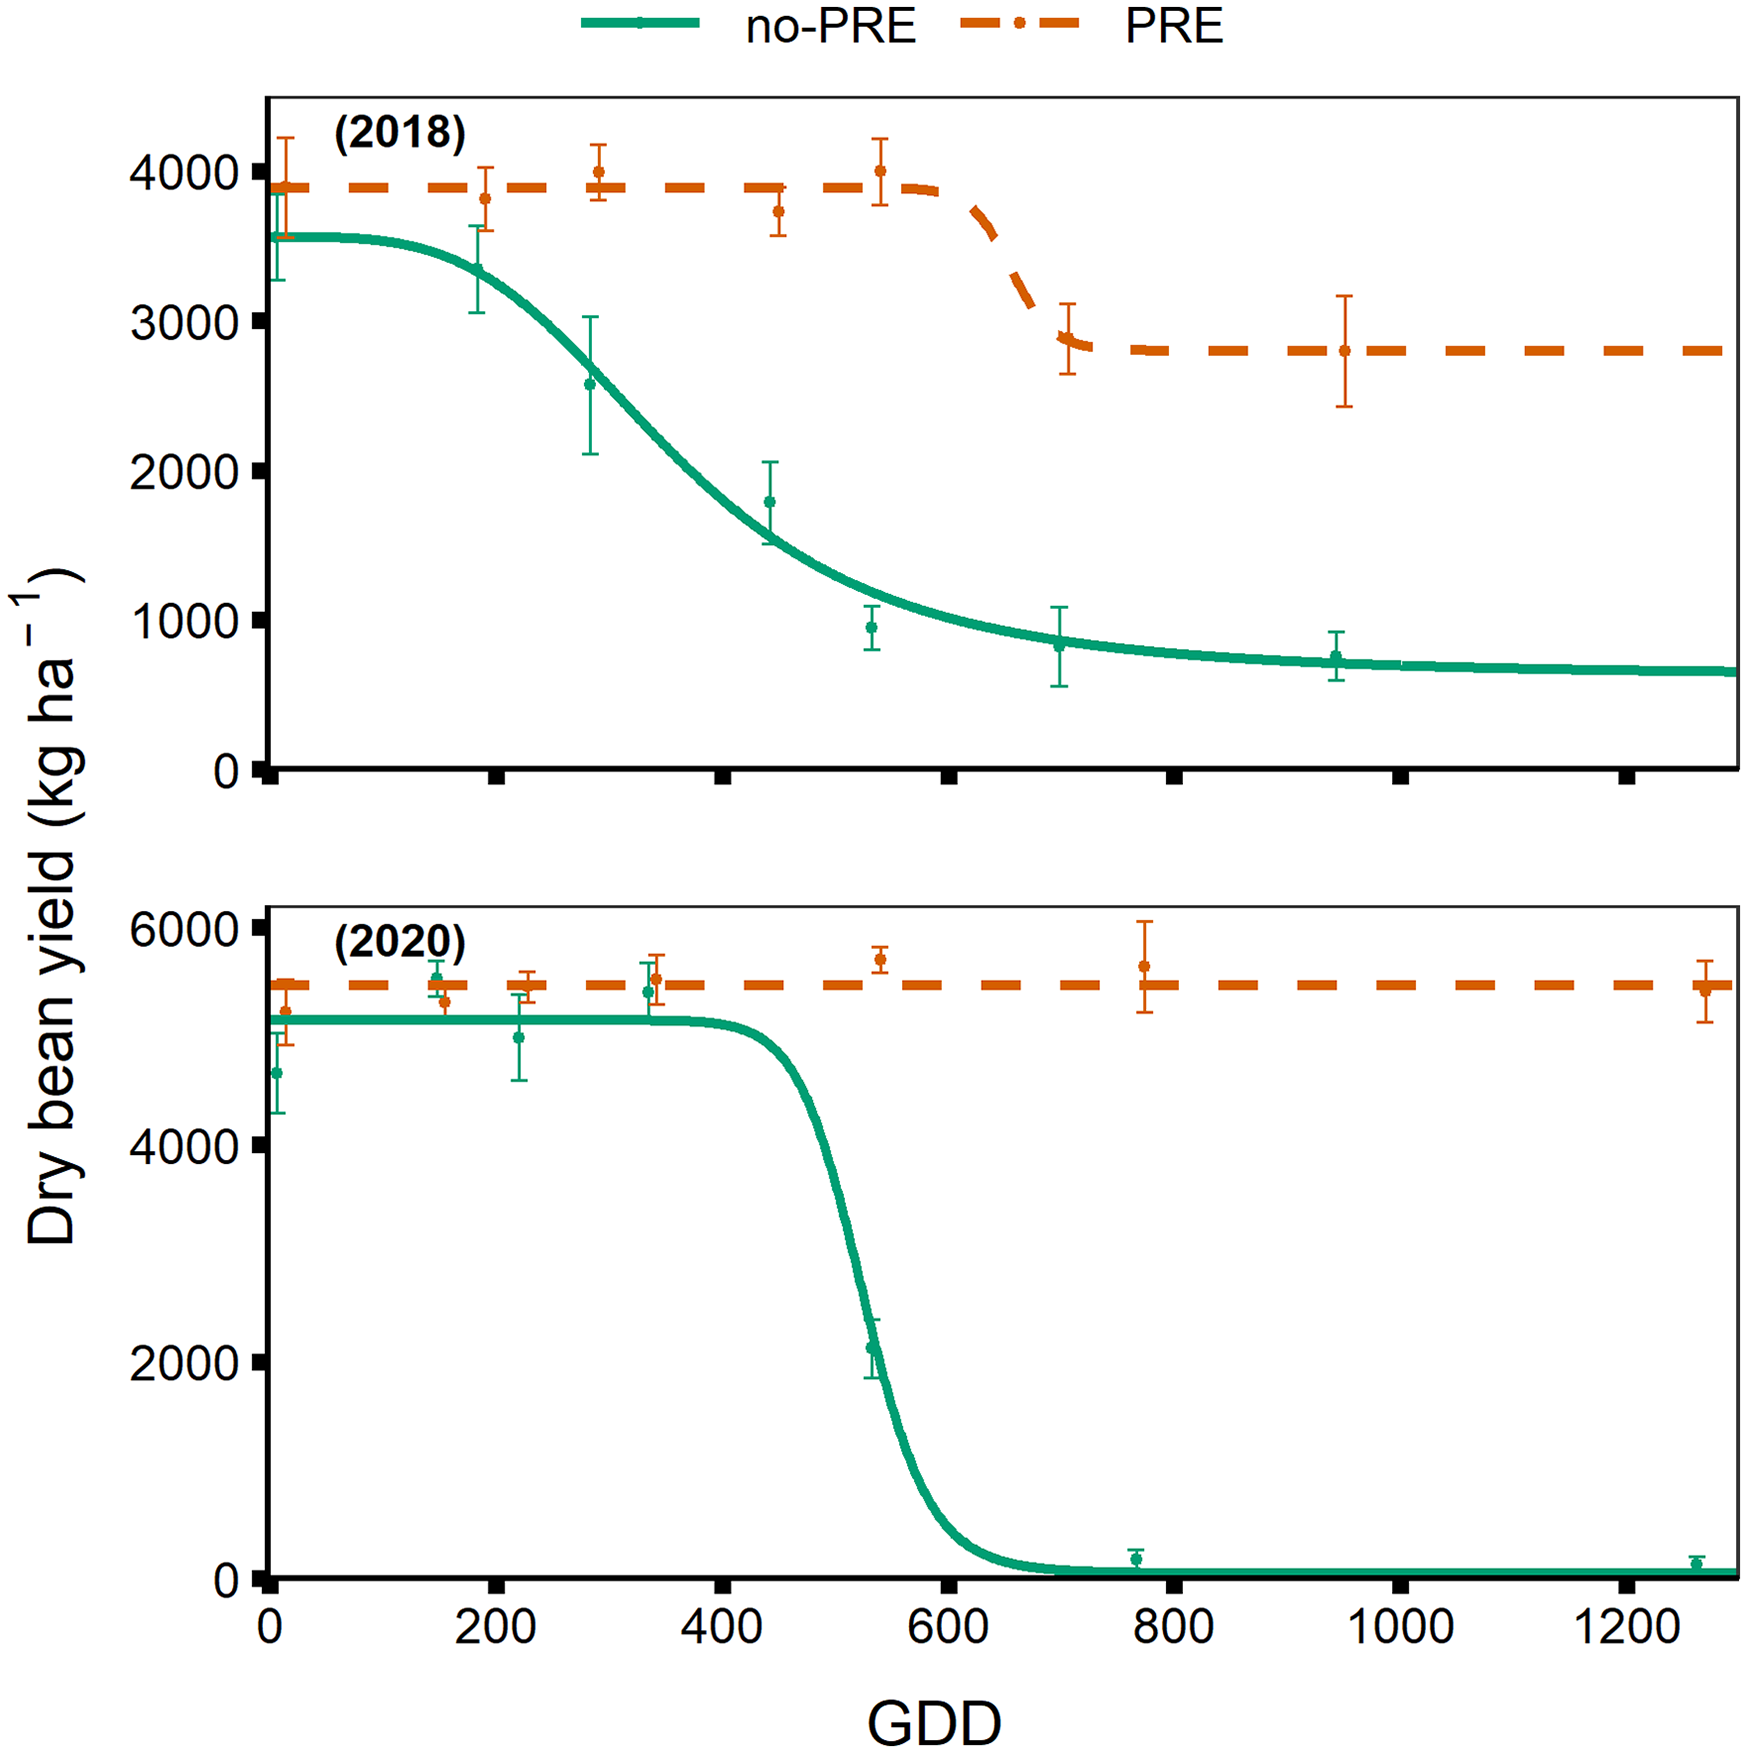
Figure 3. Dry bean yield in kg ha–1 in response to increasing duration of weed competition, presented by the number of growing degree days (GDD) accumulated after dry bean emergence, base 10C, for no-preemergence (no-PRE) and preemergence (PRE) treatments in 2018 and 2020.
Total dry bean yield of season-long weedy treatments in 2018 was considerably higher in preemergence-treated plots than no-preemergence plots—2,798 and 625 kg ha–1, respectively (Table 3). Season-long weed competition in no-preemergence plots reduced yield near 3,000 kg ha−1 and 5,100 kg ha–1 in 2018 and 2020, respectively; in contrast, preemergence-treated yield was reduced 1,000 kg ha−1 in 2018, and no reduction was observed in 2020 (Table 3). This reaffirms the importance of preemergence herbicides in minimizing dry bean yield loss due to weed competition (Pacanoski and Glatkova Reference Pacanoski and Glatkova2014).
Dry Bean Yield Components
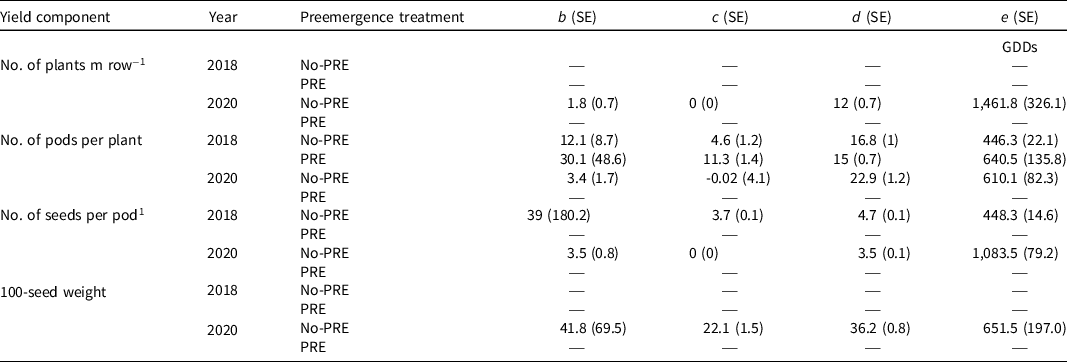
Dry bean stand was not affected by weed removal timing, and models failed a lack-of-fit test for both no-preemergence and preemergence in 2018 (Table 4). In 2020 there was an effect of weed removal timing on dry bean stand in no-preemergence (Table 4). Dry bean stand in the no-preemergence and preemergence treatments are both near 12 plants m–1 row in weed-free treatments (Figure 4). However, dry bean stand in the no-preemergence treatment was reduced with increasing duration of weed competition. When weeds were present until the R2 growth stage, stand was beginning to decline (Figure 4).
Table 4. Parameter estimates (b, c, d, and e) and standard errors (SE) of the four-parameter logistic model, for yield components of dry bean with (PRE) and without (no-PRE) pendimethalin + dimethenamid-P applied preemergence in 2018 and 2020. a
a Abbreviations: b, slope; c, lower limit; d, upper limit; e, ED50; GDDs, growing degree days, base 10 C.
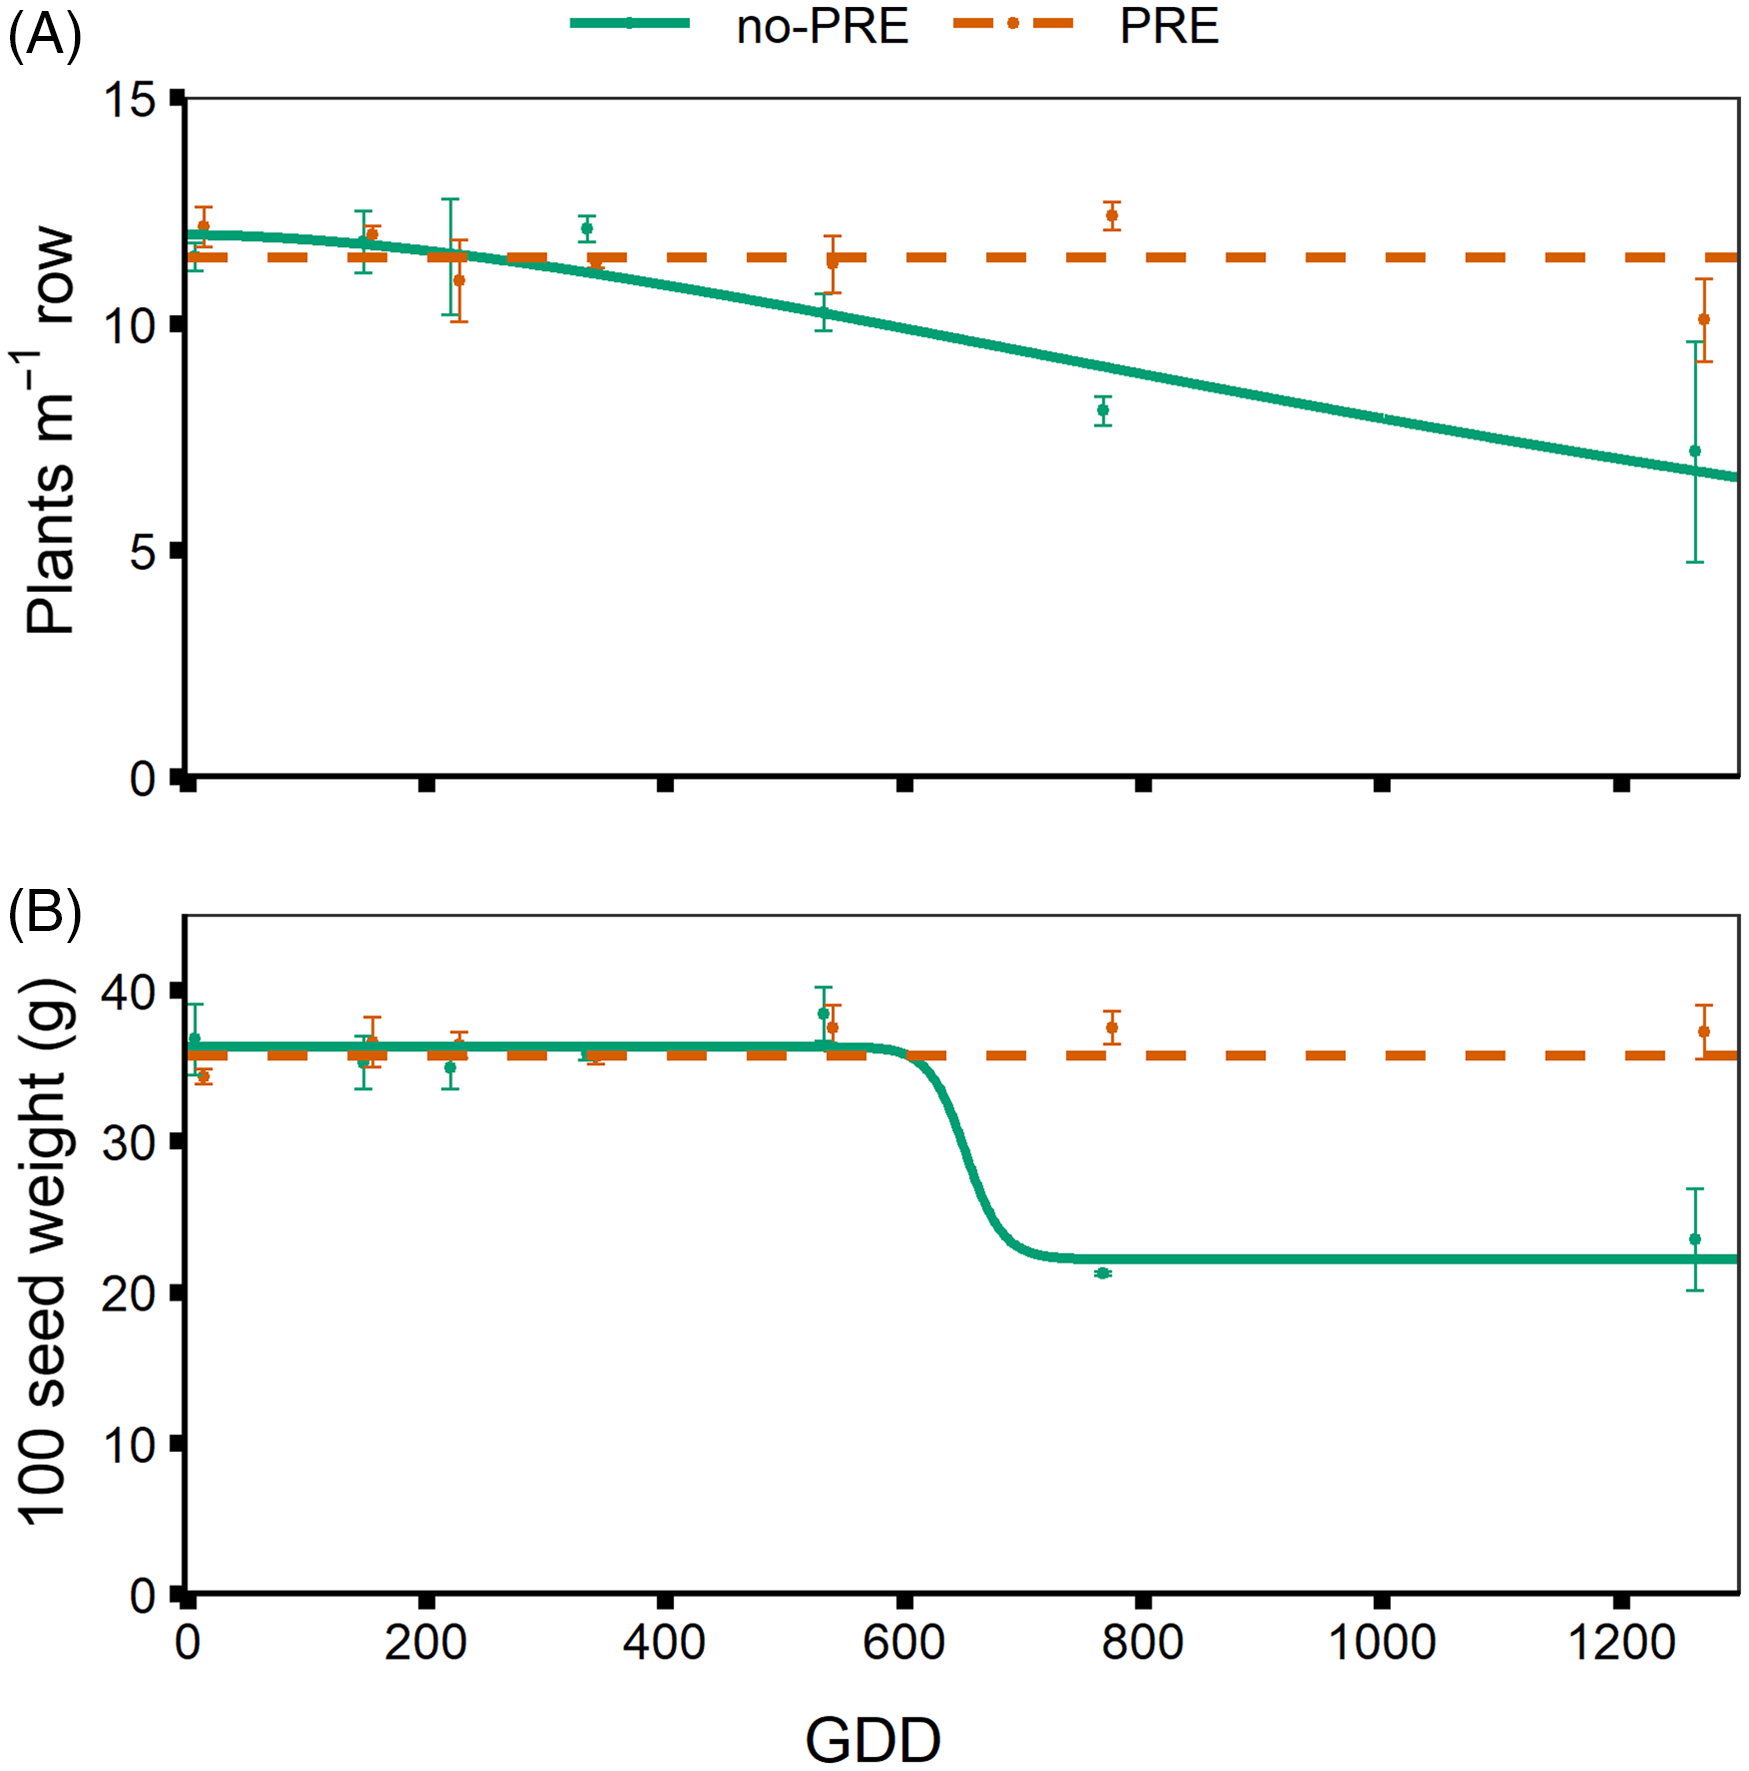
Figure 4. Dry bean yield components. (A) Average plant density (1,000 plants ha–1) in 2020, and (B) average 100-seed weight (g) in 2020 in response to increasing duration of weed competition, presented by the number of growing degree days (GDD accumulated after dry bean emergence, base 10 C, for no-preemergence (no-PRE) and preemergence (PRE) treatments.
Seed size as indicated by 100-seed weight was not affected by weed removal treatments in 2018, as models for no-preemergence and preemergence-applied treatments failed a lack-of-fit test (data not shown). There was an effect of weed removal treatment on 100-seed weight in no-preemergence plots in 2020 (Table 4). Reduction in 100-seed weight occurred between the R2 and R5 weed removal treatments in 2020 (Figure 4).
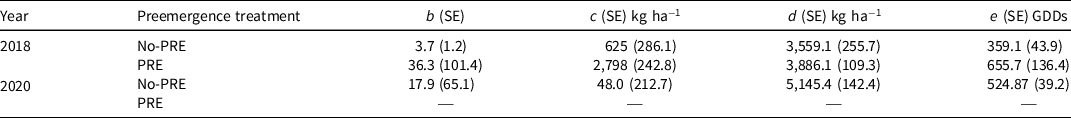
The number of pods per plant was affected by weed removal timing in both the no-preemergence and preemergence-applied plots (Table 4). In 2018, the average number of pods per plant was 16.8 in no-preemergence and 15 in preemergence-applied weed-free treatments (Table 4). The number of pods per plant in no-preemergence treatment began to decline after weed removal was delayed until the V3 growth stage, whereas in preemergence-applied treatments pods per plant did not decline until after the R2 growth stage was reached (Figure 5). This difference is further illustrated by the e parameters of the two models: 446 for no-preemergence and 640 for preemergence-treated (Table 4). In 2020, average number of pods per plant was near 23 for both no-preemergence and preemergence; however, number of pods per plant was reduced in no-preemergence between the V6 and R2 weed removal treatments, whereas weed removal timing did not influence number of pods per plant in preemergence-applied treatments (Figure 5).
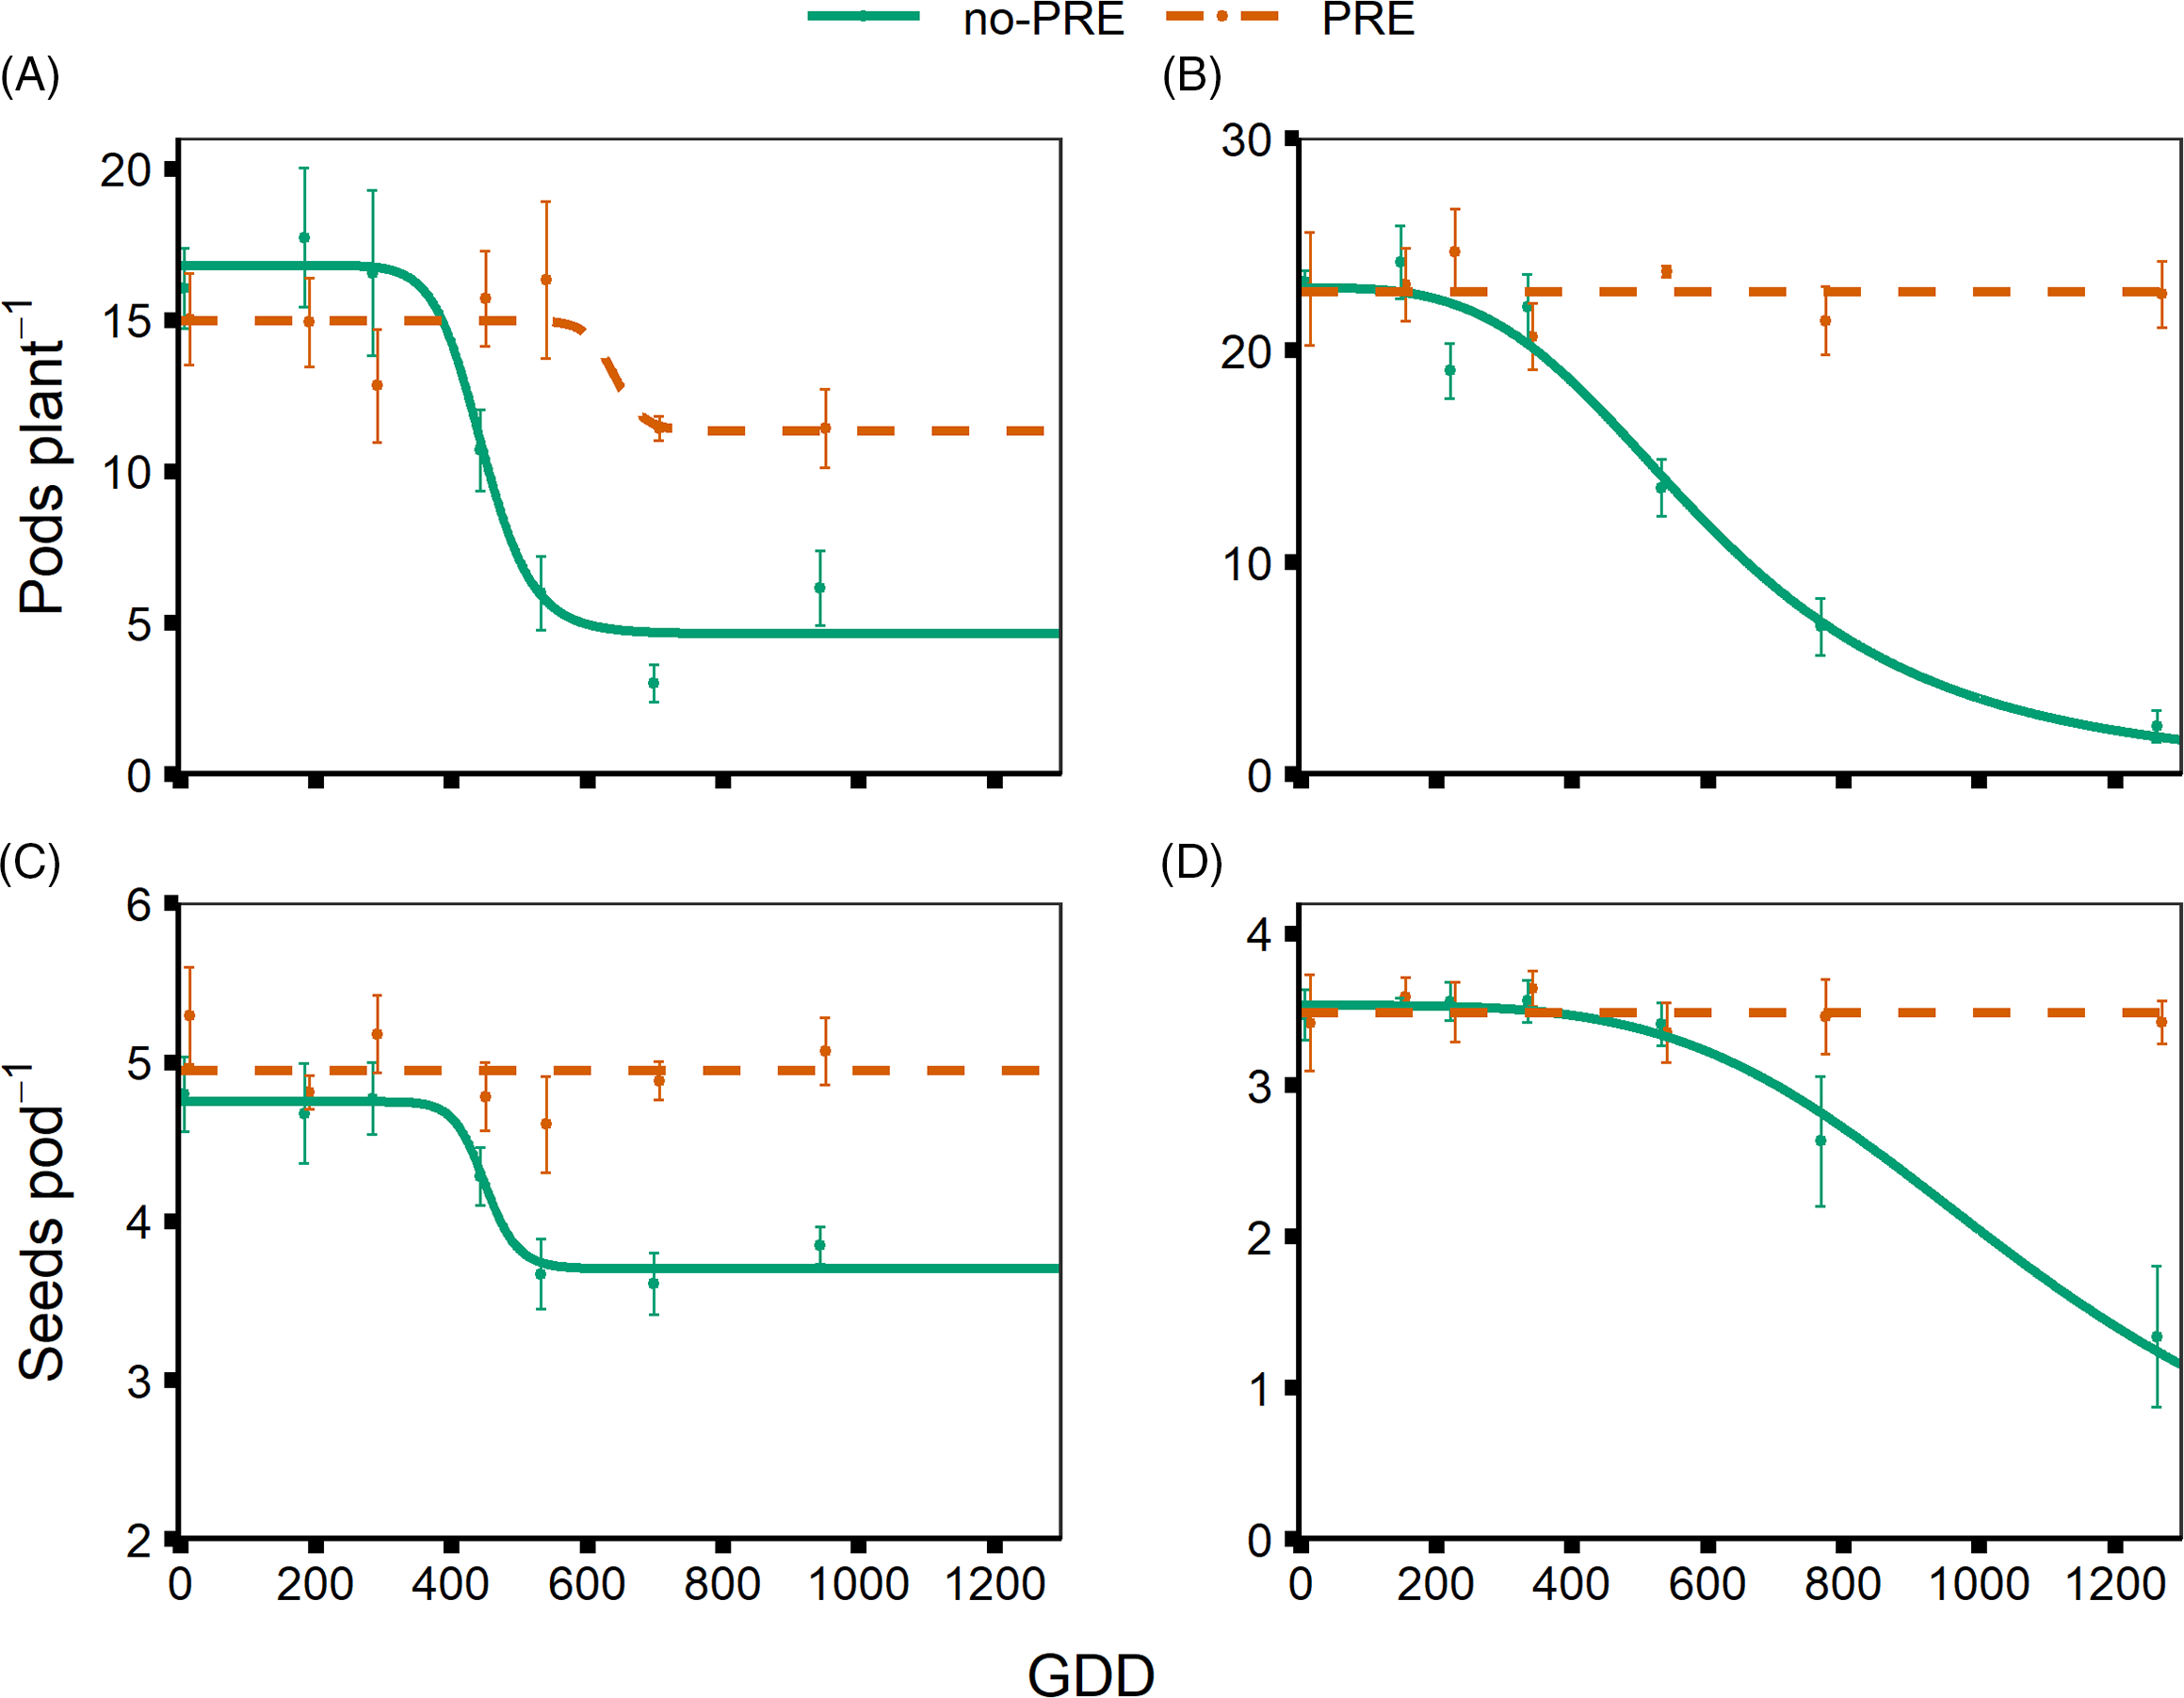
Figure 5. Dry bean yield components. Average number of pods per plant in (A) 2018 and (B) 2020, and average number of seeds per pod in (C) 2018 and (D) 2020 in response to increasing duration of weed competition, presented by the number of growing degree days (GDD accumulated after dry bean emergence, base 10C, for no-preemergence (no-PRE) and preemergence (PRE) treatments.
Comparing number of pods per plant response between the two growing seasons, reduction began earlier in the growing season in 2018 compared to 2020 (Figure 5). Further evidence of this effect can be seen in the e parameter of the two models, with 50% response occurring at 446 and 610 GDD after planting in 2018 and 2020, respectively (Table 4). These results agree with Woolley et al. (Reference Woolley, Michaels, Hall and Swanton1993) and Qasem (Reference Qasem1995), who observed that the average number of pods per plant was reduced by increasing the duration of time that weeds were allowed to compete with the crop. This response of dry bean to competition also agrees with Bennett et al. (Reference Bennett, Adams and Burga1977), who reported that competition in dry bean affects number of nodes per branch and number of branches per plant, both of which affect the number of pods per plant.
The number of seeds per pod was reduced in no-preemergence treatments with increasing duration that weeds remained in the dry bean crop in both seasons (Table 4). The number of seeds per pod was not affected by weed competition in preemergence-applied treatments, and the resulting models failed a lack-of-fit test (Figure 5). The average number of seeds per pod in preemergence-applied treatments was near the estimated d parameter for no-preemergence treatments, indicating that the number of seeds per pod was similar between herbicide treatments, until increasing duration of weed competition reduced the number of seeds per pod in no-preemergence treatments (Figure 5). In 2018, number of seeds per pod was reduced in no-preemergence treatments, near the V5 growth stage (Figure 5). In 2020, number of seeds per pod was reduced later in dry bean development, near the R5 growth stage (Figure 5). Further evidence can be seen in the e parameters of the models, with 50% reduction occurring at 448 and 1,084 GDD for 2018 and 2020, respectively (Table 4).
Dry Bean Yield Reduction
Dry bean yield reduction, as calculated based on reduction in yield compared to weed-free treatment, was influenced by preemergence application (Table 5). Dry bean yield was reduced in the no-preemergence treatments 83% and 99% in 2018 and 2020, respectively, when weeds were present season-long; compared to a 28% yield reduction in preemergence-applied treatments in 2018, when weeds were present season-long (Table 5, Figure 6). The ED50 values for yield reduction models for no-preemergence treatments are 359 and 531 GDD for 2018 and 2020, respectively, indicating that yield reduction began earlier in the 2018 growing season (Table 5, Figure 6). There was no yield reduction in preemergence-applied treatments when weeds were present season-long, in 2020. The application of a preemergence herbicide greatly reduced the negative effects of weed competition on yield, comparable to the findings of Knezevic et al. (Reference Knezevic, Pavlovic, Osipitan, Barnes, Beiermann, Oliveira, Lawrence, Scott and Jhala2019) in soybean.
Table 5. Parameter estimates (b, c, d, and e) and standard errors (SE) of the four-parameter logistic model, used to determine the critical time for weed removal for dry bean with (PRE) and without (no-PRE) pendimethalin (1,070 g ai ha−1) + dimethenamid-P (790 g ai ha−1) applied preemergence in 2018 and 2020. a

a Abbreviations: b, slope; c, lower limit; d, upper limit; e, ED50; GDDs, growing degree days, base 10C; YL, yield loss.
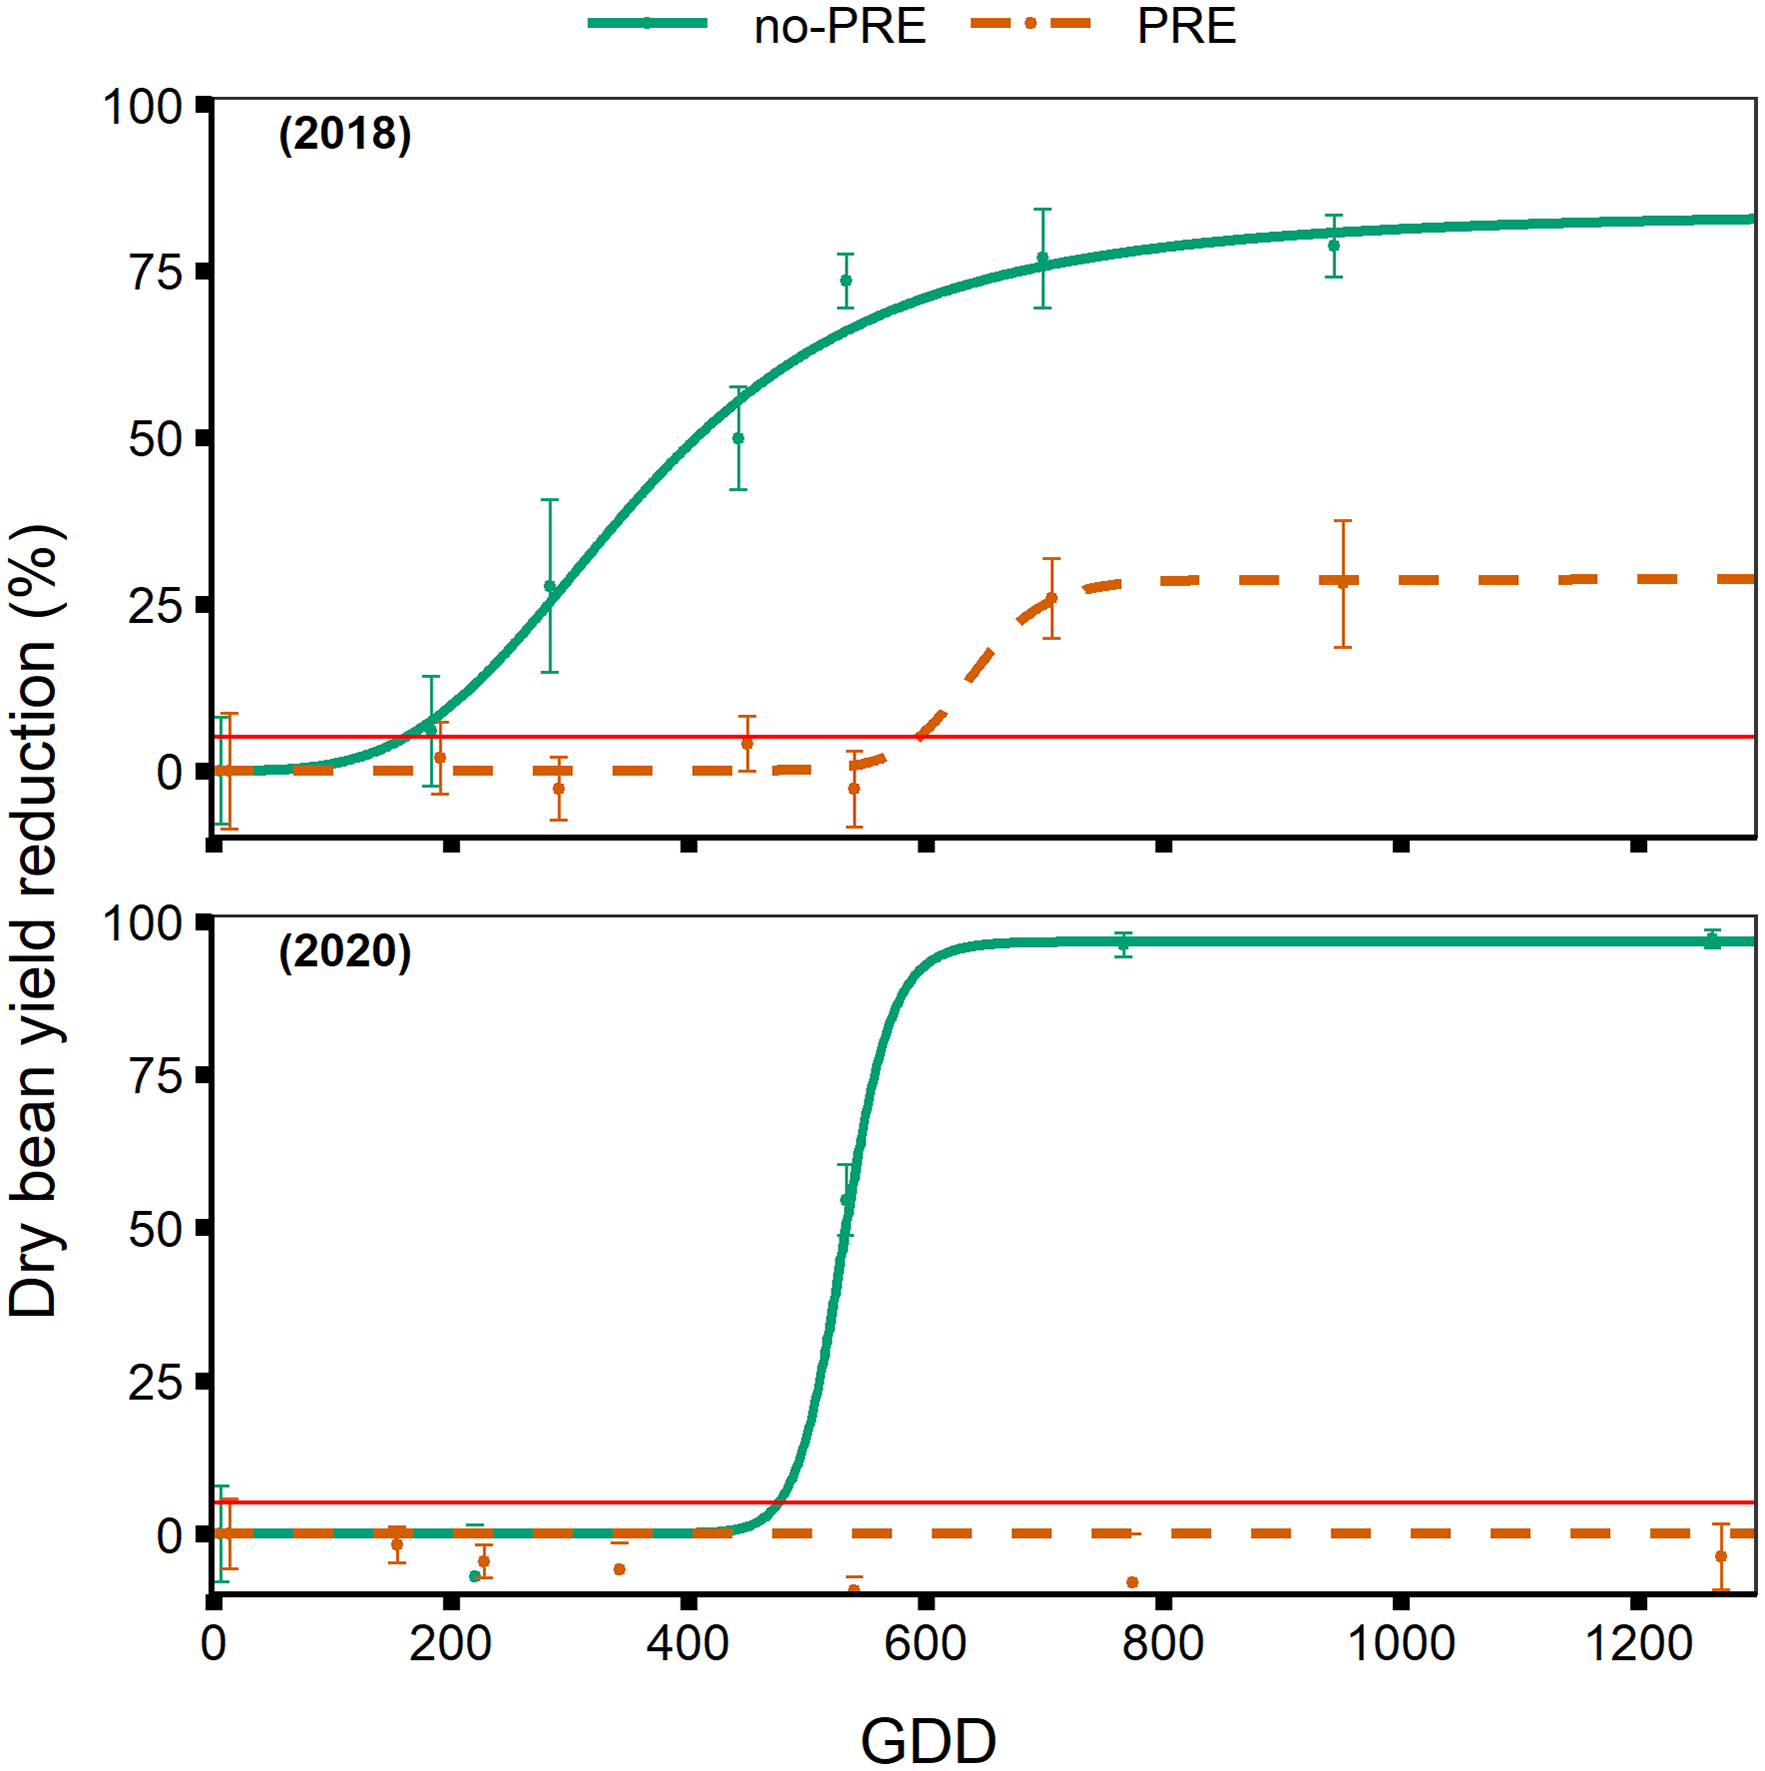
Figure 6. Dry bean yield reduction in % of the weed-free control yield, in response to increasing duration of weed competition, presented by the number of growing degree days (GDD) accumulated after dry bean emergence, base 10C, for no-preemergence (no-PRE) and preemergence (PRE) treatments in 2018 and 2020. The horizontal red line represents the 5% yield loss threshold utilized to calculate the critical timing of weed removal (CTWR).
Other studies have found similar levels of yield reduction of Phaseolus vulgaris L. as a result of season-long weed competition. Woolley et al. (Reference Woolley, Michaels, Hall and Swanton1993) observed 60% to 80% yield reduction from season-long weed competition compared to weed-free control. Burnside et al. (Reference Burnside, Wiens, Holder, Weisberg, Ristau, Johnson and Cameron1998) observed 50% to 100% yield reduction from season-long weed competition in two separate years. Qasem (Reference Qasem1995) reported 75% to 88% reduction of snap bean plant biomass, as a result of season-long weed competition. These studies agree with our estimates of 83% to 99% yield reduction from season-long weed competition, when preemergence herbicides are not utilized (Table 5).
Plants sense other plants growing nearby by the spectrum of light reflected from neighboring plants and undergo physiological changes in response to perceived light (Smith and Whitelam Reference Smith and Whitelam1997), deemed shade avoidance syndrome (Roig-Villanova and Martinez-Garcia Reference Roig-Villanova and Martinez-Garcia2016). This shade avoidance syndrome can cause yield reduction in a crop without resource competition taking place (Schambow et al. Reference Schambow, Adjesiwor, Lorent and Kniss2019).
Maintaining plots weed-free by hand weeding allows weeds to emerge before being removed, and therefore the crop could be affected by shade avoidance response. None of the reviewed literature on the CPWC in dry bean describes the utilization of soil-active herbicides in maintaining weed-free treatments, only hand weeding practices. This implies that other studies on the CPWC may have reduced yield in a weed-free treatment as a result of the presence of small emerging weeds. Furthermore, a reduction in the weed-free treatment yield leads to a lower estimate of total yield reduction from the presence of weed competition.
This study permitted our estimate of a yield reduction of 85% to 99% based on comparing the season-long weedy treatment with no-preemergence to the preemergence-applied weed-free treatment, in 2018 and 2020, respectively (Table 3). The preemergence-applied weed-free treatment is a truer representation of the full yield potential of dry bean, as the soil-active herbicide prevented early-season weed emergence and thereby reduced the effect of a shade avoidance response to reduce yield potential. Past studies could have potentially underestimated yield reduction, in that weed-free treatments allowed emerged weeds to cause a shade avoidance response.
Differences in dry bean yield reduction between the 2018 and 2020 growing seasons can be partially explained by the weed species at the experiment sites. Total weed biomass for season-long weedy treatments was near 500 g m–2 in 2018, compared to nearly 2,500 g m–2 in 2020 (Figures 1, 2). This drastic increase in weed biomass in 2020 explains why dry bean that developed with season-long weed competition showed a 99% yield reduction. The predominant weed species in 2020 were Palmer amaranth and common lambsquarters, which are known to be highly competitive weed species capable of accumulating excessive biomass.
Critical Time for Weed Removal
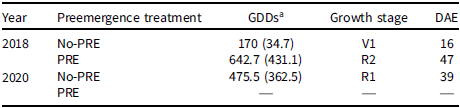
The CTWR, based on 5% yield reduction threshold, ranged from 16 DAE (170 GDD) in 2018, to 39 DAE (476 GDD) in 2020, when no-preemergence herbicide was applied (Table 6). The aforementioned weed removal times correspond to the V1 and R1 growth stages, respectively (Table 6). When preemergence herbicides were applied, the CTWR was delayed to 47 d after dry bean emergence (643 GDD) in 2018 (Table 6, Figure 6). CTWR for preemergence-applied dry bean could not be calculated in 2020 because of a lack of yield response from weed competition. The lack of yield response indicates that weed control provided by preemergence herbicides was sufficient such that dry bean did not suffer yield reduction from weeds that emerged after planting, in 2020.
Table 6. The critical time for weed removal (5% yield reduction threshold) in dry bean with (PRE) and without (no-PRE) pendimethalin + dimethenamid-P applied preemergence expressed in growing degree days (GDDs, base 10 C), crop growth stage, and days after crop emergence (DAE), in 2018 and 2020.
a Abbreviations: Standard error for GDDs is shown in parentheses.
The variation in CTWR in no-preemergence treatments is a large range in dry bean development; from the V1 to the R1 growth stage. This variation can be attributed to differences in weed density and emergence pattern. In 2018, weed density was near 1,200 plants m–2 at the V1 weed removal timing; this can be compared to 2020, when weed density was near 60 plants m–2 at the V1 weed removal timing and peaked at near 80 plants m–2 at the V3 weed removal timing. Comparing the two growing seasons, weed emergence was later and at a lower density than expected in 2020. Furthermore, the later planting date of dry bean in 2018, compared to 2020, allowed for weed emergence to begin earlier, relative to the emergence of dry bean.
The resulting CTWR from the no-preemergence treatment is comparable to the CTWR in other studies. Qasem (Reference Qasem1995) reported that the CTWR began 14 d after crop emergence, compared to Stagnari and Pisante (Reference Stagnari and Pisante2011), with 11 d after crop emergence. These calculated times are earlier, but comparable to our earliest result of 16 DAE. Woolley et al. (Reference Woolley, Michaels, Hall and Swanton1993) reported that weed removal should take place by the V2 dry bean growth stage and Mohamed (Reference Mohamed2012) 4 wk after planting. Both results are later than Qasem (Reference Qasem1995) and Stagnari and Pisante (Reference Stagnari and Pisante2011) but are between our CTWR estimates for two distinct growing seasons. Differences in the estimated CTWR are most likely due to differences in weed species composition or growing environment, as the research of Woolley et al. (Reference Woolley, Michaels, Hall and Swanton1993) was carried out in Ontario, and Mohamed (Reference Mohamed2012) did research in Sudan. The weed removal estimates from Burnside et al. (Reference Burnside, Wiens, Holder, Weisberg, Ristau, Johnson and Cameron1998), of 3 wk after planting agrees with our results as well. However, an estimate of weeks after planting is subject to be affected by emergence time of the crop, depending on soil moisture and temperature.
Management Implications
This research confirms the value of soil-active herbicides in dry bean production. Dry bean herbicides labeled for postemergence application for broadleaf weed control (such as imazamox, imazethapyr, bentazon, and fomesafen) do not allow application until the V1 growth stage. With the CTWR occurring as early as the V1 growth stage (Table 6), growers not utilizing soil-active herbicides are potentially sacrificing yield, even if effective weed control is implemented by a postemergence herbicide application at V1. Furthermore, the postemergence herbicides imazamox, imazethapyr, and fomesafen allow only a single application per growing season. Making a postemergence application at V1 would most likely lead to a situation later in the season in which late-emerging annual weed species are competing with dry bean and postemergence herbicide options have already been expended for the growing season.
With preemergence-applied soil-active herbicides delaying the CTWR until the R2 growth stage, there is an opportunity for a postemergence application of imazamox, imazethapyr, fomesafen, or bentazon to be applied between the V1 and R1 growth stages to control any emerged weeds. There is also opportunity to include dimethenamid-P with foliar-active postemergence-applied herbicides, between V1 and V3 growth stages to extend residual control, which has been shown to increase late-season weed control in soybean (Sarangi and Jhala Reference Sarangi and Jhala2018).
Acknowledgments
This research received no specific grant from any funding agency, commercial or not-for-profit sectors. The authors would like to acknowledge the contributions of the two anonymous reviewers for providing helpful and constructive feedback which improved the quality of this manuscript.
Conflicts of Interest
No conflicts of interest have been declared.


 Open access