


Introduction
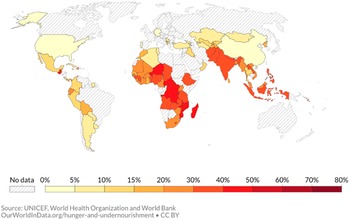
Undernutrition, including stunting, wasting, and micronutrient deficiencies, is prevalent among infants and young children in low- and middle-income countries (LMICs) and is associated with increased morbidity and mortality and delayed psychomotor and neurocognitive development (Black et al., Reference Black, Victora, Walker, Bhutta, Christian, de Onis, Ezzati, Grantham-McGregor, Katz and Martorell2013). Among children under 5 years of age globally, 22 % (149 million) were stunted and 6.7 % (45 million) were wasted in 2021 (WHO, Reference Bank2021). With high rates of stunting, and associated infant mortality, LMICs, especially in Sub-Saharan Africa and South Asia bear the largest burden (UNICEF, 2021; see Figure 1).

Figure 1. Percentage of children under 5 years of age being stunted: 2020.
The 2012 World Health Assembly tackled the crucial issue of undernutrition by aiming “to reduce the number of stunted children under 5 by 40 % by 2025.” This commitment was reinforced by the global Sustainable Development Goal 2, target 2, the objective of which is to, “By 2030, end all forms of malnutrition, including achieving, by 2025, the internationally agreed targets on stunting and wasting in children under five years of age, and address the nutritional needs of adolescent girls, pregnant and lactating women and older persons” (United Nations, 2015). However, there has not been sufficient progress in reducing the rates of stunting and wasting across the world, and the progress has been hampered even more with the disruptions due to the COVID-19 pandemic.
The consequences of childhood stunting―being short for one’s age―has life-long impacts not just on health but also on human capital and economic growth at the individual, household, and national levels. Being stunted in early childhood is associated with slower cognitive development and lower IQ scores, and reduced schooling attainment by 1 year (Martorell et al., Reference Martorell, Horta and Stein2010), and lowers adult income by 5 to 53 % (Hoddinott et al., Reference Hoddinott, Maluccio, Berhman, Flores and Martorell2008, Hoddinott et al., Reference Hoddinott, Maluccio and Behrman2011). Consequently, reductions in stunting prevalence can increase economic productivity by 4 % to 11 % in Africa and Asia (Horton & Steckel, Reference Horton, Steckel and Lomborg2013).
While the etiology of stunting and wasting is complex and could be due to a multitude of factors, inadequate nutrition and poor dietary intake play a crucial role, particularly in a child’s first 1,000 days. This includes the period just before conception up to 2 years of age (Dewey et al., Reference Dewey, Arnold and Wessells2022). Early childhood, therefore, is a critical window during which the nutrition of the mother and the early life nutrition of the child have a substantial impact on the child’s future physical and mental health. Undernutrition during this period is related to poor outcomes in overall health, neurobehavioral and cognitive development, and educational and economic attainment later in life (Victora et al., Reference Victora, Adair, Fall, Hallal, Martorell, Richter and Sachdev2008).
Maternal and child nutrition research has had a rapid development over the last decade with large-scale effectiveness studies and developments in innovations and improved nutritional commodities. Evidence on the effectiveness of antenatal multiple micronutrient (MMN) supplementation in reducing the risk of stillbirth, low birthweight, and babies born in small-for-gestational age (SGA) has strengthened. Evidence continues to support the provision of supplementary food in food-insecure settings and community-based approaches with the use of locally produced supplementary and therapeutic food to manage children with acute malnutrition. Some emerging interventions, such as preventive small-quantity lipid-based nutrient supplements (SQ-LNS) for children aged 6–23 months, have also shown positive effects on child growth (Keats et al., Reference Keats, Das, Salam, Lassi, Imdad, Black and Bhutta2021).
Interventions to improve complementary feeding practices include education and promotion or provision of food for children aged 6–24 months. The interventions have been found to improve various nutrition indicators (Imdad et al., Reference Imdad, Yakoob and Bhutta2011; Abdurahman et al., Reference Abdurahman, Chaka, Bule and Niaz2019; Lassi et al., Reference Lassi, Rind, Irfan, Hadi, Das and Bhutta2020; Keats et al., Reference Keats, Das, Salam, Lassi, Imdad, Black and Bhutta2021). Updated evidence supports the use of maternal MMN supplementation to improve birth and child health outcomes in LMICs, when compared with iron and folic acid (IFA) alone. Benefits include reduced risk of stillbirth, low birthweight, preterm birth, and babies born SGA (Oh et al., Reference Oh, Keats and Bhutta2020). In addition, there was a greater effect on low birthweight with the use of the UN International Multiple Micronutrient Antenatal Preparation (UNIMMAP) with 15 micronutrients compared with MMN formulations that comprised only three to four micronutrients.
Preventive SQ-LNS have been extensively evaluated in the past 15 years. Experimental studies showed that when SQ-LNS is used as a daily point-of-use fortification for complementary foods, it consistently reduces severe and moderate wasting, underweight, stunting, anemia, and mortality for the complementary feeding age group. The evidence from LMICs suggests that SQ-LNS provided during complementary feeding to children aged 6–24 months, compared with no intervention, reduces the prevalence of severe and moderate stunting, moderate wasting, and moderate underweight (Das et al., Reference Das, Salam, Hadi, Sheikh, Bhutta, Weise Prinzo and Bhutta2019). A separate meta-analysis of 13 trials found that the risk of all-cause mortality was reduced by 27 % (11–41) among children taking SQ-LNS (Stewart et al., Reference Stewart, Wessells, Arnold, Huybregts, Ashorn, Becquey, Humphrey and Dewey2020).
This paper assesses the costs and benefits of three nutrition interventions:
-
1) Provision of preventive SQ-LNS to children 6–23 months of age.
-
2) Complementary Feeding Promotion (CFP) for children 6–23 months of age.
-
3) Provision of MMN and calcium (Ca) supplements to pregnant women.
The target group for the first two interventions is children in the 40 low- and lower middle-income countries (LI-LMIs) with the highest rates of stunting prevalence. These countries, while accounting for only 37 % of the world’s population, are home to 75 % of stunted children globally.
Within these countries, the SQ-LNS intervention is targeting children in the 60 % of the population with the lowest socio-economic status (SES) while the CFP intervention is modeled for both targeting the children in the three lowest SES quintiles and the children in the two highest SES quintiles.
The third intervention replaces iron and folic acid (IFA) with MMN and additionally provides Ca supplements. The intervention targets 40 % of pregnant women annually in LI-LMI countries. This is the percentage of pregnant women that currently take IFA supplementation (36 million women) mainly delivered through antenatal care (ANC) services.
Intervention 1: Provision of preventive SQ-LNS to children 6–23 months of age
This intervention targets children in the 60 % of the population with the lowest SES in each of the 40 LI-LMIs with the highest rates of stunting prevalence. Thus SQ-LNS would be provided preventively to the cohort of 41 million children annually for 18 months once they are six months of age. Preventive SQ-LNS consists of 100–120 kcal per child per day and multiple micronutrients and proteins. The stunting prevalence rate among children under 5 years of age in the target group was 41 % in 2020 compared to 30 % in all LMICs.Footnote 1
Intervention cost
The cost of preventive SQ-LNS, including cost of delivery to mothers and caretakers of the children, is estimated at US$ 4.37 per child per month (Adams et al., Reference Adams, Vosti, Arnold, Engle-Stone, Prado, Stewart, Wessells and Dewey2022). This amounts to US$ 79 per child over a duration of 18 months, or US$ 3.25 billion per annual birth cohort for the target group.
Intervention benefits
The benefits to young children of preventive SQ-LNS include reduced risk of mortality, anemia, developmental disability, and stunting and wasting (Das et al., Reference Das, Salam, Hadi, Sheikh, Bhutta, Weise Prinzo and Bhutta2019; Stewart et al., Reference Stewart, Wessells, Arnold, Huybregts, Ashorn, Becquey, Humphrey and Dewey2020; Keats et al., Reference Keats, Das, Salam, Lassi, Imdad, Black and Bhutta2021; Dewey et al., Reference Dewey, Stewart, Ryan Wessells, Prado and Arnold2021a; Adams et al., Reference Adams, Vosti, Arnold, Engle-Stone, Prado, Stewart, Wessells and Dewey2022). A recent cost-effectiveness analysis of preventive SQ-LNS found that reduction in anemia and developmental disability constituted less than 6 % of total disability adjusted life years (DALYs) averted with a reduction in mortality accounting for over 94 % (Adams et al., Reference Adams, Vosti, Arnold, Engle-Stone, Prado, Stewart, Wessells and Dewey2022).Footnote 2 We therefore assessed the benefits of preventive SQ-LNS in terms of reduced risk of stunting and mortality. We did not include reduced risk of wasting to avoid any potential double counting.Footnote 3 Our estimate of benefits may therefore be considered conservative.
A review of available studies found that preventive SQ-LNS for children 6–23 months of age reduces the prevalence of moderate stunting by 7 % and severe stunting by 15 % compared with no intervention (Das et al., Reference Das, Salam, Hadi, Sheikh, Bhutta, Weise Prinzo and Bhutta2019). Dewey et al. (Reference Dewey, Wessells and Arnold2021b) found an overall reduction in moderate and severe stunting of 12 %. Dewey et al. (Reference Dewey, Arnold and Wessells2022) found a reduction in severe stunting of 17 %. We apply the effect sizes from Das et al. because Dewey et al. (Reference Dewey, Wessells and Arnold2021b) do not report separate effect size for moderate and severe stunting separately and Dewey et al. (Reference Dewey, Arnold and Wessells2022) do not report effect size for moderate stunting. Using Das et al., gives an overall reduction in moderate and severe stunting of 9.1 % from 41 % to 37 % prevalence in the intervention target group. Provision of preventive SQ-LNS is therefore expected to reduce stunting among children in the target group by 1.55 million cases. The reduction would be 1.64 million if the reduction in severe stunting is 17 %.
The effect of preventive SQ-LNS on mortality is assessed by two methods. The first method “indirect mortality effect” estimates mortality reduction from the effect of stunting reduction from SQ-LNS on mortality using relative risks of mortality from stunting reported by Olofin et al (Reference Olofin, McDonald, Ezzati, Flaxman, Black, Fawzi, Caulfield and Danaei2013) (see Table 1). The second method “direct mortality effect” applies the findings from a meta-analysis of randomized controlled trials on the effect of SQ-LNS on all-cause mortality in children 6–24 months of age. The meta-analysis found an 18 to 27 % reduction in all-cause mortality (Stewart et al., Reference Stewart, Wessells, Arnold, Huybregts, Ashorn, Becquey, Humphrey and Dewey2020).
Table 1. Relative risk of mortality from stunting in children under 5 years of age

Note: ALRI is acute lower-respiratory infections. Other infectious diseases included here are tuberculosis and meningitis. Severe stunting refers to a HAZ less than −3. Moderate stunting refers to a HAZ between −2 and −3. Mild stunting refers to a HAZ between −1 and −2. Relative risks are in relation to stunting according to the WHO Child Growth Standards. Source: Olofin et. al. (Reference Olofin, McDonald, Ezzati, Flaxman, Black, Fawzi, Caulfield and Danaei2013).
Baseline mortality among children 6–23 months in the 40 LI-LMI countries is from the Global Burden of Disease (GBD) 2019. These mortality figures are adjusted by the difference in mortality rates across SES quintiles from DHS surveys in the target countries in order to arrive at baseline mortality among children in the three lowest and two highest SES quintiles.
The indirect method following Olofin et al. (Reference Olofin, McDonald, Ezzati, Flaxman, Black, Fawzi, Caulfield and Danaei2013) indicates that 15,000–27,000 deaths can be averted annually by the provision of SQ-LNS to children 6–23 months of age, while the direct method following Stewart et al. (Reference Stewart, Wessells, Arnold, Huybregts, Ashorn, Becquey, Humphrey and Dewey2020) indicates that 104,000–155,000 thousand deaths can be averted (see Table 2).
Table 2. Estimated annual deaths averted from SQ-LNS provision to children 6–23 months of age: 2023

Source: Estimates by the authors.
We consider the estimates of averted deaths by the direct method more likely than the estimates by the indirect method for two reasons: One, the direct method is based on studies specifically assessing SQ-LNS and mortality risk reduction. Two, mortality risk reduction from SQ-LNS likely extends beyond mortality risk among stunted children considered by the indirect method. The monetized benefit–cost analysis that follows is based on the mortality reduction benefits estimated by the direct method.
Averted cases of stunting are valued by a 30 % increase in lifetime income relative to a person who became stunted in early childhood. Lifetime income is estimated separately for individuals from the three lowest SES quintiles (see Annex). Averted cases of deaths are valued using a ‘value of statistical life year’ (VSLY) at 1.55 times GDP per capita in 2022 and rising to 2.9 times GDP per capita in 2090 (see Annex).
Total annual benefits of providing SQ-LNS to the target group of children are US$ 1.0–11.8 billion for averted stunting and US$ 26.5–39.8 billion for averted mortality. We choose the 27 % reduction in all-cause mortality as base case. Total annual benefits in the base case are US$ 44.5 billion with 8 % discount rate. Nearly 90 % of the benefits are from mortality reduction and 10 % from lifetime productivity gains (see Table 3).
Table 3. Estimated annual benefits of SQ-LNS provision to children 6–23 months of age: 2023

Note: No discounting of mortality benefits is undertaken because averted deaths would have occurred in the same or subsequent year of SQ-LNS provision. Source: Estimates by the authors.
Benefit–cost ratios
The total cost of SQ-LNS provision to 60 % of children 6–23 months of age in the 40 LI-LMI countries with the highest prevalence rates of stunting amounts to US$ 3.2 billion per year. Total benefits in the base case with 27 % all-cause mortality reduction are US$ 41–52 billion per year depending on the discount rate applied to lifetime income gains from averted stunting. The BCR for the base case with 8 % discount rate is 13.7, in other words, the benefits are over 13 times the cost (see Table 4).
Table 4. Total annual benefits and costs of SQ-LNS provision to children 6–23 months of age: 2023

Source: Estimates by the authors.
Intervention 2: Complementary Feeding Promotion for children 6–23 months of age
Assessment of benefits and costs is undertaken for Complementary Feeding Promotion (CFP) interventions targeting two distinct groups:
-
i) CFP with a cash transfer component to mothers and caretakers in the 60 % of the population with the lowest SES in each of the 40 LI-LMI countries with the highest rates of stunting prevalence.
-
ii) CFP without a cash transfer to mothers and caretakers in the 40 % of the population with the highest SES in the 40 LI-LMI countries.
The rationale for the cash transfer component for the lowest SES population is that their households are often resource poor and cannot readily afford nutritious food in adequate quantity and appropriate dietary diversity for their children, and/or they may have other intra-household resource allocation priorities. CFP with a cash transfer component may therefore also be able to spur improvements in complementary feeding at least in some food-insecure households. A cash transfer allows households flexibility to obtain the necessary dietary diversity and quantity of each food item and has been found to be more effective for the prevention of stunting than a standard food package (Ahmed et al., Reference Ahmed, Hoddinott and Roy2019).
Nearly 30 % of stunted children in the 40 targeted LI-LMI countries live in households in the 40 % of the population with the highest SES according to our analysis of recent DHS surveys. These children therefore also constitute an important group for nutrition interventions. The income in the two richest quintiles of the population in LI-LMI countries is on average three times higher than the average income in the three poorest quintiles according to our analysis of data from the World Bank (World Bank, 2022). A cash transfer component is therefore not included for this target group because they are in a much better position to improve complementary feeding than the 60 % poorer households.
The CFP intervention modeled here consists of interpersonal complementary feeding education and counseling to mothers and caretakers of children over an 18-month period from the age of 6 to 23 months. Mothers and caregivers who respond positively to the intervention increase the quantity and dietary diversity of complementary food that they provide to their children to partially or fully bridge the gap between pre-intervention and recommended complementary feeding.
The average incremental complementary food provided by the mothers and caretakers who respond positively to the intervention is assumed to be 250 kcal of nutrient-adequate food per child per day. This quantity of kcal is similar to the incremental complementary feeding found by Ahmed et al. (Reference Ahmed, Hoddinott and Roy2019) as a result of a behavioral change communication (BCC) and cash transfer intervention in a resource poor setting in Bangladesh. This incremental food is provided and its cost is borne by the children’s household.
However, nearly half of stunted children in the three lowest SES quintiles are severely stunted while a little more than one-third are severely stunted in the two highest SES quintiles according to our analysis of recent DHS surveys in the 40 LI-LMI target countries. We therefore assume that mothers and caretakers who respond positively to the intervention provide 125 kcal of nutrient-adequate food per child per day.
Intervention cost
The cost of CFP includes the promotion program cost and the time spent by mothers and caregivers on complementary feeding education sessions. The intervention does not include provision of complementary food by the promotion program. However, mothers and caretakers responding to the CFP will increase the amount and dietary diversity of complementary food they give to their children. This private cost is also included in the total cost of the intervention.
Panjwani and Heidkamp (Reference Panjwani and Heidkamp2017) reported four studies of CFP interventions on child growth and stunting. The intervention in these studies ranged from three home visits over 30 weeks (Saleem et al., Reference Saleem, Mahmud, Baig-Ansari and Zaidi2014) to initial group meetings, individual counseling, and five home visits over 15 months (Zhang et al., Reference Zhang, Shi, Chen, Wang and Wang2013) to 30 biweekly home visits over 12 months (Vazir et al., Reference Vazir, Engle, Balakrishna, Griffiths, Johnson, Creed-Kanashiro, Fernandez Rao, Shroff and Bentley2013). The last study involved an improvement in nutrition education at government health facilities and eight home visits over 18 months (Penny et al., Reference Penny, Creed-Kanashiro, Robert, Narro, Caulfield and Black2005). Thus the range in frequency of visits is from one visit per 2 weeks to one visit per 2.5–3 months.
For the CFP targeting the two highest SES quintiles, with better educated mothers and caretakers and higher household income, we model the cost of one visit per 2 months over 18 months with 1 h of healthcare worker’s (HCW) time per visit. The cost of HCWs is based on estimated annual average labor income in the target countries.
For CFP targeting the three lowest SES quintiles, we rely on Ahmed et al. (Reference Ahmed, Hoddinott and Roy2019) that included a BCC intervention with complementary feeding education in a resource poor setting with 1 h group sessions per week.
The cost of mothers’ and caregivers’ time is assumed to be 50 % of average female wage rate. Female wage rate is estimated separately for the three lowest and two highest income quintiles. Cost of the CFP program, including mothers’ and caregivers’ time, is US$ 61.50 and US$ 18.65 per child over the intervention period for children in the three lowest and two highest SES quintiles, respectively (Table 5).
Table 5. Cost of CFP (US$ per child)

Source: Estimates by the authors.
The cost of an increased amount and improved nutritional value of complementary food provided by mothers and caretakers to their children is from Bai et al. (Reference Bai, Alemu, Block, Headey and Masters2021). Bai et al. estimated the cost of nutrient-adequate food at US$ 1.13 per day per adult woman in LI-LMI countries in 2011. Assuming a daily energy requirement of 2,300 kcal for adult women, 1,000 kcal for children 6–23 months of age, and a complementary feeding deficit of 25 % (250 kcal) for children in the three lowest SES quintiles whose mothers and caretakers respond to the promotion program, the cost of incremental complementary feeding by mothers and caretakers in 2011 was US$ 67.2 per child over 18 months. Applying the food price index by the Food and Agriculture Organization (FAO) from 2011 to 2022 brings the cost to US$ 71 per child.Footnote 4
As mentioned, 250 kcal is about the same as the increased amount found by Ahmed et al. (Reference Ahmed, Hoddinott and Roy2019) as a result of BCC for improved complementary feeding with a cash transfer component in a resource poor setting. For children from the two highest SES quintiles, we assume that the response is half the amount, or 125 kcal at half the cost per child, or US$ 36 per child because the complementary feeding gap is likely to be less than among children from the lowest SES quintiles, and the share of stunted children being severely stunted is substantially less among children from the two highest SES quintiles.
While the cost per child of the CFP program is for all children in the target group, the cost of incremental complementary food is only for those children whose mothers and caregivers respond to the promotion. We assume that the response rate is the same as the stunting prevalence rate, or 41 % and 26 % among children in the three lowest and two highest SES quintiles, respectively. This totals 24 million children each year. Assigning the cost of program promotion and the cost of incremental and more dietary diverse complementary food to these children brings the cost to US$ 221 and US$ 108 per child in the three lowest and two highest SES quintiles, respectively, for the 18 months of complementary feeding period.
Intervention benefits
We assess the benefits of CFP in terms of reduced risk of stunting and mortality. A recent systematic review found that Complementary Feeding Promotion for children 6–23 months increases height-for-age z-scores (HAZ) by 0.25 in food-secure settings through education and counseling of mothers and caretakers (Lassi et al., Reference Lassi, Rind, Irfan, Hadi, Das and Bhutta2020). A previous systematic review and meta-analysis found increased length-for-age z-scores (LAZ) of 0.22 in food-secure settings from studies that used the WHO growth standard (Panjwani & Heidkamp, Reference Panjwani and Heidkamp2017). A most recent systematic review and meta-analysis of behavioral change communication (BCC) interventions found a HAZ effect of 0.19 from 26 studies of CFP but did not distinguish between food-secure and -insecure settings (Mahumud et al., Reference Mahumud, Uprety, Wali, Renzaho and Chitekwe2022). Ahmed et al. (Reference Ahmed, Hoddinott and Roy2019) found a HAZ effect of 0.25 in a resource poor setting from a BCC with complementary feeding education and a cash transfer component of a size that made incremental and nutritious complementary feeding affordable.
We therefore chose to apply an effect size of 0.25 for children in the three lowest SES quintiles combined with a cash transfer, and an effect size of 0.25 for children in the two highest SES quintiles because most of the households in this group are likely to be food secure and can respond to the CFP.
Applying a z-score normal distribution, the baseline stunting prevalence rates, and a HAZ effect size of 0.25 gives an estimated reduction in stunting prevalence of 23 % from 41 % to 32 % among children in the three lowest SES quintiles and 29 % reduction from 26 % to 19 % among children in the two highest SES quintiles. CFP is therefore expected to reduce stunting among children by 3.9 million and 2.0 million cases in the two target groups.
The effect of CFP on mortality is assessed by two methods: an indirect effect of stunting on mortality following the approach in Olofin et al. (Reference Olofin, McDonald, Ezzati, Flaxman, Black, Fawzi, Caulfield and Danaei2013), and a direct effect of CFP on all-cause mortality following Stewart et al. (Reference Stewart, Wessells, Arnold, Huybregts, Ashorn, Becquey, Humphrey and Dewey2020). The two methods give fairly similar results (Table 6). This is because the mortality reduction of 18–27 % by the direct method is calculated only among children whose mothers and caretakers respond to the CFP and not the whole target group. This may be a conservative approach. The difference in estimated mortality between the two methods was very large for SQ-LNS.
Table 6. Estimated annual deaths averted from CFP for children 6–23 months of age: 2023

Source: Estimates by the authors.
As for SQ-LNS, we chose to apply the direct effect of 18–27 % reduction in all-cause mortality among children 6–23 months from the meta-analysis by Stewart et al. (Reference Stewart, Wessells, Arnold, Huybregts, Ashorn, Becquey, Humphrey and Dewey2020) to CFP, with 18 % reduction for children in the two highest SES quintiles (which has less severe stunting) and 27 % reduction for children in the three lowest SES quintiles (which have more severe stunting). Much of the difference in annual cases of deaths averted in the two target groups is due to the large difference in baseline mortality rates.
Averted cases of stunting are valued by a 30 % increase in lifetime income relative to a person who became stunted in early childhood. Lifetime income is estimated separately for individuals from the three lowest and two highest SES quintiles (see Annex). Averted cases of deaths are valued using a VSLY at 1.55 times GDP per capita in 2022 and rising to 2.9 times GDP per capita in 2090 (see Annex).
Total annual benefits of averted stunting are fairly similar for the two target groups, albeit the difference in averted cases of stunting is large. The similar magnitude of benefits is due to much higher baseline income among individuals from the two highest SES quintiles. Benefits of mortality reduction is, however, much larger for the three lowest quintiles. Noteworthy is that, in the base case with 8 % discount rate, productivity or income gains are about 80 % of total benefits in the two highest SES quintiles while mortality benefits are nearly 60 % of total benefits in the three lowest SES quintiles (Table 7).
Table 7. Estimated annual benefits of CFP for children 6–23 months of age: 2023 (US$ million per year)

Note: No discounting of mortality benefits is undertaken as averted deaths would occur in the same or subsequent year of CFP. Source: Estimates by the authors.
Benefit–cost ratios
The benefit–cost ratio (BCR) for the base case with 8 % discount rate for CFP targeting children in the two highest SES quintiles is 15.9 (Table 9), or twice as high as the BCR for the three lowest SES quintiles (Tables 8). This is because the cost per child in the three lowest SES quintiles is three times as high as the cost per child in the two highest SES quintiles while benefit per child is only somewhat higher. The reasons for the difference in cost are the need for a more intensive and thus costly promotion program in resource poor settings in order to spur behavioral change, and the need for more incremental complementary food.
Table 8. Total annual benefits and costs of CFP for children 6–23 months: 2023; 3 lowest SES quintiles

Source: Estimates by the authors.
Table 9. Total annual benefits and costs of CFP for children 6–23 months: 2023; 2 highest SES quintiles

Source: Estimates by the authors.
The BCRs for CFP for children in the two highest SES quintiles and for preventive SQ-LNS for children in the three lowest SES quintiles is very similar.
Intervention 3: provision of MMN and Ca supplements to pregnant women
The third intervention replaces iron and folic acid (IFA) with MMN and additionally provides Ca supplements to pregnant women in LI-LMI countries. The intervention delivery platform is antenatal care (ANC) services (Heidkamp et al., Reference Heidkamp, Wilson, Menon, Kuo, Walton, Gatica-Domínguez, Crochemore da Silva, Aung, Hajeebhoy and Piwoz2020). We calculated from 40 Demographic and Health Services (DHS) in LI-LMIs from 2013 to 2021, constituting 80 % of the total population in LI-LMIs, that 56 % of pregnant women had four or more antenatal care (ANC) visits and that 40 % reported to have taken iron tablets for at least 90 days during pregnancy. The target of the intervention is therefore 40 % of pregnant women (36 million women) in LI-LMIs.
Intervention cost
The MMN intervention replaces IFA supplementation and targets pregnant women who would be taking IFA. MMN contains IFA. The cost of the intervention is therefore the incremental cost of switching from IFA to MMN. The incremental cost of 180 MMN tablets of UNIMMAP formula (15 micronutrients) is reported to be in the range of US$ 0.88–1.83 per pregnant woman over the course of pregnancy (Engle-Stone et al., Reference Engle-Stone, Kumordzie, Meinzen-Dick and Vosti2019; Kashi et al., Reference Kashi, Godin, Kurzawa, Verney, Busch-Hallen and De-Regil2019). The cost of Ca is US$ 5.96 per pregnant woman, assuming two tablets of 600 mg per day over 20 weeks (WHO, 2018). In the cost-effectiveness analyses by Engle-Stone et al. (Reference Engle-Stone, Kumordzie, Meinzen-Dick and Vosti2019) and Kashi et al. (Reference Kashi, Godin, Kurzawa, Verney, Busch-Hallen and De-Regil2019), incremental cost of delivery program is assumed zero because the intervention is delivered through existing ANC services with no scale-up needed to reach the 40 % of women who take IFA supplements. To be conservative we include an incremental delivery cost of US$ 0.50–1.45 per pregnant woman. This brings the midpoint cost of MMN to US$ 2.33 per pregnant woman.
With a target of 36 million pregnant women annually the total cost is US$ 84 million for MMN supplementation and, if also Ca is provided, US$ 216 million additionally for Ca supplementation.
Intervention benefits
Four main health benefits of MMN supplementation for pregnant women are often highlighted. These are reduced risk of stillbirths, low birth weight (LBW), preterm births (PB) and being SGA (Keats et al., Reference Keats, Das, Salam, Lassi, Imdad, Black and Bhutta2021). Three recent reviews and/or meta-analyses of evidence are presented in Table 10. They all find reduced risk of the four main health outcomes with relative risks (RRs) in the range of 0.86 to 0.98, and Oh et al. (Reference Oh, Keats and Bhutta2020) find an RR of 0.79 if the MMN supplement contains more than four micronutrients.
Table 10. Evidence of effects of MMN supplementation versus IFA during pregnancy (Relative Risk)

* Not statistically significant at 95 % confidence level.
** In studies with MMN > 4 nutrients.
None of the reviews and meta-analyses find any statistically significant general effect on neonatal or infant mortality of MMN with two notable exceptions. If women adhere to the MMN regimen throughout pregnancy (≥95 %) the risk of infant mortality is reduced by 15 % (RR of 0.85). MMN also seems to reduce neonatal and infant mortality among females but not males.
In order to be conservative, no potential neonatal or infant mortality benefits from MMN supplementation during pregnancy are included in the benefit–cost assessment here. Moreover, the benefit–cost assessment does not include benefits or reducing SGA to avoid any double counting of benefits from reduced risk of LBW.
Four main health benefits of Ca supplementation for pregnant women are also often highlighted. These are reduced risk of maternal pre-eclampsia/eclampsia, as well as stillbirths, LBW and PB as for MMN (Keats et al., Reference Keats, Das, Salam, Lassi, Imdad, Black and Bhutta2021). Two recent reviews and/or meta-analyses of evidence are presented in Table 11. They all find reduced risk of the four main health outcomes with RRs in the range of 0.45 to 0.99, but no statistically significant reduction in maternal or neonatal and infant mortality.
Table 11. Evidence of effects of Ca supplementation during pregnancy (Relative Risk)

RRs applied for benefit estimation and annual averted cases of health outcomes are presented in Table 12. A joint attributable fraction formula is applied for stillbirths, LBW, and PB to estimate the incremental averted cases of adding Ca to MMN.Footnote 5 While the RR for maternal pre-eclampsia/eclampsia is as low as 0.45, no maternal mortality effect was found by Hofmeyr et al. (Reference Hofmeyr, Lawrie, Atallah and Torloni2018). A range of 0–8,470 averted annual deaths is therefore presented reflecting RRs of 1.00 and 0.45.
Table 12. Effect sizes and annual cases averted from MMN and Ca supplementation during pregnancy

Note: Baseline cases of each health outcome in LI-LMIs is from the World Bank’s World Development Indicators for the most recent year available.
Annual benefits are presented in Table 13 for the provision of MMN and Ca to 36 million pregnant women annually. Averted PB and LBWs are valued using a lifetime income effect of 10 % based on effects on IQ and effects of IQ on income (see Annex). Valuation of averted stillbirths is controversial. Conservatively, it is here valued at the cost of a funeral. Averted maternal deaths are valued using the VSLY (see Annex).
Table 13. Total annual benefits of MMN and Ca supplementation during pregnancy: 2023 US$ million

Note: Annual discount rate is 8 %. Source: Estimates by the authors.
Benefit–cost ratios
The total cost of MMN supplementation amounts to US$ 84 million per year. Total benefits are US$ 0.7–8.1 billion per year depending on the discount rate applied to lifetime income gains. The BCR for the base case with 8 % discount rate is 37.5, which is with benefits 37 times the cost (see Table 14). If we use the assumption of no incremental MMN delivery cost as Engle-Stone et al. (Reference Engle-Stone, Kumordzie, Meinzen-Dick and Vosti2019) and Kashi et al. (Reference Kashi, Godin, Kurzawa, Verney, Busch-Hallen and De-Regil2019), the BCR is as high as 65.
Table 14. Total annual benefits and costs of MMN supplementation: 2023

Source: Estimates by the authors.
The total cost of Ca supplementation amounts to US$ 216 million per year. Total incremental benefits of adding Ca to MMN are US$ 0.6–5.6 billion per year depending on the discount rate applied to lifetime income gains. The BCR for the base case is 11.2, which is with benefits 11 times the cost (see Table 15). Potential reduction in maternal pre-eclampsia/eclampsia mortality is assumed zero. With maternal mortality reduction, the BCR is 18.6.
Table 15. Incremental annual benefits and costs of Ca supplementation: 2023

Source: Estimates by the authors.
The base case BCR for provision of both MMN and Ca supplements is 18.6 (Table 16). With maternal mortality reduction the BCR is 23.9.
Table 16. Total annual benefits and costs of MMN and Ca supplementation: 2023

Source: Estimates by the authors.
Conclusion
MMN supplementation for pregnant women replacing IFA, as well as MMN and Ca combined, have the highest benefit–cost ratios (BCRs). The BCRs for CFP for children in the two highest SES quintiles and SQ-LNS for children in the three lowest SES quintiles are fairly similar at 16 and 14, respectively. The lowest BCR is for CFP for children in the three lowest SES quintiles due to the high cost of accomplishing behavioral change for improved complementary feeding in resource poor households (Table 17).
Table 17. Annual benefits and costs of the nutrition interventions

Note: Base case BCRs with 8 % discount rate.
Acknowledgements
The authors would like to thank Dylan D. Walters of Nutrition International; Elisabetta Aurino of the University of Barcelona; Emanuela Galasso of World Bank; Harold Alderman of International Food Policy Research Institute and Bjorn Lomborg of Copenhagen Consensus Center for their valuable comments that supported this analysis. All responsibility for the content remains with the authors.
Annex: Valuation of benefits
Stunting
An averted case of stunting of a child participating in the labor force during adult life is valued as the lifetime productivity gain estimated at a 30 % boost to lifetime income. The productivity gain or income effect is based on a survey of nine longitudinal studies of stunted children from LMICs which shows that avoiding stunting is associated with a 6 cm increase in height in adulthood or adolescence (Galasso et al., Reference Galasso, Wagstaff, Naudeau and Shekar2017) and a review of 13 studies that shows that 1 cm of height is associated with 5 % increase in wages (4 % increase in wages for men, and 6 % increase in wages for women, controlling for confounding factors; McGovern et al., Reference McGovern, Krishna, Aguayo and Subramanian2017). The productivity gain is multiplied by the projected labor force participation rate for ages 15–62 years. Thus, the estimated benefit of the intervention is conservative because individuals not participating in the labor force during adult life may also derive value from avoided stunting.
To estimate the lifetime productivity gain, annual average labor income is calculated as GDP multiplied by the labor income share of GDP taken from the PENN World Table, version 10, and divided by the total labor force. Consequently, annual average labor income is currently 1.3 times GDP per capita in the low- and lower middle-income countries as a group. This ratio gradually declines to 1.0 in 2090 as GDP per capita increases to over $10,000. A linear decline is applied based on current observed values of GDP per capita, labor income shares, and labor force participation rates in lower middle-income countries. Average labor income is adjusted by income distributions in LI-LMI countries reported by the World Bank’s World Development Indicators to arrive at average labor income in the three lowest and two highest SES quintiles.
Annual average labor income among adults who were stunted in childhood is calculated based on the 30 % income effect of avoiding stunting and the prevalence rate of stunting in childhood. The lifetime income gain from averted stunting is calculated based on income projections from age 15 to 62 years discounted at rates 5, 8, and 14 %, with 8 % as the base case. For the base case, the lifetime income gain is US$ 4,740 multiplied by an expected labor force participation rate of 59 % for a child avoiding stunting in 2023 and working from 2038 to 2085. For a child that will not participate in the labor force, the value of averted stunting is zero. This is obviously an understatement of the cost of stunting. Estimated benefits of averted stunting are therefore conservative.
Child mortality
Mortality benefit per death averted is monetized using a VSLY that is multiplied by remaining years of life expectancy at the age of death. The VSLY is calculated as the value of statistical life (VSL) divided by remaining years of life expectancy at average adult age. The VSL for the target group of countries is calculated using a benefit transfer method based on GDP per capita differentials between the target group of countries and the United States and an income elasticity of 1.5 (Robinson et al., Reference Robinson, Hammitt and O’Keefe2019a, Reference Robinson, Hammitt, Cecchini, Chalkidou, Claxton, Cropper and Eozenou b). Specifically, each averted child death at age 6–23 months saves 68 years of life, and each life year saved is valued at 1.55 times GDP per capita in 2022 and rising to 2.9 times GDP per capita in 2090. The benefit of an averted death is US$ 212,000 in 2022 in the target countries, or 106 times GDP per capita.
Preterm birth and low birthweight
Recent meta-analyses have estimated the effects of preterm birth and LBW on income-related outcomes. Bilgin et al. (Reference Bilgin, Mendonca and Wolke2018) found decreased likelihood of attainment of higher education (OR = 0.74), lower employment rate (OR = 0.83), and increased likelihood of receiving social benefits (OR = 1.25). Kormos et al. (Reference Kormos, Wilkinson, Davey and Cunningham2014) found that LBW is associated with a loss of 5 IQ points after adjusting for publication bias. McBryde et al. (Reference McBryde, Fitzallen, Liley, Taylor and Bora2020) found that preterm births are associated with significantly lower scores on reading comprehension and applied mathematical problems assessments.
The results from Kormos et al. (Reference Kormos, Wilkinson, Davey and Cunningham2014) can be combined with the literature on income effects of IQ. Salkever (Reference Salkever1995) found a lifetime income effect per IQ point of 2.09 % for males and 3.63 % for females. These effects include a positive direct effect of higher IQ on income, a positive indirect effect on income through increased schooling and likelihood of high school graduation, and a positive effect on lifetime labor-force participation and thus lifetime income. USEPA (2020) undertook a reanalysis of the effect on income using a more recent version of the dataset used by Salkever. The reanalysis found a lifetime income effect per IQ point of 1.86 % for males and 3.4 % for females. These estimates are fairly similar to the original estimates by Salkever and suggest an effect of well over 2.0 % for the overall labor force. We therefore use an income effect of 5 IQ points * 2 % income effect per IQ point = 10 % lifetime income effect per LBW or preterm birth.


 Open access