


1. Introduction
The fragmentation of a liquid sheet into droplets is a ubiquitous phenomenon found in nature and industry with several applications (Marmottant & Villermaux Reference Marmottant and Villermaux2004; Villermaux Reference Villermaux2007; Eggers & Villermaux Reference Eggers and Villermaux2008). The precise knowledge and control of the droplet size formed from spray is important in many areas such as spray coating, inkjet printing and agriculture (Kooij et al. Reference Kooij, Sijs, Denn, Villermaux and Bonn2018). Understanding liquid sheet breakup is also important for the prevention and containment of airborne disease transmission, which has gained much attention after the outbreak of COVID-19. Soon after the World Health Organization declared COVID-19 a pandemic, evidence emerged showing the airborne transmission of the virus (Morawska & Cao Reference Morawska and Cao2020; Morawska & Milton Reference Morawska and Milton2020; Richard et al. Reference Richard2020; Wilson, Corbett & Tovey Reference Wilson, Corbett and Tovey2020).
Airborne transmission of pathogens via expelled respiratory droplets is mainly carried out by small droplets. Wells (Reference Wells1934) compared the evaporation time and settling time of droplets ranging from 1 to  $1000\ \mathrm {\mu }{\rm m}$ and found that droplets of size greater than ${100}\ {\mathrm {\mu }}{\rm m}$ settle faster than they evaporated. On the contrary, droplets with diameters less than ${100}\ {\mathrm {\mu }}{\rm m}$ evaporate faster than they can settle to the ground and the droplet nuclei remain suspended in the air for a longer period of time. Wells’ result served as a basis for the dichotomization of respiratory transmission modes depending on the droplet size. Small droplets laden with pathogens can travel several metres in the air and might play a significant role in the transmission of COVID-19 in indoor environments (Morawska & Cao Reference Morawska and Cao2020). Many studies have been conducted to understand the fluid dynamics of the breakup of expelled respiratory liquids (Scharfman et al. Reference Scharfman, Techet, Bush and Bourouiba2016; Poulain & Bourouiba Reference Poulain and Bourouiba2019; Bourouiba Reference Bourouiba2020, Reference Bourouiba2021; Reyes et al. Reference Reyes, Fontes, Bazzi, Otero, Ahmed and Kinzel2021). Sneezing, coughing (Bourouiba, Dehandschoewercker & Bush Reference Bourouiba, Dehandschoewercker and Bush2014) and even speech (Abkarian et al. Reference Abkarian, Mendez, Xue, Yang and Stone2020) produce a multiphase, turbulent gas cloud containing pathogen-laden droplets. The ejecta from sneezing and coughing include distinctively separated droplets as well as bags of fluid, which continue to fragment into droplets outside the mouth.
The fragmentation mechanism of a liquid is affected by its physical properties such as the surface tension and viscosity (Dombrowski & Fraser Reference Dombrowski and Fraser1954). Food and beverages can change such physical properties of saliva. Saliva is a non-Newtonian fluid with shear-thinning behaviour, and thus, the viscosity of saliva could change due to shear rate changes in the mouth. For instance, a shear rate of  $4\ \text {s}^{-1}$ is associated with the movement of particles across the tongue, while shear rates of 160 and up to $500\ \text{s}^{-1}$ correspond to speech and eating, respectively (Vissink et al. Reference Vissink, Waterman, Gravenmade, Panders and Vermey1984; Gittings et al. Reference Gittings, Turnbull, Henry, Roberts and Gershkovich2015). Additionally, the physical presence of food in the mouth also affects the viscosity of saliva, whose composition and viscosity depends on the type of stimulus (Briedis, Moutrie & Balmer Reference Briedis, Moutrie and Balmer1980). The viscosity of saliva at a shear rate of $4\ \text {s}^{-1}$ is around 30 mPa s, and we take this as the pre-eating baseline viscosity value. This value decreases to around 1 mPa s due to the high shear stress induced by eating. Meanwhile, many foods and drinks contain surfactants, both natural and synthetic, that can lower the surface tension of saliva. Natural surfactants such as lecithin from egg yolk and synthetic surfactants such sorbitan esters are used in the preparation of many foods such as mayonnaise, dressings and deserts (Kralova & Sjöblom Reference Kralova and Sjöblom2009). Furthermore, beverages that contain alcohol can also lower the surface tension of saliva. The surface tension of saliva could increase from the baseline value, around $67$ to around $70\ {\rm mN}\ {\rm m}^{-1}$ during eating due to the salinity of food. More importantly, the surface tension could decrease by more than half to $25\ {\rm mN}\ {\rm m}^{-1}$ during consumption of an alcoholic drink. Eating could also induce changes in the viscoelasticity of saliva; acidic food has been shown to stimulate the secretion of saliva with an increased elasticity (Stokes & Davies Reference Stokes and Davies2007; Davies, Wantling & Stokes Reference Davies, Wantling and Stokes2009).
In general, the atomization of complex fluids can be characterized using dimensionless numbers such as the capillary, Weber and Ohnesorge numbers (McKinley Reference McKinley2005). In this study, among the various physical properties, we focus on the effects of viscosity and surface tension, which can be changed significantly during eating or drinking, as opposed to, for instance, density, which remains relatively constant. The risk of airborne COVID-19 transmission posed by eating or drinking is especially high since, during dining, we take off our face masks, which are the most effective way of protecting ourselves from COVID-19 and other airborne diseases.
While many studies have been conducted to characterize the effect of physical properties of fluids on the atomization mechanism of Newtonian liquid jets, to our best knowledge, the effect of saliva fluid properties on its atomization morphology has rarely been studied. In this work, we experimentally study the atomization mechanism of artificial saliva mixtures from the perspective of varying physical properties. Our work has two main objectives; first, we attempt to visualize and analyse the atomization morphology of human saliva using high-speed shadowgraph experiments on artificial saliva. Second, we investigate the effect of the physical properties of saliva on its atomization mechanism. We use probability density functions of the droplet size and the Sauter mean diameters to characterize the effect of saliva fluid properties on the atomization of expelled saliva.
2. Experiment
2.1. Experimental set-up
In this study, we performed high-speed shadowgraph experiments on the atomization of artificial saliva. A schematic of the experimental set-up is shown in figure 1(a). An artificial saliva sample of  $1.5\ \mathrm {\mu }{\rm l}$ volume was placed inside a cylindrical nozzle of 1.1 mm internal diameter ( $d$), onto which a step-function profile pressure was applied for 100 ms by a pressure controller (Fluigent FLOW EZ, France). Air was supplied to the nozzle by a high-pressure air tank with pressure values ranging from 0.1 to 4 bar. The atomization morphology was recorded with a high-speed camera (Photron fastcam SA-Z, Japan), and a high-power plasma light source (HPLS343, Thorlabs, Inc., USA) was used to illuminate the background and create a bright field. The collimator placed between the light source and the object helps create a uniform light distribution. The breakup process was recorded at frame rates ranging from 20 000 to 70 000 frames-per-second with an exposure time of 1/1 680 000 or 1/2 880 000 s.

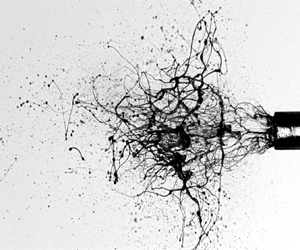
Figure 1. (a) Schematic of the experimental set-up. Air with a step-function pressure profile is applied on to a  ${1.5}\ {\mathrm {\mu }}{\rm l}$ liquid sample placed inside a nozzle of 1.1 mm internal diameter ( $d$). (b) The breakup process of a liquid volume in response to applied pressure. (i)–(ii) The liquid column grows along the axial direction until it ruptures. (ii) The time it takes for the liquid column to rupture is defined as the breakup time, $t$. (iii) The liquid sheet then breaks down into fluid bags (A) and ligaments. (iv)–(v) The ligaments thin and stretch forming beads-on-a-string structures (B) before they finally fragment into droplets.
2.2. Materials
For our experiments, we selected two artificial saliva products that had similar physical properties to natural saliva after rheological and surface tension measurements; first, artificial saliva for dental and medical research (1700-0305, Pickering Laboratories Inc., USA), which we labelled as ‘saliva A’, is formulated with sodium carboxymethyl cellulose to increase the viscosity and make it behave like natural human saliva. The second artificial saliva sample, labelled as ‘saliva B’, is artificial saliva for pharmaceutical research (1700-0304, Pickering Laboratories Inc., USA) and is formulated for drug dissolution. The viscosity measurements were conducted using a Modular Compact Rheometer MCR 502 (Anton Paar GmbH, Austria). Measurements were carried out at  $37 \,^{\circ }{\rm C}$ with the shear rate increasing logarithmically from 1 to $1000\ \text {s}^{-1}$. The viscosity values of the liquid samples at a shear rate of $1000 \ \text {s}^{-1}$, which represents the shear rate during sneezing or coughing (Zahm et al. Reference Zahm, King, Duvivier, Pierrot, Girod and Puchelle1991; Lai et al. Reference Lai, Wang, Wirtz and Hanes2009; Vasquez et al. Reference Vasquez, Bowser, Swiderski, Walters and Kundu2014), are given in table 1. The surface tension measurements were conducted using the pendant drop method. The shape of the drop hanging from a needle is determined from the balance of forces which include the surface tension of the liquid being investigated. Images of the drop hanging were captured and the surface tension was calculated using an in-house MATLAB processing (Stauffer Reference Stauffer1965).
Table 1. The composition and physical properties of the liquid samples investigated; A and B are artificial saliva products for dental and medical research and pharmaceutical research, respectively.

Furthermore, we altered the physical properties of the artificial saliva samples. To change the viscosity, we used glycerol ( $\geqslant$99.0 % purity, Sigma-Aldrich, USA), which alters the viscosity without significantly affecting the surface tension of the liquid. We used ethanol ( $\geqslant$99.5 % purity, Sigma-Aldrich, USA) and SDS (sodium dodecyl sulphate, $\geqslant$98.0 % purity, Sigma-Aldrich, USA) to change the surface tension of saliva B and a combination of ethanol and glycerol to change the surface tension of saliva A. The compositions as well as the viscosity at a shear rate of $1000 \ \text {s}^{-1}$ and surface tension values of the fluid samples used are shown in table 1.
3. Results and discussion
3.1. Breakup morphology of expelled respiratory liquid
Using the experimental set-up described in § 2.1, we observed the evolution of the breakdown of an expelled saliva through a nozzle. As can be seen in figure 1(b), after the liquid emerges from the nozzle, it grows along the nozzle direction and continues to thin as a hollow shell, during which transverse waves form at the interface between the liquid and the surrounding air. These waves grow and destabilize the liquid sheet, leading to its breakdown. The liquid sheet then disintegrates into liquid bags and ligaments (see (iii) of figure 1b). As shown in (iv) and (v) of figure 1(b), the liquid bags burst to form ligaments, which form beads-on-a-string structures and eventually fragment into droplets (see also supplementary movie 1 available at https://doi.org/10.1017/jfm.2023.185).
We performed experiments by altering the pressure of the airflow and observed that the breakup time and length of the growing liquid column depend on the pressure. Here, the breakup time is defined as the time elapsed from the impingement of airflow to the burst of the liquid sheet. We defined the breakup length as the maximum length the liquid column grows to before rupturing, as shown in figure 2(a). As the velocity increases, the breakup time decreases, while the breakup length increases. The jet velocity ( $U$) was measured using ${10}\ {\mathrm {\mu }}{\rm m}$ hollow glass spheres and showed a quadratic relation with the pressure ( $p$), i.e. $p \propto U^{2}$ . The breakup times of various liquids are presented in figure 3(a). We found that the dimensionless breakup time ( $t^{*} = t/[{\mu }/{\sigma } ({V_o}/{2N_1{\rm \pi} d} )^{{1}/{2}}]$), where $\sigma$ is the surface tension and $\mu$ is the dynamic viscosity of the liquid, shows a power-law dependence on the capillary number ( $Ca = \mu U/\sigma$) with a slope of $-1/2$ (see figure 3b). Here, $N_1$ is defined as $(2-N)/N$ where N is a constant value to consider the viscous effect (Dombrowski & Johns Reference Dombrowski and Johns1963).

Figure 2. (a) The formation and growth of transverse waves at the interface between the liquid sheet and the surrounding air where  $l_b$ is the breakup critical length. (b) Variable notations for the sheet thickness (h) and column length (l) where $V_0 = {\rm \pi}\,{\rm d}lh$.


3.2. Theoretical modelling
To understand our experimental findings, we performed theoretical modelling based on works by Squire (Reference Squire1953) and Dombrowski & Johns (Reference Dombrowski and Johns1963), which showed that the breakup of liquid sheets occurs through the formation of transverse waves which grow until the sheet breaks down (see figure 2). Considering a sheet that is thinning with time and moving in the  $x$-direction with velocity $U$ through stationary gas, the equation of motion of the sheet mid-way between the two gas/liquid interfaces is obtained by inter-relating the forces acting on the liquid sheet. Here, the displacement of the neutral axis of sheet from undisturbed position is in the $y$-direction, as sketched in figure 2(a). These forces are caused by gas pressure, liquid surface tension, inertia and viscosity. Assuming perturbations only in the $y$-direction, these four forces per unit length can be scaled as: (i) pressure force: $F_{p} = 2n\rho _{g}U^{2}{\rm \pi} \,{{\rm d} y}$, (ii) surface tension force: $F_{\sigma } = 2\sigma {\rm \pi}{d} ({\partial ^2 y}/{\partial x^2})$, (iii) inertial force: $F_{i} = \rho _{l}(h({\partial ^2 y}/{\partial t^2}) + ({\partial h}/{\partial t})({\partial y}/{\partial t}) ){\rm \pi} d$ and (iv) viscous force: $F_{\mu } = \mu ({\partial ^3 y}/{\partial t\partial x^2}){\rm \pi} \,{\rm d}h$, where $\rho _{g}$: density of air ( ${\approx }1.225\ \text {kg}\ \text {m}^{-3}$), $d$: the inner diameter of the nozzle (1.1 mm), $\sigma$: surface tension ( ${\approx }28\unicode{x2013}72\ {\rm mN}\ {\rm m}^{-1}$), $\rho _{l}$: density of the liquid ( ${\approx }1000 \ \text {kg}\ \text {m}^{-3}$), $h$: thickness of the liquid sheet [ $O(0.1\ {\rm mm})$], $\mu$: viscosity ( ${\approx }1\unicode{x2013}40 \ {\rm mPa} \ {\rm s}$), $y$: the displacement of neutral axis of sheet from undisturbed position in the $y$-direction and $n$: wavenumber for viscous liquids (Dombrowski & Johns Reference Dombrowski and Johns1963).
Hence the total force on a finite length  ${\rm d}\kern0.7pt x$ is
 \begin{align}
2n\rho_{g}U^{2}{\rm \pi} \,{{\rm d} y}\,\text{d}\,x + 2\sigma
{\rm \pi} d \frac{\partial^2 y}{\partial x^2}\text{d}\,x +
\rho_{l} {\rm \pi}d \left(h\frac{\partial^2 y}{\partial t^2} +
\frac{\partial h}{\partial t}\frac{\partial y}{\partial t}
\right ) \text{d}\,x + \mu {\rm \pi}d \frac{\partial^3
y}{\partial t \partial x^2} h\,\text{d}\,x \simeq 0.
\end{align}
\begin{align}
2n\rho_{g}U^{2}{\rm \pi} \,{{\rm d} y}\,\text{d}\,x + 2\sigma
{\rm \pi} d \frac{\partial^2 y}{\partial x^2}\text{d}\,x +
\rho_{l} {\rm \pi}d \left(h\frac{\partial^2 y}{\partial t^2} +
\frac{\partial h}{\partial t}\frac{\partial y}{\partial t}
\right ) \text{d}\,x + \mu {\rm \pi}d \frac{\partial^3
y}{\partial t \partial x^2} h\,\text{d}\,x \simeq 0.
\end{align} Using order of magnitude estimates, we find that  $F_{p} \sim O(10^{-3})$ N, $F_{\sigma } \sim O(10^{-3})$ N, $F_{i} \sim O(10^{-5})$ N and $F_{\mu } \sim O(10^{-3})$ N. Thus, we assume a balance of the pressure and surface tension forces with the viscous force
 \begin{equation}
2n\rho_{g}U^{2}{\rm \pi} \,{{\rm d} y}\,\text{d}\,x+2\sigma {\rm \pi}
d \frac{\partial^2 y}{\partial x^2}\text{d}\,x + \mu {\rm \pi}d
\frac{\partial^3 y}{\partial t \partial x^2} h\,\text{d}\,x
\sim 0.
\end{equation}
\begin{equation}
2n\rho_{g}U^{2}{\rm \pi} \,{{\rm d} y}\,\text{d}\,x+2\sigma {\rm \pi}
d \frac{\partial^2 y}{\partial x^2}\text{d}\,x + \mu {\rm \pi}d
\frac{\partial^3 y}{\partial t \partial x^2} h\,\text{d}\,x
\sim 0.
\end{equation} For a sinusoidal wave motion,  $y = T\sin (nx + \varepsilon )$ where $n$ is wavenumber and $\varepsilon$ is phase angle, (3.2) yields
 \begin{align}
2n\rho_{g}U^{2}{\rm \pi} d[T\sin(nx {\,+\,} \varepsilon)]\,{{\rm
d}\kern0.7pt x} {\,-\,} 2\sigma {\rm \pi}n^2 d[T\sin(nx {\,+\,}
\varepsilon)]\,\text{d}\,x \sim \mu {\rm \pi}\,{\rm d} n^2
\frac{\partial [T\sin(nx {\,+\,} \varepsilon)]}{\partial t}
h\,{\rm d}\kern0.7pt x,
\end{align}
\begin{align}
2n\rho_{g}U^{2}{\rm \pi} d[T\sin(nx {\,+\,} \varepsilon)]\,{{\rm
d}\kern0.7pt x} {\,-\,} 2\sigma {\rm \pi}n^2 d[T\sin(nx {\,+\,}
\varepsilon)]\,\text{d}\,x \sim \mu {\rm \pi}\,{\rm d} n^2
\frac{\partial [T\sin(nx {\,+\,} \varepsilon)]}{\partial t}
h\,{\rm d}\kern0.7pt x,
\end{align}
which can be simplified by substituting for  $h$ in terms of the initial volume $V_o = {\rm \pi}\,{\rm d}hl$ and taking $l = Ut$ to find
 \begin{equation} 2\rho_{g}U^{2}-2n\sigma \sim \frac{\mu V_o}{{\rm \pi} \,{\rm d}U} n \frac{1}{ t^2 }. \end{equation}
 The wavenumber of the dominant wave for a viscous liquid is given as  $n = {N\rho _{g}U^2}/{2\sigma }$, where $N$ is a constant that accounts for the viscous effects (Dombrowski & Johns Reference Dombrowski and Johns1963). Introducing this equation into our relationship, we find
 \begin{equation} N_1\rho_{g}U^{2} \sim \frac{\mu V_o \rho_{g}U}{ 2{\rm \pi} \,{\rm d}\sigma } \frac{1}{ t^2 }, \end{equation}
where  $N_1 = ({2-N})/{N}$. Rearranging the relationship and using the capillary number, $Ca = {\mu U}/{\sigma }$,
 \begin{equation} t \sim \frac{\mu}{\sigma} \left ( \frac{ V_o}{N_1 2{\rm \pi} d}\right )^{{1}/{2}} Ca^{-{1}/{2}}. \end{equation}
 Defining  $t^{*} = {t}/ {[{\mu }/{\sigma } ({V_o}/{2N_1{\rm \pi} d})^{{1}/{2}}]}$, we find an expression relating the dimensionless breakup time to the capillary number
 \begin{equation} t^{*} \sim Ca^{-{1}/{2}}. \end{equation}
 The expression in (3.7) explains our experimental observations. The dimensionless breakup time is plotted against the capillary number in figure 3(b). Taking  $N_1$ to be proportional to $\mu$, we find that the measurement data of the various liquids investigated collapse into a single curve.
3.3. Droplet formation
The fragmentation of ligaments into droplets is driven by surface tension, which gives rise to the Rayleigh–Plateau (RP) instability, as shown in figure 4(a). Low-viscosity Newtonian ligaments breakdown via the RP instability on the capillary time scale,  $t_{R} = \sqrt {\rho d^3/\sigma }$. Figure 4(b) shows the ligament breakup times of salivas A and B at 1 bar (a shear rate of ${\sim }1000\ \text {s}^{-1}$), which corresponds to the shear rate during sneezing or coughing. The low-viscosity, non-viscoelastic saliva B ligaments breakup on the capillary time scale. However, ligaments of saliva A fragment on a time scale approximately an order of magnitude higher than that predicted by the RP instability. Our experiments show that the beads-on-a-string structures on the ligaments retard the ligament breakup. Beads-on-a-string structures arise when the inertial, capillary, viscous and elastic forces are balanced (Clasen et al. Reference Clasen, Eggers, Fontelos, Li and McKinley2006; Bhat et al. Reference Bhat, Appathurai, Harris, Pasquali, McKinley and Basaran2010). The formation of beads-on-a-string structures indicates the presence of viscoelastic effects. These structures play a critical role in retarding droplet formation and thus affect the droplet size distribution. Our experiments also show that, prior to the final separation of droplets, the ‘beads’ on the structures merge after the ‘string’ has thinned down.

Figure 4. (a) The fragmentation process of a ligament of saliva A into droplets. (b) The breakup time ( $t_l$) of ligaments of salivas A and B for various initial ligament diameters ( $d_l$).
3.4. Effect of saliva physical properties on its atomization mechanism
3.4.1. Effect of viscosity
First of all, we investigated the effect of dynamic viscosity on the atomization of respiratory fluids. As the viscosity increases, the pinch off time of the ligaments increases. This in turn delays the eventual breakup of the ligaments by delaying the breakup time. We characterized the effect of viscosity on the droplet size using the droplet size distribution and Sauter mean diameter plots. To investigate the effect of viscosity on the atomization mechanism of liquid sheets, we varied the viscosity by as much as a factor of 40, from  $1\ {\rm mPa}\ {\rm s}$ for pure saliva B to $40\ {\rm mPa}\ {\rm s}$ for a mixture of saliva B with 80 wt % glycerol. This range covers the reported viscosity values of saliva at different shear rates (Gittings et al. Reference Gittings, Turnbull, Henry, Roberts and Gershkovich2015). We measured the probability density function of the droplet size using image processing by an in-house MATLAB program on high-speed images, and the experimental data are fitted with a gamma distribution, which is known to represent the droplet size distribution, including the fragmentation of viscoelastic liquids (Villermaux Reference Villermaux2007; Keshavarz et al. Reference Keshavarz, Houze, Moore, Koerner and McKinley2016). Our experiments also show that the gamma distribution fits the experimental data more closely than other distributions such as log-normal or Poisson distributions. As can be seen in figure 5(a), the droplet size distribution is very weakly correlated with the viscosity, only showing a noticeable difference for the highest-viscosity liquid. Figure 5(b) shows the relationship between the viscosity and the Sauter mean diameter (SMD, D32); SMD is defined as the diameter of a droplet that has the same volume to surface area ratio as that of the entire spray and can be expressed as the ratio of the third to the second moment of the probability density function (Pacek, Man & Nienow Reference Pacek, Man and Nienow1998; Kowalczuk & Drzymala Reference Kowalczuk and Drzymala2016).
 \begin{equation} \frac{\displaystyle\int\nolimits_{d_{min}}^{d_{max}}d^{3}q(d)\,\text{d}d}{ \displaystyle\int\nolimits_{d_{min}}^{d_{max}}d^{2}q(d)\,\text{d}d}, \end{equation}
where  $d_{min}$ and $d_{max}$ represent, respectively, the minimum and maximum values of diameter of the histogram $q(d)$. Alternatively, in terms of a finite number of discrete size classes,
 \begin{equation} D_{32} = \frac{\displaystyle\sum\nolimits_{i=1}^{n}N_{i}D_{i}^{3}}{\displaystyle\sum\nolimits_{i=1}^{n}N_{i}D_{i}^{2}}, \end{equation}
where  $N_i$ and $D_i$ are the number of droplets and mean diameter of a class, respectively. The SMD is widely used to characterize the drop size in sprays, and it is especially important in calculations where the active surface area is important (Lefebvre & McDonell Reference Lefebvre and McDonell2017).

Figure 5. (a) The droplet size distribution of fluids of varying viscosities at 1 bar. (b) The effect of viscosity on the Sauter mean diameter (SMD) for two different pressure inputs.
Our experiments show that the SMD increases as the viscosity increases. Considering the changes in the shear rate in the mouth, the viscosity of saliva could decrease from  $4 \ {\rm mPa}\ {\rm s}$ at low shear rates ( ${\sim }100\ \text {s}^{-1}$) to $1\ {\rm mPa}\ {\rm s}$ at high shear rates ( ${\sim }1000\ \text {s}^{-1}$). Keeping other parameters constant, this represents ${\text {SMD}_2}/{\text {SMD}_1} = ({\mu _2}/{\mu _1} )^{{1}/{6}} = ({1}/{4})^{{1}/{6}} = 0.79$. Thus, the mean diameter of saliva could decrease by up to 21 % due to the change in viscosity induced by eating or drinking.
3.4.2. Effect of surface tension
We changed the surface tension of the liquids in two ways, using ethanol and surfactants (SDS). To characterize our experimental observations, we investigated the droplet size distributions and mean drop diameters of the liquids. Figure 6 shows the droplet size distribution and SMD measurements conducted at 1 bar. As can be seen in figures 6(a) and 6(b), when the surface tension decreases, smaller droplets are formed. The droplet size distributions of both ethanol–saliva A and ethanol–saliva B mixtures show that lowering the surface tension results in the formation of smaller droplets. Although the ethanol–saliva mixtures show clearly the effect of surface tension on the droplet size, surfactant–saliva mixtures do not alter the size distribution as significantly (see figure 6c,d). For the surfactants case, the time scale of the breakup of the liquid sheets could be retarded compared with the ethanol–saliva mixture. Because, in the surfactant thin film, immediately after a surface of the thin film is stretched, the surface tension could be comparable to that of pure saliva liquid; the equilibrium value is only reached after a certain time, which depends on the diffusion rate and the adsorption rate of the surfactant (Gildnyi, Stergiopoulos & Wolfram Reference Gildnyi, Stergiopoulos and Wolfram1976).

Figure 6. The effect of surface tension on the droplet size at 1 bar. The droplet size distribution of (a) ethanol–saliva A, (b) ethanol–saliva B, (c) SDS–saliva A and (d) SDS–saliva B mixtures. (e) The effect of surface tension on the SMD.
The effect of surface tension on the droplet size is further characterized using the SMD, as shown in figure 6(e). The SMD results show a power-law dependence on the surface tension. Our experiments show that the surface tension of saliva could decrease from around  $72$ to $27\ {\rm mN}\ {\rm m}^{-1}$ during eating or drinking. Keeping other parameters constant, this represents ${\text {SMD}_2}/{\text {SMD}_1}=({\sigma _2}/{\sigma _1})^{{1}/{3}} = 0.72$. Thus, the mean diameter of saliva could decrease by up to 28 % due to the change in surface tension induced by eating or drinking. This observation has important implications; much of the food we eat consists of surfactants, both natural and synthetic, that can lower the surface tension in the mouth during eating, and alcoholic beverages also can lower the surface tension of saliva due to their ethanol content. Therefore, food can lower the surface tension of saliva, which leads to the formation of smaller droplets from expelled liquids during eating.
3.4.3. Theoretical background
The disintegration of a viscous liquid sheet into unstable ligaments, which eventually break down into droplets, has been thoroughly discussed by Dombrowski & Johns (Reference Dombrowski and Johns1963). They found an expression for the diameter of the ligament  $d_L$ (cm) in terms of the operating conditions
 \begin{equation} d_L = 0.9614\left [\frac{k^2\sigma^2}{\rho_{a}\rho_{L}U^2} \right ]^{{1}/{6}}\left [ 1 + 2.6 \mu_L \left ( \frac{k\rho_{a}^{4}U^8}{72\rho_{L}^{2}\sigma^5} \right )^{{1}/{3}} \right ]^{{1}/{5}}, \end{equation}
where  $\sigma$ ( ${\rm mN}\ {\rm m}^{-1}$) is the liquid surface tension, $\mu _L$ (mPa s) is the liquid viscosity, $\rho _a$ ( ${\rm g}\ {\rm cm}^{-3}$) is the density of the surrounding medium, $\rho _L$ ( ${\rm g}\ {\rm cm}^{-3}$) is the density of the liquid, $U$ (
$U$ ( ${\rm cm}\ {\rm s}^{-1}$) is the velocity of the radiating sheet and $k$ is a constant obtained by choosing a hyperbolic relationship between the sheet thickness $h$ and the time $t$; i.e. $ht = k$.
The relation between the drop size and wavenumber, assuming the waves grow until their amplitude equals the ligament radius, is given by
 \begin{equation} D_{32}^{3} = \frac{2{\rm \pi} d_{L}^{2}}{n}. \end{equation}
Combining (3.10) and (3.11) results in
 \begin{equation} D_{32} = 1.88 d_L [1+3Oh]^{{1}/{6}}, \end{equation}
where  $Oh = \mu _L/(\rho _{L}\sigma d_L)^{1/2}$ is the Ohnesorge number. For the liquids in our study, $Oh\ll 1$, giving
 \begin{equation} D_{32} \simeq 1.88 d_L \sim \sigma^{{1}/{3}} \end{equation}
which explains our experimental observations of SMD dependency on the surface tension. Dombrowski & Johns (Reference Dombrowski and Johns1963) compared (3.12) with experimental data and a subsequent empirical equation developed by Hasson & Mizrahi (Reference Hasson and Mizrahi1961) given by
 \begin{equation} D_{32} = 0.071 \left [\frac{k^2\sigma^2}{\rho_{L}U^2} \right ]^{{1}/{6}} \mu^{{1}/{6}}, \end{equation}
and found that the two equations (3.12) and (3.14) compare favourably with each other in the experimental range of  $3\ {\rm mPa}\ {\rm s} <\mu _L < 25\ {\rm mPa}\ {\rm s}$, which is similar to the viscosity range in our experiment.
4. Conclusion
In this work, we studied the atomization morphology of mixtures containing artificial saliva in which the surface tension and dynamic viscosity were varied. Using high-speed shadowgraph experiments, we visualized the evolution of the breakdown of artificial saliva mixtures. We observed that the breakup time decreases and the breakup length increases as the velocity of the impinging airflow increases. Using scaling arguments based on the forces acting on the growing liquid column, we derived a theoretical model that explicates our experimental observations. Furthermore, we found that the fragmentation time of saliva filaments is approximately an order of magnitude higher than that of low-viscosity Newtonian fluids. We also estimated that the mean diameter of the artificial saliva mixtures can decrease by up to 21 % due to viscosity changes and by up to 28 % due to surface tension changes. Although the precise effect of different foods on the physical properties of saliva is complex, we expect that in general the physical property changes of saliva brought about by eating and drinking would decrease the mean droplet size during sneezing or coughing events by up to 43 %. Smaller droplets derive the airborne transmission pathway of pathogens since they remain suspended for a longer time and can travel a larger distance than do larger droplets. Therefore, we conclude that eating and drinking change the physical properties of saliva in a way that likely facilitates the airborne transmission of pathogens via expelled respiratory droplets, although it is unclear how long the effects would last after swallowing. Thus, in addition to the other physiological and hydrodynamic factors discussed in other studies, the effect of eating and drinking should also be carefully considered to minimize airborne disease transmission.
Supplementary movie
Supplementary movie is available at https://doi.org/10.1017/jfm.2023.185.
Funding
This work was supported by the ‘Development of indoor airflow control and air purification technology’ project through the National Research Council of Science & Technology (NST), funded by the Ministry of Science (CPS-21-02-KICT) in South Korea. Also, this work was partially supported by the Basic Science Research Program through the National Research Foundation (NRF) of Korea funded by the Korean Government (MSIT: 2021R1A2C2007835).
Declaration of interests
The authors report no conflict of interest.


 Open access