


Archaeologists have a responsibility to educate the public about the knowledge they produce and the methods they use to do so (Kintigh Reference Kintigh1996). Despite this responsibility, archaeologists have often fallen into modes of archaeological practice that treat the public's lack of engagement with archaeological data as evidence of either their lack of interest in or their inability to understand serious archaeological practice (Grima Reference Grima2016). The latter, categorized and sometimes critiqued as the “deficit model” of public archaeology, implicitly suggests that archaeologists view the public as needing education in order to understand how to appreciate the archaeological record (Merriman Reference Merriman2004; Richardson and Almansa-Sánchez Reference Richardson and Almansa-Sánchez2015). The “multiple perspective model” is an alternative approach that frames the public as central to knowledge generation and relies on the audience to bring their own experience to the table. In doing so, differing audiences would ideally participate in and enjoy the creation of archaeological knowledge through hands-on or interactive engagement (Merriman Reference Merriman2004; Williams et al. Reference Williams, Thompson, Orr, Birley and Taylor2019).
PUBLIC ARCHAEOLOGY, HYPERMEDIA, AND DEEP MAPPING
Following the multiple perspective model, digital and 3D approaches to cultural heritage can provide opportunities for the public to engage directly with the archaeological record (Williams et al. Reference Williams, Thompson, Orr, Birley and Taylor2019). Multimedia approaches have strong potential for engaging the public in the processes of archaeological data collection, as a topic related to but separate from learning about the data (Baione et al. Reference Baione, Johnson, Megale and Luigini2018; Pavlidis et al. Reference Pavlidis, Liritzis, Levy, Vincent, López-Menchero Bendicho, Ioannides and Levy2017). In addition to increasing the accessibility of data acquisition, multimedia-focused projects can generate a reflexive and inclusive atmosphere for interpretation of archaeological data. In particular, 3D visualization has immense potential for generating an immersive experience for members of the public that mimics the reality of experiencing a site (Berggren et al. Reference Berggren, Dell'Unto, Forte, Haddow, Hodder, Issavi, Lercari, Mazzucato, Mickel and Taylor2015; Forte Reference Forte2010, Reference Forte2011, Reference Forte2014; Forte and Siliotti Reference Forte and Siliotti1997; Garstki et al. Reference Garstki, Larkee and LaDisa2019; Knabb et al. Reference Knabb, Schulze, Kuester, DeFanti and Levy2014; Levy, Ben-Yosef, and Najjar Reference Levy, Ben-Yosef, Najjar, Levy, Najjar and Ben-Yosef2014) or as a framework for storytelling (Bonacini et al. Reference Bonacini, Tanasi and Trapani2018; Hupperetz et al. Reference Hupperetz, Carlani, Pletinckx and Pietroni2012; Smith et al. Reference Smith, Walford and Jimenez-Bescos2019; Srour et al. Reference Srour, Mangan, Hoff, Margolis, Block, Vincent, DeFanti, Levy, Kuester, Levy, Schneider and Propp2015). Furthermore, the use of hypermedia—documents in which topics, information, and multimedia elements are linked in a text and available for free-form exploration rather than strictly sequential storytelling—can amplify this potential, as the use of interactive links and features allows users to create their own path through the data and generate their own interpretations (Bertemes and Biehl Reference Bertemes, Biehl, van Londen, Kok and Marciniak2009). These hypermedia documents should ideally be interactive and present a baseline of archaeological knowledge that provides avenues for further exploration of particular topics. This format can facilitate engagement by users of differing backgrounds and familiarity with the information, all while featuring many types of archaeological data and information represented in varying ways (Pujol et al. Reference Pujol, Roussou, Poulou, Balet, Vayanou, Ioannidis, Earl, Sly, Chrysanthi, Murrieta-Flores, Papadopoulos, Romanowska and Wheatley2012). Fortunately, the types of data that allow for this type of engagement are increasingly available.
Relatedly, the concept of “deep mapping” may serve as a framework in which archaeologists can bring the data that they collect and analyze for research purposes to bear in engaging the public in interactive ways. Narrative is necessarily temporal and spatial, as stories are always situated in these ways (Bodenhamer Reference Bodenhamer, Bodenhamer, Corrigan and Harris2015). As scholars of time and space, archaeologists are well positioned to address this challenge of situating a story. Yet, beyond simply illustrating what happened when, deep mapping is a process of providing multiple layers of representations and multiple forms of media in a way that is by definition not static and may tell multiple stories (Earley-Spadoni Reference Earley-Spadoni2017). Narrative from the perspective of deep mapping involves the use of various forms of documentation that come together cohesively while not forsaking the individual threads of evidence for the whole (Bodenhamer Reference Bodenhamer, Bodenhamer, Corrigan and Harris2015)—similar to hypermedia. A deep map should also be multiscalar, in both space and time (Roberts Reference Roberts2016). In this as well, a relationship to hypermedia is clear, in that the exploration of many datasets of different types and scales can both expose and generate new understanding. Ultimately, there is a need for approaches to public archaeology that make use of digital datasets in engaging and interactive ways. Earley-Spadoni (Reference Earley-Spadoni2017) highlights Esri's ArcGIS StoryMaps as one platform that may allow for the type of interactive, hypermedia deep mapping that can serve as a way to combine many threads of evidence into digital storytelling.
ARCHAEOLOGY IN A DIGITAL AGE
The types of multimedia archaeological datasets that can catalyze interactive engagement by the public with the processes of archaeological investigation and with the actual archaeological record itself are now commonly collected by archaeological projects as a standard practice. These datasets, though typically collected to facilitate archaeological interpretation and documentation, can also serve as the basis for effective and engaging public outreach. As digital tools are becoming a standard part of the archaeological tool kit, there are growing opportunities for involving the public in the archaeological process through exposure to these methods and datasets.
One of these types of data is geographic data, collected, managed, and analyzed with geographic information systems (GIS). GIS software packages are used by nearly all archaeological projects today. Archaeology, as a fundamentally spatial field, requires the use of some way to track and perform analysis on the locations of artifacts and sites. GIS is often used as a framework for analyses in landscape archaeology (Howey and Brouwer Burg Reference Howey and Burg2017; Parcak Reference Parcak2017). To that end, two types of analysis of how people interact with their landscape through sight and movement, visibility (e.g., Bernardini et al. Reference Bernardini, Barnash, Kumler and Wong2013; Dungan et al. Reference Dungan, White, Déderix, Mills and Safi2018), and cost path analysis (Gustas and Supernant Reference Gustas and Supernant2019; Taliaferro et al. Reference Taliaferro, Schriever and Shackley2010) are frequently applied to archaeological datasets. Even more common is the use of GIS for spatial database management, where GIS allows archaeologists to perform typical spatial documentation but in a more efficient manner (Howey and Brouwer Burg Reference Howey and Burg2017; Verhagen Reference Verhagen, Siart, Forbriger and Bubenzer2017). In practice, the use of GIS for storing and maintaining spatial data often necessitates a rigorous, digital data collection methodology (which may include photogrammetry as a complementary method for top plan drawing; Berggren et al. Reference Berggren, Dell'Unto, Forte, Haddow, Hodder, Issavi, Lercari, Mazzucato, Mickel and Taylor2015; Levy and Smith Reference Levy, Smith, Levy, Daviau, Younker and Shaer2007; Olson et al. Reference Olson, Placchetti, Quartermaine and Killebrew2013). In addition, the generation of maps for publication is nearly universal among field projects. Thus, spatial data, collected in a GIS framework, are collected and stored by most institutions engaged in archaeological work, though frequently published in only limited ways. Indeed, GIS is often applied by archaeologists for data collection or analysis rather than for outreach or engagement, despite its potential in these realms (Earley-Spadoni Reference Earley-Spadoni2017).
The generation of 3D models of archaeological units and sites, though not necessarily a standard practice, is also increasingly common. Archaeological projects most often collect 3D data through laser scanning or digital photogrammetry, either of which can be applied terrestrially or aerially with varying degrees of viability (Howland Reference Howland, Levy and Jones2018). Terrestrial photogrammetry, as alluded to above, can be a valuable tool for generating spatial data over the course of excavation and documenting its progress (De Reu et al. Reference De Reu, De Smedt, Herremans, Van Meirvenne, Laloo and De Clercq2014; Howland et al. Reference Howland, Kuester and Levy2014a; Olson et al. Reference Olson, Placchetti, Quartermaine and Killebrew2013; Peng et al. Reference Peng, Lin, Guo, Wang and Gao2017). Generating 3D models from images taken from the ground is also likely the most cost-effective method of generating 3D data (Haukaas and Hodgetts Reference Haukaas and Hodgetts2016). Aerial photogrammetry, though somewhat more expensive as it requires an elevated camera platform, has seen dynamic growth as a tool of archaeological 3D modeling in recent years. This approach has seen widespread use for 3D documentation of sites (Carvajal-Ramírez et al. Reference Carvajal-Ramírez, Navarro-Ortega, Agüera-Vega, Martínez-Carricondo and Mancini2019; López et al. Reference López, Antonio, Jiménez, Romero, Garcia, Martín, Medina and Guerrero2016; Sauerbier and Eisenbeiss Reference Sauerbier, Eisenbeiss, Mills, Barber, Miller and Newton2010). Also common is the use of photogrammetric modeling for the generation of spatial data that facilitate GIS-based mapping (Hill et al. Reference Hill, Rowan and Kersel2014; Howland et al. Reference Howland, Kuester and Levy2014a; Reshetyuk and Mårtensson Reference Reshetyuk and Mårtensson2016; Uysal et al. Reference Uysal, Toprak and Polat2015; Verhoeven et al. Reference Verhoeven, Doneus, Briese and Vermeulen2012). In short, digital photogrammetry is already widely applied and likely to become even more common due to its cost-effectiveness (Fernández-Hernandez et al. Reference Fernández-Hernandez, González-Aguilera, Rodríguez-Gonzálvez and Mancera-Taboada2015; Howland Reference Howland, Levy and Jones2018). As with many digital tools, the extent to which projects will be able to apply 3D technology depends on their funding and hardware resources. However, the decreasing cost and the ease of digital photogrammetry mean that even less well-funded projects should be able to collect some amount of 3D data in the field.
In general, the proliferation of archaeological 3D data collections provides excellent opportunities for their distribution and use in public outreach and storytelling, though the availability of these data does not necessarily result in quality public archaeology. Archaeologists have recognized the vast potential of GIS and 3D data collection for documentation and analysis, but they are only beginning to take full advantage of the capability of photogrammetric 3D models for public-facing interactive engagement (Earley-Spadoni Reference Earley-Spadoni2017). Often, digitized collections are not shared widely with the public, as they are part of active, unpublished research projects (Scopigno et al. Reference Scopigno, Callieri, Dellepiane, Ponchio and Potenziani2017). However, for projects interested in engaging the public, sharing 3D data is straightforward and can be free. For example, Sketchfab, an online 3D model hosting platform with free and paid tiers, can be used to good effect for providing the public with access to 3D models of archaeological artifacts and sites (Baione et al. Reference Baione, Johnson, Megale and Luigini2018; Means Reference Means2015; Scopigno et al. Reference Scopigno, Callieri, Dellepiane, Ponchio and Potenziani2017). Sketchfab allows for some degree of explanation and contextualization of models within the platform and can also allow for more immersive virtual reality and augmented reality experiences (Ellenberger Reference Ellenberger2017). However, publication of 3D models as individual files in an online database fails to appropriately contextualize the artifacts within their archaeological, geographic, cultural, or historical framework (Lloyd Reference Lloyd, Ioannides, Fink, Moropoulou, Hagedorn-Saupe, Fresa, Liestøl, Rajcic and Grussenmeyer2016). As such, even publishing of archaeological 3D data to the public may not take full advantage of the opportunities provided by the increasing availability of these datasets.
ARCGIS STORYMAPS
Esri's ArcGIS StoryMaps is an online digital storytelling platform centered on situating digital datasets in a narrative format. The platform allows content creators to add text, photographs, videos, 3D models, and maps created using Esri's online mapping interface, ArcGIS Online, to a web page where users can access additional content by scrolling down through different slides. As such, StoryMaps can be a useful platform for publishing digital archaeological data, situated appropriately with contextual information that users can explore according to their own interest. Overall, ArcGIS StoryMaps can be an effective tool for education and digital engagement for any number of public outreach projects (Antoniou et al. Reference Antoniou, Nomikou, Bardouli, Lampridou, Ioannou, Kalisperakis, Stentoumis, Whitworth, Krokos, Ragia, Grueau, Laurini and Ragia2018; Cope et al. Reference Cope, Mikhailova, Post and Carbajales-Dale2018; Kallaher and Gamble Reference Kallaher and Gamble2017; Strachan and Mitchell Reference Strachan and Mitchell2014). Within archaeology, however, StoryMaps has been the subject of only limited use despite the application's apparent suitability for archaeological storytelling (Alemy et al. Reference Alemy, Hudzik and Matthews2017; Amico Reference Amico2019; Malinverni et al. Reference Malinverni, Pierdicca, Colosi and Orazi2019). We aim to consider the viability of StoryMaps for archaeological public outreach and ultimately suggest that the platform can be a powerful tool for archaeologists, primarily based on three main characteristics that recommend its use to scholars interested in digital storytelling in a hypermedia or deep mapping context: its ease of use, its compatibility with many different types of datasets, and its interactivity.
Evaluating ArcGIS StoryMaps requires a look at not only its utility but also its cost-effectiveness and viability vis-à-vis other similar platforms. StoryMaps requires, at minimum, an ArcGIS Online “Creator” license costing $500/year. Hosting large archaeological datasets on ArcGIS Online also requires the use of “credits,” the availability of which depends on license level. As such, the platform can be cost-prohibitive for scholars who do not already have access to Esri's suite of services through an institutional license. Several viable open-source alternatives to ArcGIS Online's web mapping platform exist, including Leaflet and MapServer, with Mapbox also representing a paid option with a free tier of use. While web mapping alternatives are readily available, platforms allowing for the use of multiple web maps as a framework for interactive storytelling, as ArcGIS StoryMaps does, are less common. One open-access platform, StoryMapJS, provides an appealing interface with the ability to integrate various forms of data. However, StoryMapJS fails to allow for much of the open-ended mapmaking, including uploading user-generated datasets, that is possible through ArcGIS Online and ArcGIS StoryMaps. Mapme is another alternative allowing for map-based storytelling. The platform features (very limited) free functionality, though generating maps with user-collected datasets in Mapme requires a paid subscription, costing $348+/year. Unfortunately, the outputs produced through Mapme are not as refined as those produced by ArcGIS StoryMaps in their visual appeal and overall sophistication. In addition to cost and functionality, another concern with digital platforms is their life cycle of support. For example, one digital map-based storytelling platform that has been highlighted as a StoryMaps alternative, MapStory (Earley-Spadoni Reference Earley-Spadoni2017), now appears to lack functionality. The reported support timeline for Esri's StoryMaps app runs through 2024 and beyond, which may be the limit of what one can expect in today's rapidly changing digital environment. Given these aspects of the StoryMaps platform, the Esri product is a superior choice over the available alternatives when economically viable.
With regard to the usability of ArcGIS StoryMaps, stories in the program are created through a straightforward interface in which content can be edited in a form that matches the finished output. In other words, content creators and researchers are able to construct their StoryMaps without having any knowledge of coding or how to construct a web page. This means that archaeologists should be able to easily construct a compelling narrative regarding their fieldwork or an archaeological site or region with no more technical knowledge required than what it would take to construct a PowerPoint presentation. While the platform has a relatively high ceiling in terms of the level of interactivity it is possible to allow for, at its most basic level, a StoryMap need not be more complex than narrative text with embedded pictures or static maps. Additionally, this simple and adaptable format allows a StoryMap to be easily updated with additional research or feedback from the public. This feature can be important in allowing for stories about archaeological heritage to be updated with multiple perspectives of stakeholders.
Another main benefit of using the StoryMaps platform is its compatibility with the types of sophisticated digital datasets that are increasingly collected by archaeological field projects as a matter of normal practice. Most prominently, StoryMaps allows for the integration of maps created or published in Esri's ArcGIS Online platform. While paper maps can be useful and aesthetically pleasing, we are now in an era where “interactive and immersive” representations of archaeological data and processes are possible (McCoy and Ladefoged Reference McCoy and Ladefoged2009), through platforms such as ArcGIS Online. Maps on ArcGIS Online and other web mapping platforms are interactive, allowing users to manipulate the map extent (by zooming, panning, etc.) and also click different map features to open pop-ups in order to learn more. These platforms provide users with an ability to explore spatial data to an extent not possible with printed maps (Smith Reference Smith2016). This interactivity is critical for hypermedia and deep mapping concepts and has also been used effectively to provide additional levels of engagement even to articles published in traditional academic outlets, which are not typically interactive (Hammer and Ur Reference Hammer and Ur2019). Content creators can customize the pop-ups that appear upon clicking map features to provide additional levels of information and interactive content, including text, photographs, and even other StoryMaps, generating multiple layers of hypermedia content that users can explore at their own pace and according to their own interests.
In addition to highly interactive online maps, StoryMaps also straightforwardly allows for the inclusion of digital photographs, videos, and 3D models, which can facilitate additional engagement with the archaeological stories being told beyond the accompanying text narrative. The inclusion of 3D data should provide a bridge from textual storytelling that only hints at place to 3D recordings or reconstructions of place that can heighten immersion. In general, map-based platforms such as StoryMaps or GIS suffer from a bias toward an absolute perspective toward space, in which Euclidean distances and measurements take primacy over experiential, phenomenological, or topological depictions (O'Sullivan et al. Reference O'Sullivan, Bergmann and Thatcher2018). Photographs, videos, and 3D models can help to resolve this bias to some extent, as they can represent immersive rather than top-down or absolute perspectives. Archaeologists often already have many of these digital datasets on hand due to twenty-first-century archaeological practice and can facilitate the introduction of such data to users through StoryMaps. In doing so, archaeologists can introduce users to the stories of ancient societies and the methods of archaeological practice. Of course, not all projects are predisposed to making use of sophisticated digital datasets. However, generating a compelling StoryMap does not require projects to make use of expensive field recording technology. Even simple spatial datasets such as, for example, the locations of important sites in a region, images of those sites and artifacts recovered there, and videos taken at the site can provide a dynamic framing for an archaeological narrative within StoryMaps. Moreover, given that advanced digital recording methods are increasingly affordable and applicable without purchase of specialized tools and software, even less well-funded projects should be able to apply digital datasets to generate deep mapping environments within StoryMaps.
CASE STUDY: THE ARCHAEOLOGY OF FAYNAN, JORDAN
In order to demonstrate the applicability of StoryMaps for archaeological deep mapping, storytelling, and public engagement, we used datasets collected from recent excavations in Faynan, Jordan. Faynan is located approximately 30 km south of the Dead Sea in the deserts of southern Jordan. This region is also one of the largest copper ore resource zones in the Levant. These copper ores were intermittently exploited throughout history from roughly the Early Bronze Age until the Islamic period. The archaeology of Faynan has been the focus of the Edom Lowlands Regional Archaeology Project (ELRAP), a collaboration between the University of California San Diego and the Department of Antiquities, Jordan (principal investigator: Thomas E. Levy; co–principle investigator: Mohammad Najjar; Levy, Ben-Yosef, and Najjar Reference Levy, Ben-Yosef, Najjar, Levy, Najjar and Ben-Yosef2014), since 1997. ELRAP investigates the relationship between social complexity and industrial-scale copper production particularly during the Early Iron Age (ca. 1200–800 BC) through a combination of surveys and excavations (Ben-Yosef Reference Ben-Yosef2010; Levy, Ben-Yosef, and Najjar Reference Levy, Ben-Yosef, Najjar, Levy, Najjar and Ben-Yosef2014). The Iron Age in Fayan is the period of the most intense copper smelting, with an estimated 33,000–36,000 tons of produced metallic copper (Ben-Yosef Reference Ben-Yosef2010).
Much of our understanding of Faynan during the Iron Age comes from the ELRAP excavations at the main copper smelting sites dating to the period, primarily Khirbat en-Nahas, Khirbat al-Jariya, and Khirbat al-Ghuwayba. Khirbat en-Nahas is the largest Iron Age copper smelting center in Faynan (Levy, Najjar, et al. Reference Levy, Najjar, Higham, Arbel, Muniz, Ben-Yosef, Smith, Beherec, Gidding, Jones, Frese, Smitheram, Robinson, Levy, Najjar and Ben-Yosef2014). The site includes the collapsed architecture of more than 100 buildings and an estimated 50,000–60,000 tons of copper slag, the waste by-product of copper smelting, still visible on the surface (Hauptmann Reference Hauptmann2007; Levy, Najjar, et al. Reference Levy, Najjar, Higham, Arbel, Muniz, Ben-Yosef, Smith, Beherec, Gidding, Jones, Frese, Smitheram, Robinson, Levy, Najjar and Ben-Yosef2014). Similar to Khirbat en-Nahas, Khirbat al-Jariya is characterized by architectural collapse and slag mounds (Ben-Yosef et al. Reference Ben-Yosef, Levy, Higham, Najjar and Tauxe2010, Reference Ben-Yosef, Najjar, Levy, Levy, Najjar and Ben-Yosef2014). Located circa 3 km to the northeast of Khirbat en-Nahas, the site straddles the Wadi al-Jariya covering an area of approximately 4.8 ha and features circa 15,000–20,000 tons of copper slag. ELRAP also conducted excavations at Khirbat al-Ghuwayba, a smaller-scale smelting site located about 4 km east of Khirbat en-Nahas (Ben-Yosef et al. Reference Ben-Yosef, Najjar, Levy, Levy, Najjar and Ben-Yosef2014). While Khirbat al-Ghuwayba has been less extensively excavated, its location near a local spring and archaeobotanical analysis of materials collected at Khirbat al-Jariya suggest that it might have served the additional function of provisioning contemporaneous smelting centers. Together, these three smelting sites, along with smaller mining camps throughout the region, were central to the industrial landscape of Iron Age Faynan and the first complex society in the region; the access to abundant copper ores was critical to this development.
To investigate these sites, ELRAP uses methods of cyberarchaeology, applying methods of computer science, natural science, and engineering to archaeological research (Levy, Ben-Yosef, and Najjar Reference Levy, Ben-Yosef, Najjar, Levy, Najjar and Ben-Yosef2014; Levy et al. Reference Levy, Petrovic, Wypych, Gidding, Knabb, Hernandez, Smith, Schulz, Savage, Kuester, Ben-Yosef, Buitenhuys, Barrett, DeFanti and Forte2010, Reference Levy, Smith, Najjar, DeFanti, Lin and Kuester2012). ELRAP records high-precision coordinates of artifact locations and locus perimeter/depth using a total station on a daily basis. This digital recording of spatial data facilitates easy integration into GIS, as data from the total station can be directly imported into GIS platforms. All geospatial data collected on ELRAP projects are visualized and further analyzed using Esri's ArcGIS. ArcGIS is also essential for digitizing archaeological features at a site to produce site/excavation maps (discussed further below). The combination of the total station and GIS maintains a digital record of all necessary geospatial information connected to the archaeological record from the moment it is excavated through final data storage and publication.
In addition to GIS-based recording, ELRAP projects also collect spatially referenced 3D data through systematic photography of excavations for the generation of publication-quality imagery and photogrammetry (terrestrial and aerial). These images and the models that derive from them serve as an excellent basis for digital multimedia outreach. For models of larger areas, ELRAP has employed aerial photography using a helium balloon with an attached camera frame (Howland et al. Reference Howland, Kuester and Levy2014b). All of the produced models are also georeferenced using ground control points in order to orient them in space and to geographically connect the models to the archaeological data. Using photogrammetry during the excavation serves two functions: (1) to produce 3D models that provide a photorealistic digital record of the site/excavations at that moment and (2) to produce digital elevation models and orthophotographs that provide an ideal base for site mapping of archaeological features in GIS. Ground photogrammetry and aerial photogrammetry, as discussed above, are increasingly cost-effective and practical approaches to recording for archaeological projects. The combination of a digital recording strategy, comprehensive digital photography, detailed geospatial data, and photorealistic 3D models of the archaeological record provides a wealth of data that can facilitate interactive engagement with the archaeological past. As a spatial aspect to data is critical to archaeological research, much of the digital data collected by ELRAP—and many archaeological projects—is spatially referenced. This includes inherently spatial data such as digital elevation models, orthophotographs, and mapped site features, as well as the 3D data collected on the project. The availability of these datasets is an advantage for digital public outreach, though the priority for outreach is providing an engaging and entertaining narrative allowing for immersive engagement rather than showcasing elaborate datasets.
THE KINGDOM OF COPPER STORYMAP
The ELRAP team generated a StoryMap focusing on the Iron Age polity centered in Faynan titled The Kingdom of Copper (Figure 1). This StoryMap is intended to perform digital storytelling and deep mapping through an interactive hypermedia framework. Many of the digital datasets collected through ELRAP's cyberarchaeology field and lab methods are featured in the StoryMap, including digital maps of environmental characteristics, architecture, and material remains from sites in Faynan, as well as digital photography and 3D models. Many of these datasets required little modification in order to bring into StoryMaps as they are inherently digital.

FIGURE 1. Please access The Kingdom of Copper StoryMap through this link: http://bit.ly/Faynan. The StoryMap is also accessible by scanning this QR code with a smartphone.
In order to generate the StoryMap, team members developed an iterative planning process to ensure that the StoryMap would meet its goals of digital public outreach in an interactive mapping environment (Figure 2). This process can serve as one model for how to conceptualize and develop an interactive public outreach project using digital data in ArcGIS StoryMaps (Alemy et al. [Reference Alemy, Hudzik and Matthews2017] provides an excellent overview of the technical process of creating a StoryMap). In general, our strategy was to make sure that narrative and engaging users in the archaeological process drove the framing of the StoryMap, rather than designing the product based on the availability of datasets. To that end, our first stage in generating the StoryMap was to create a storyboard conceptualizing the story elements important to framing the archaeology of Faynan, Jordan, in its appropriate context. Next, it was important to write the text to be laid out in the StoryMap, telling a story based on archaeological information rather than the suitability of existing maps, images, or 3D models for accompanying the story elements. Writing a compelling story based on archaeological information is challenging, and researchers may benefit from collaboration with experienced storytellers. Analyzing and developing media to complement the text is also necessary, though this should be taken up after storyboarding and writing the StoryMap narrative. In many cases, projects will be able to publish existing project maps including GIS vector and raster data to ArcGIS Online or existing photogrammetric models to Sketchfab with minimal modifications, though in some cases it will be necessary to involve new datasets to contextualize the text. Importantly, our project only developed the StoryMap after fieldwork, without orienting field data collection toward creating this type of digital outreach project. As argued above, many projects will be in a position to also integrate normally collected digital data into a StoryMap. After writing the text and considering and developing media, we installed both text and media elements into the StoryMap. In order to engage readers through our grounding concepts of deep mapping and hypermedia, it is essential to ensure that map elements feature high levels of complexity and interactivity. Thus, maps should be edited to ensure that additional levels of information are available for users to explore and engage with if they are interested. Only at this stage did we publish the StoryMap. However, even the published version of the StoryMap was not considered a final product. Since publishing the StoryMap, we have made many edits to the product, including the addition of a comment box designed to solicit feedback from the public, especially stakeholding groups in Faynan and Jordan. Through feedback in this comment box, we aim to continually redesign and rewrite the StoryMap in order to bring in different voices and stories to be heard and told. We have already redesigned and rewritten parts of the StoryMap in response to public feedback. Thus, we conceive of the StoryMap as a work in progress in perpetuity, subject to update at any time using StoryMaps’ straightforward editing tools. Overall, our process for StoryMap generation aims at establishing practices for developing interactive storytelling for public outreach that allows users to engage in a deep mapping environment that allows for interpretation of multiple layers of meaning. By developing an iterative process without a final draft, we aim to continually improve the outreach potential of the platform.
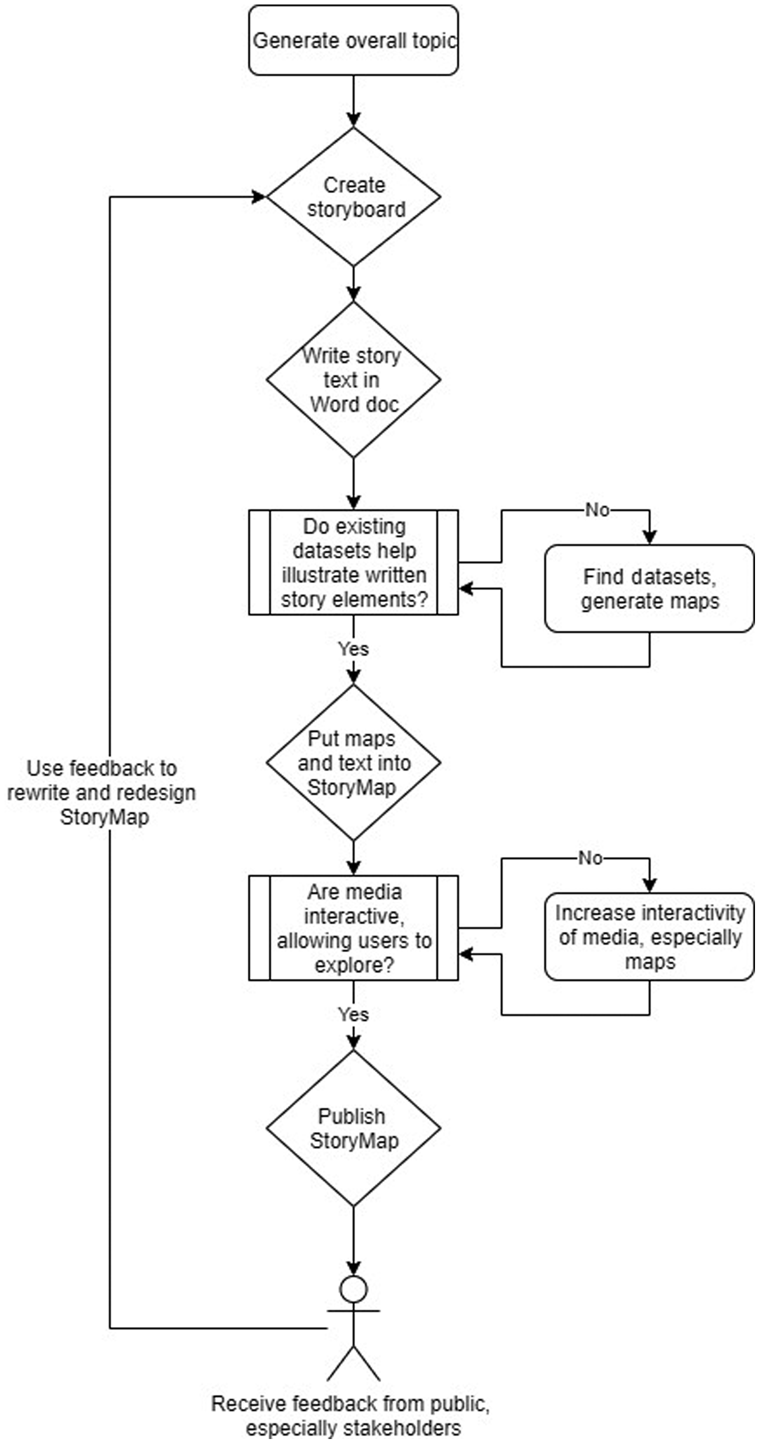
FIGURE 2. Flowchart showing the iterative process the Edom Lowlands Regional Archaeology Project team used to generate a StoryMap, with emphasis on continually rewriting the StoryMap to better reach intended audiences.
The current version of The Kingdom of Copper StoryMap is aimed at telling the story of how copper production in Faynan was able to lead to the development of complex society in the region during the Iron Age and of the archaeological methods used to interpret the region's archaeological record (e.g., Liss et al. Reference Liss, Howland, Lorentzen, Smitheram, Najjar and Levy2020). The first part of the StoryMap introduces readers to the Faynan region with an emphasis on its geographic location. In particular, this portion of the StoryMap includes a presentation of Faynan's regional context using satellite images on several scales and a gradient map with isohyets (contour lines representing zones of identical rainfall levels) depicting its level of precipitation up to the present and emphasizes its unique environment. StoryMaps’ basis in digital maps means that the platform is ideal for geographically situating archaeological analysis in space, while text descriptions accompanying maps can help readers situate the data and analysis in time.
The second part of the StoryMap provides insight into the drivers of the development of industry in Faynan in the Iron Age by introducing the audience to copper production and its role in the ancient world. At this point, the development of Iron Age social complexity around the abundant copper ores of Faynan is framed against the collapse of the Late Bronze Age economic system. Specifically, this section provides a discussion of the importance of slag as an indicator for copper production and a display of the many sites potentially destroyed in the Late Bronze Age as part of a regional collapse using a combination of interactive maps and photographs. Each map in this section is interactive through clickable pop-ups that allow users to learn more about topics in the story. The StoryMap then provides readers with an illustration of the geologic context to show the availability of copper and 3D visualizations of the major copper-producing sites (Khirbat en-Nahas and Khirbat al-Jariya). The ability to include photorealistic 3D models provides the audience with an authentic experience of the sites and the surrounding terrain and helps to provide a more immersive experience of the archaeological data, overcoming the bias of mapping outputs toward absolute conceptions of space. Our current understanding of the excavations (discussed above) is presented in the associated text. Primarily, the goals of this section of the StoryMap are to introduce readers to the types of evidence that archaeologists use to interpret the environment of the region and the history of the Late Bronze Age so that they can freely explore and understand these datasets on their own terms.
The StoryMap also features a section on the process of archaeological investigation. This section is aimed at engaging the public in how archaeologists conduct research at archaeological sites and what tools and techniques we use. The archaeological methods that led to the interpretations given in the StoryMap are presented, accompanied by videos and photographs. The videos allow the viewer to observe archaeology in practice while learning about how these techniques aid in developing our understanding of the past. The archaeology of Khirbat en-Nahas is highlighted with digitized maps, 3D models, and the opportunity to learn more about each excavation area through clicking and reading pop-ups for each area (Figure 3). Through the interactivity in these datasets, we hope to engage the public in the archaeological process, giving our perspective on how we acquire and interpret data but also providing the datasets themselves so that readers may explore as they are interested and take away their own conclusions. The final section of the StoryMap, discussed below, focuses on modern Faynan and community engagement.
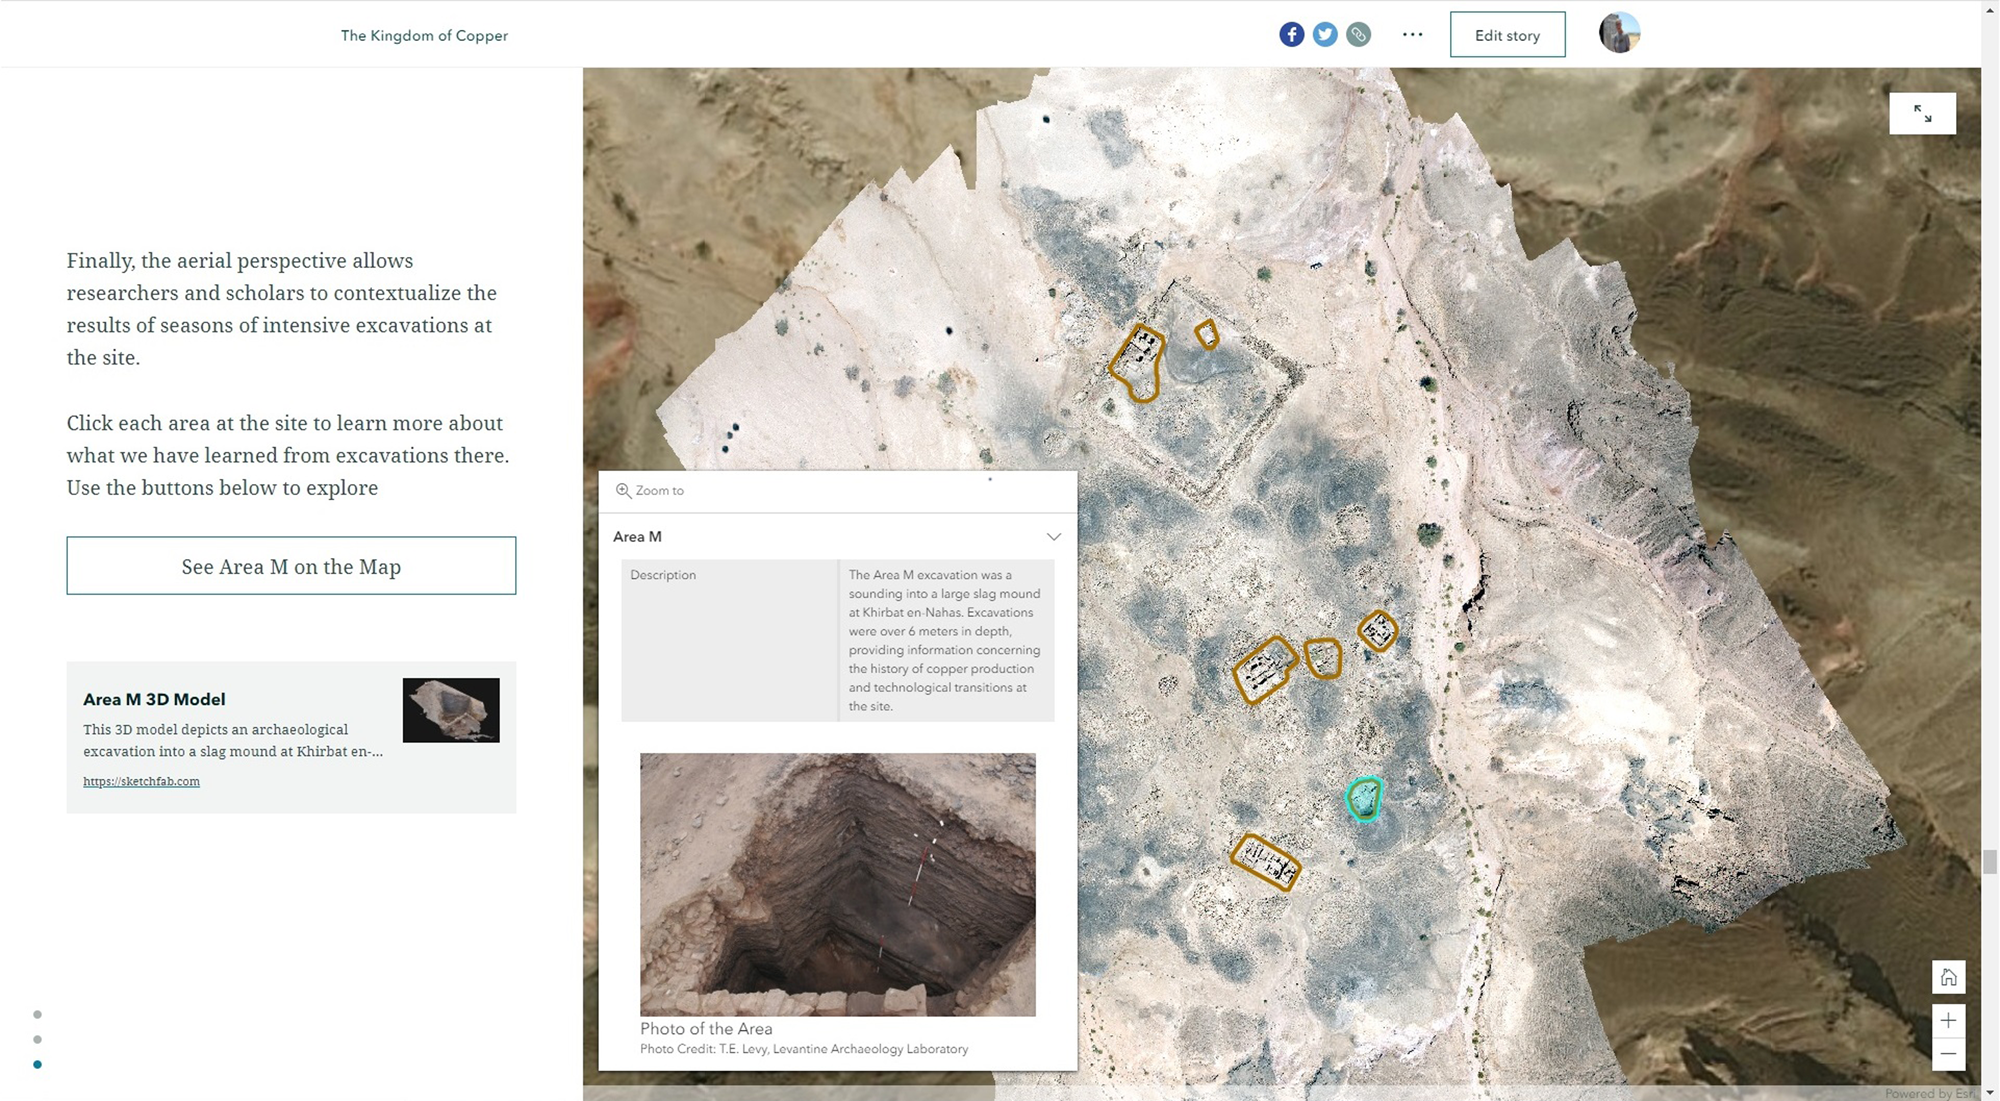
FIGURE 3. Screenshot of The Kingdom of Copper StoryMap, featuring an interactive map, written story elements, two buttons that allow zooming into the map or bringing up a 3D model, and a selected pop-up that provides more information about Area A, as well as a photograph of the area.
One key point of emphasis for us in constructing the StoryMap was to generate as many interactive elements as possible in order to provide a true hypermedia environment that allows for multiple levels of engagement. To that end, the StoryMap includes 13 interactive maps, nine of which have specific features that provide more information upon a click of an element in the map. These additional features include descriptions of sites, features, and empires, as well as images of sites and features. Also present in the StoryMap are two videos showing archaeological processes, five interactive 3D elements, hyperlinks to other relevant content, and dozens of photographs. As such, the StoryMap overall is heavily oriented toward providing engaging multimedia content that users can explore at their own discretion. This project ideally serves as an example of how StoryMaps can integrate many forms of digital data into an interactive deep mapping application. Though different projects will naturally approach archaeological storytelling and public outreach in different ways, this platform can provide a useful mechanism for digitally inclined projects to integrate datasets into a deep mapping environment with many interactive forms of media.
TOWARD COMMUNITY ENGAGEMENT
The final section of the StoryMap focuses on the local communities that reside in the region today, primarily members of the ‘Ammarin, Sa'idiyyin, Rashaydah, and ‘Azazmah tribes. Many in these communities are members of the ELRAP, and it is their cultural heritage that is addressed by the archaeological content of the StoryMap. As such, they play a primary and important role in how that heritage is investigated and interpreted. The “Faynan Today” section of the StoryMap provides recognition of these communities and their role in how their cultural heritage is to be understood.
However, this recognition is not, in and of itself, enough to say that the stakeholding communities have been “engaged.” Importantly, the people of Faynan and the nearby town Qirayqira play the most active role in the continuous reinterpretation of the cultural heritage of the Faynan region. This occurs most especially through their work at the Faynan Museum, an archaeology museum in the area; the Faynan Ecolodge, an eco-hotel that offers tours of archaeological sites by locals; and the Dana Biosphere Reserve, which preserves many of the important sites in Faynan. These locally operated organizations and the overall engagement of the communities of Faynan are critical in place-based education (Sobel Reference Sobel2005) and allow inhabitants of the region and visitors to engage with archaeological heritage at the source. This place-based learning is a necessity, especially to overcome a critical flaw in StoryMaps and internet-based digital storytelling—its inherent Eurocentric bias due to lack of equality in worldwide internet access (Bertemes and Biehl Reference Bertemes, Biehl, van Londen, Kok and Marciniak2009). StoryMaps may not be an appropriate avenue to overcome this inequality, as the platform is only accessible via the internet. This can mean that StoryMaps projects may be inherently geared toward a disproportionately wealthy, English-speaking, and literate audience. Scholars would do well to take heed and consider stakeholding groups when they approach archaeological projects through StoryMaps. In recognition of this need to engage not only English-speaking audiences, The Kingdom of Copper StoryMap is available in Arabic. Furthermore, we hope to install a version of the StoryMap in the Faynan Museum in order to reach members of the local community without internet access in person. We also aim to make use of the platform's compatibility with audio platforms by recording the text of the main story in order to increase the accessibility of the StoryMap to nonliterate users.
As StoryMaps are easily editable, when used for public engagement they should not be seen as an end product to show stakeholding communities but, rather, as a first draft that communities can engage with, edit, and use as a platform to tell their own stories and explain their own relationship with their cultural heritage. To work toward this ideal, we aim to show The Kingdom of Copper StoryMap to Jordanian citizens and the people of Faynan and discuss it with them in person. For digital interaction, the StoryMap also features a comment box, linked up through Esri's Survey123 application. Through this comment box, we hope to get feedback on the story told in the StoryMap and also elicit stories and contextual information from the Faynan community for inclusion in the StoryMap. Only by engaging local populations in this way can we successfully move beyond deficit-based learning models and adopt a multiple perspective model that treats the archaeological past as the living cultural heritage of people living today. Future work on the StoryMap in the community in Faynan will help reveal the extent to which this process is successful and help our understanding of whether or not StoryMaps can be effectively used for engagement of non-internet-connected local communities.
CONCLUSION
Esri's ArcGIS StoryMaps is an effective and straightforward tool for archaeologists to share their data and research. The interactivity of the platform allows for hypermedia and deep mapping outputs that facilitate engagement by the public in the archaeological past and with the archaeological process. The variety of digital datasets that are regularly collected by archaeologists in the twenty-first century nearly all lend themselves well to inclusion in the StoryMaps platform. This, along with the ease of sharing a StoryMap online, increases the accessibility of archaeological data. By framing datasets within a scrolling text story, archaeologists can contextualize their data while also allowing for the type of free-form interaction that allows for many forms of engagement. The Kingdom of Copper StoryMap serves as a case study of the usefulness of the StoryMaps platform for interactive multimedia public engagement. Ultimately, such digital outreach projects should be seen as works in progress to allow multiple perspectives to be shared, rather than as a final output set in stone.
Acknowledgments
Special thanks go to the American Center of Oriental Research, Samya Khalaf Kafafi for translating the StoryMap into Arabic, and members of the ELRAP team including the local Bedouin of Qirayqira and Faynan for their assistance in the field and the lab. This work was supported by a National Science Foundation Integrative Graduate Education and Research Traineeship Award under grant #DGE-0966375, “Training, Research and Education in Engineering for Cultural Heritage Diagnostics” (graduate student support for B.L. and M.D.H.); and major funding came from T.E.L.'s Norma Kershaw Chair, Department of Anthropology and Jewish Studies, University of California San Diego. Permissions for the August 2014 excavations were provided by the Department of Antiquities of Jordan.
Data Availability Statement
All digital data presented in this article are openly accessible through The Kingdom of Copper StoryMap itself and also on the Edom Lowlands Regional Archaeology Project's ArcGIS online page: https://ucsdonline.maps.arcgis.com/home/group.html?id=92071501deb9422eb1badb6c3c18d67a#overview.


 Open access