


Livestock farming systems experience social, environmental and economic challenges throughout the world. Animal production is expected to increase in the following years to feed the increasing human demand for animal products( Reference Robinson and Pozzi 1 ). Livestock farming systems also need to reduce their environmental impacts. They are associated with 14·5 % of the world’s human-induced greenhouse gas (GHG) emissions( Reference Gerber, Steinfield and Henderson 2 ), as well as with land use and eutrophication, especially in regions with high concentrations of livestock (e.g. north-western France, the Netherlands). The sources of environmental impacts of animal products are multifactorial, including crop production for feeds, enteric emissions (ruminant only), and emissions in buildings and from manure management. Depending on animal product (e.g. broiler v. layer), type of production system (e.g. conventional, free-range) and geographic location( Reference MacLeod, Gerber and Mottet 3 ), feed production contributes to 50–85 % of climate change impact, 64–97 % of eutrophication potential (EU), 70–96 % of energy use and nearly 100 % of land occupation (LO)( Reference Basset-Mens and van der Werf 4 – Reference Prudêncio da Silva, van der Werf and Soares 9 ), in monogastric systems. Methane from enteric fermentation is the main source of GHG emissions in dairy cattle and beef productions. Nevertheless, approximately 36 % of GHG emissions are associated to feed production, with differences among geographic regions of the world( 10 ). As environmental impacts of feeds are strongly determined by feed ingredients (ING), great potential exists to reduce environmental impacts of animal production by formulating low-impact feeds.
Traditional low-cost (LC) feed formulation uses linear programming to combine ingredients into feeds that simultaneously meet user-defined animal requirements and minimise cost (the objective function); however, it ignores environmental impacts. Consequently, studies have investigated approaches to formulate low-impact feeds. For instance, Castrodeza et al. ( Reference Castrodeza, Lara and Pena 11 ) and Pomar et al. ( Reference Pomar, Dubeau and Letourneau-Montminy 12 ) focused on reducing N and P excretions by including them in the objective function, but they did not consider impacts of the feeds themselves. Nguyen et al. ( Reference Nguyen, Bouvarel and Ponchant 13 ) formulated low-impact poultry feeds under the constraints of the feeds’ climate change and eutrophication impacts, using cost as the objective function. They highlighted that considering only two impacts may lead to pollution swapping (e.g. increase of other impacts such as acidification). More recently, Tallentire et al. ( Reference Tallentire, MacKenzie and Kyriazakis 14 ) developed a tool to formulate broiler feeds which minimises one single impact (at the farm gate) with a maximum constraint of a given increase in feed cost compared with the cost of the LC formulation. In their case studies, they highlighted that it was not possible to minimise one impact without increasing at least one other impact.
Mackenzie et al. ( Reference MacKenzie, Leinonen and Ferguson 15 ) optimised environmental impacts of pig feeds by including four environmental impacts at the farm gate into the objective function. They optimised the feed formula and nutrient (N, P) levels to reduce animal excretion. This was the first method developed which addressed multiple environmental impacts when optimising feed formulas. However, they did not investigate trade-offs between economic and environmental objectives; consequently, their feed formulas cost 12–30 % more than LC formulas. Obviously, considering feed costs when formulating feed remains crucial for the livestock sector. Feed costs constitute 64–70 % of production costs in monogastric production( 16 , Reference van Horne and Bondt 17 ) and 20–50 % of those in beef production( 18 ).
Therefore, addressing both challenges requires a formulation method that includes feed cost and environmental impacts. Such multiobjective (MO) formulation should have the following characteristics: (i) include feed costs and environmental impacts in the objective function, (ii) use linear programming to accurately reflect current practices of feed manufacturers to encourage adoption by the livestock sector and (iii) use weighting factors to investigate trade-offs between the economy and the environment. The objectives of this study were to develop a MO formulation method for complete feeds based on environmental impacts of ING estimated using life cycle assessment (LCA), and to investigate its potential to mitigate environmental impacts of pig, broiler and young bull feeds in the French context.
Methods
The general principle of the present study was to reduce the environmental impacts of animal production that are related to the production of concentrate feeds. Therefore, reducing the on-farm emissions through variation of nutrient feed contents and excretion is not in the scope but is complementary to the developed methodology. One major consequence is that feeds formulated with economic and environmental objectives will have the same composition of main nutrients involved in feed efficiency and nutrient excretion.
Economic and environmental indicators were used for MO optimisation of feed formulas to avoid pollution swapping and to produce formulas consistent with current practices of feed manufacturers. The proposed MO formulation searches for the incorporation rates of ING that minimises cost and LCA environmental impacts under constraints of nutritional contents. Feeds were formulated using OpenSolver for Microsoft Excel® ( Reference Mason and Dunning 19 ), open-source software which optimises linear programming models using a ‘branch-and-bound’ approach to problems with a large number of variables and constraints.
Feed-ingredient characteristics
INGs’ environmental impacts came from the ECOALIM dataset of the AGRIBALYSE® database(
Reference Wilfart, Espagnol and Dauguet
20
) and included P demand (PD, in kg P/kg of ING), International Reference Life Cycle Data System (ILCD) climate change including land-use change (CC, in kg CO2-eq/kg) and ILCD acidification potential (AC, in mol H+-eq/kg)(
21
), Centre for Environmental Studies (CML) EU (in kg
 $${\rm PO}_{4}^{{3{\minus}}} $$
-eq/kg), non-renewable energy (NRE) demand (in MJ/kg), and LO (in m2year/kg). PD accounts for non-renewable P resource incorporated in fertilisers and feeds. All impacts from the ECOALIM dataset were considered to be those at the storage-organisation gate or plant gate (for co-products or processed ING) for application in feed manufacturing. Impacts of transporting ING from storage organisations to the feed factory (background data) came from attributional life cycle inventories in the ecoinvent version 3.1 database(
Reference Weidema, Bauer and Hischier
22
). Nutritional composition of ING came from French nutritional tables(
Reference Sauvant, Perez and Tran
23
), except for a few co-products whose data were provided by French R&D institutes on crop production (ARVALIS Institut du Végétal, Terres Inovia). ING impacts from the ECOALIM dataset are available on simple request at www.inra.fr/ecoalim, and in the following repository: Dryad (doi: 10.5061/dryad.14km1).
$${\rm PO}_{4}^{{3{\minus}}} $$
-eq/kg), non-renewable energy (NRE) demand (in MJ/kg), and LO (in m2year/kg). PD accounts for non-renewable P resource incorporated in fertilisers and feeds. All impacts from the ECOALIM dataset were considered to be those at the storage-organisation gate or plant gate (for co-products or processed ING) for application in feed manufacturing. Impacts of transporting ING from storage organisations to the feed factory (background data) came from attributional life cycle inventories in the ecoinvent version 3.1 database(
Reference Weidema, Bauer and Hischier
22
). Nutritional composition of ING came from French nutritional tables(
Reference Sauvant, Perez and Tran
23
), except for a few co-products whose data were provided by French R&D institutes on crop production (ARVALIS Institut du Végétal, Terres Inovia). ING impacts from the ECOALIM dataset are available on simple request at www.inra.fr/ecoalim, and in the following repository: Dryad (doi: 10.5061/dryad.14km1).
Multiobjective feed formulation problem
Like traditional LC formulation, the MO formulation method developed is based on linear programming and the traditional Simplex algorithm. Incorporation rates of each available ING are determined from a series of linear constraints, while minimising the objective function. The method has two steps: (i) produce a baseline formula using LC formulation (with baseline (ref) cost and environmental impacts) and (ii) search for a solution to the MO optimisation problem.
In step 1, i∈{1,…,n} is the index of the ith ING among n available ING, and x i ∈[0;1] is the proportion of the ith ING in the feed formula. The objective function is feed cost (Cost), calculated as the sum of ingredient costs multiplied by their respective incorporation rates:
 $${\rm min}\,{\rm Cost}^{{{\rm ref}}} {\equals}\mathop \sum\limits_{i{\equals}1}^n x_{i} c_{i} $$
The optimisation algorithm searches for incorporation rates that minimise the objective function under a series of constraints:
∙ When considering j∈{1,…,p} the index of the jth nutrient, a j,i the content of nutrient j in the ith ING, and $R_{j}^{{{\rm min}}} $
and
$R_{j}^{{{\rm max}}} $
the minimum and maximum contents of nutrient j in the diet, the formula must satisfy nutrient (NUT) constraints:
$R_{j}^{{{\rm min}}} $
and
$R_{j}^{{{\rm max}}} $
the minimum and maximum contents of nutrient j in the diet, the formula must satisfy nutrient (NUT) constraints:


 $$R_{j}^{{{\rm min}}} \leq {\rm NUT}_{j}^{{{\rm ref}}} {\equals}\mathop \sum\limits_{i{\equals}1}^n x_{i} a_{{j,i}} \leq R_{j}^{{{\rm max}}} $$
∙ Minimum
$X_{i}^{{{\rm min}}} $
and maximum
$X_{i}^{{{\rm max}}} $
incorporation rates of each ING are also specified:


 $$X_{i}^{{{\rm min}}} \leq x_{i} \leq X_{i}^{{{\rm max}}} $$
∙ Other classical constraints of the traditional least-cost formulation method have been added:
 $$\mathop \sum\limits_1^n x_{i} {\equals}1,\quad x_{i} \geq 0, \quad \forall i \in\left\{ 1 \right.,\!\ldots\!,\left. n \right\}$$
Using the formula produced in step 1, environmental impacts (LCA) k∈{PD, CC, AC, EU, NRE, LO} of the corresponding feed are calculated, after optimisation:
 $${\rm LCA}_{k}^{{{\rm ref}}} {\equals}\mathop \sum\limits_{i{\equals}1}^n x_{i} lca_{{k,i}} $$
where lca k,i is the environmental impact k of ING i.
Step 2 minimises the MO function, which includes a cost index and an environmental index composed of the four global-level impacts (PD, CC, NRE and LO( Reference Basset-Mens and van der Werf 4 , Reference Dourmad, Ryschawy and Trousson 24 )) to which feed production strongly contributes:
 $$\eqalignno{{\rm min }\,{\rm MO}&{\equals} \left( {1{\minus}\alpha } \right){\times}\left( {{{{\rm Cost}} \over {{\rm Cost}^{{{\rm ref}}} }}} \right)\cr&{\plus}\alpha {\times}\left( \matrix{ \beta _{{{\rm PD}}} {{{\rm LCA}_{{{\rm PD}}} } \over {{\rm LCA}_{{{\rm PD}}}^{{{\rm ref}}} }}{\plus}\beta _{{{\rm CC}}} {{{\rm LCA}_{{{\rm CC}}} } \over {{\rm LCA}_{{{\rm CC}}}^{{{\rm ref}}} }}{\plus}\beta _{{{\rm NRE}}} {{{\rm LCA}_{{{\rm NRE}}} } \over {{\rm LCA}_{{{\rm NRE}}}^{{{\rm ref}}} }} \hfill \cr {\plus}\beta _{{{\rm LO}}} {{{\rm LCA}_{{{\rm LO}}} } \over {{\rm LCA}_{{{\rm LO}}}^{{{\rm ref}}} }} \hfill \cr} \right)$$
where α and β are weighting factors.
The MO function is optimised under constraints on environmental impacts and crude protein content of the feed, as well as under constraints applied in step 1. These constraints (equations (7) and (8)) have been set to avoid possible increase in crude protein content of the feed (and consequently N excretion) and possible significant increase of some environmental impacts when shifting from LC formulation to MO formulation. The local impacts EU and AC as well as the impacts included in the objective function must not exceed their baseline values by more than 5 %:
 $$\mathop \sum\limits_{i{\equals}1}^n x_{i} lca_{{k,i}} \leq 1.05{\times}{\rm LCA}_{k}^{{{\rm ref}}} $$
∙ Crude protein content of the feed must not exceed its baseline value calculated in step 1:
 $$\mathop \sum\limits_{i{\equals}1}^n x_{i} a_{{j,i}} \leq {\rm NUT}_{j}^{{{\rm ref}}} $$
where j corresponds to the index of crude protein content.
All criteria included in the MO function are normalised by their baseline values calculated from the LC formulation.
The α factor is the weight, ranging from 0 to 1, of the environmental index, and 1−α is the complementary weight of the cost index. Thus, α=0 corresponds to the LC formulation, while α=1 excludes consideration of the cost index. The formula is optimised for α from 0 to 1 with a step of 0·01, which allows the trade-off between economic and environmental objectives to be investigated. The best formula, identified when the marginal decrease in the environmental index becomes lower than the marginal increase in the cost index, takes the α factor value of α lim. This point identifies a specific trade-off between the economic and environmental objectives of the feed formulation problem. Therefore, the feed formulas and environmental impacts are calculated at α=α lim. The sum of four β factors in the environmental index equals 1. Thus, β-PD, β-NRE and β-LO are set to 0·2 while β-CC is set to 0·4( Reference Gerber, Steinfield and Henderson 2 ).
This feed formulation problem is linear, as the MO function corresponds to a linear combination of multiple criteria. The x i for i∈{1,…,n} were identified using OpenSolver for Excel( Reference Mason and Dunning 19 ).
Nutritional constraints for feed formulation
Feeds were formulated for pigs (growing and finishing), broilers (starter, growing and finishing) and young bulls (complete feed used along with conserved forage such as maize silage, usually used for finishing). Constraints on nutrient contents were defined to meet the nutritional requirements of each animal category (Table 1).
Table 1 Nutritional constraints of feed formulation applied in steps 1 and 2
Min., minimum; Max., maximum; ME, metabolisable energy; NE, net energy; d, digestible; TSAA, total sulphur amino acid.
* PDIE: protein digested in the small intestine supplied by rumen undegraded dietary protein and microbial protein from rumen-fermented organic matter( 50 ).
† PDIN: protein digested in the small intestine supplied by rumen undegraded dietary protein and microbial protein from rumen degraded N( 50 ).
‡ Upper limits for crude protein do not applied in step 2 and are managed by equation (8).
For pigs, minimum contents of net energy and amino acids were set. Minimum contents of standardised ileal digestible amino acids were calculated according to regulations for pig feed protein content( Reference Dourmad, Levasseur and Daumer 25 ) and ideal amino acid profiles from van Milgen et al. ( Reference van Milgen, Valancogne and Dubois 26 ) and Ajinomoto Eurolysine( 27 ). Minimum and maximum contents of the other nutrients were set according to expert knowledge of some co-authors (D. G. and L. D.). For broilers, minimum and maximum contents of nutrients were set as mean values based on consultations with feed-supply chains. Conversely, maximum contents of digestible amino acids were set to avoid producing non-realistic feeds formulas when using the MO formulation. For young bulls, minimum and maximum contents of protein (expressed as crude protein, PDIE – protein digested in the small intestine supplied by rumen undegraded dietary protein and microbial protein from rumen-fermented organic matter, PDIN – protein digested in the small intestine supplied by rumen undegraded dietary protein and microbial protein from rumen degraded N) and net energy were set according to nutritional characteristics provided by commercial documents and expert knowledge of the co-authors and colleagues (S. L.-R. and B. Rouillé from Idele).
Formulation scenarios
To investigate the ability of the MO formulation method to formulate low-impact feeds (i.e. ‘eco-feeds’), we defined two scenarios of ING availability (i.e. the vector $X_{i}^{{{\rm max}}} $
) and four contexts to consider effects of feed-ingredient costs (i.e. c
i
).
$X_{i}^{{{\rm max}}} $
) and four contexts to consider effects of feed-ingredient costs (i.e. c
i
).
Based on expert knowledge, limited (LIM) and non-limited (NLIM) ingredient-availability scenarios (Table 2) were created to represent, respectively, current practices in France and increased availability or variety of ingredients (e.g. spring peas, faba beans, co- and by-products). Minimum and maximum ingredient-incorporation rates were set based on availability of each ingredient on the market and technological constraints of feed production.
Table 2 Principal constraints (applied in steps 1 and 2) on incorporation rates of ingredients when formulating feed in scenarios of limited (LIM) and non-limited (NLIM) ingredient availability (%)
Min., minimum; Max., maximum.
In addition, four economic contexts were defined to reflect contrasting market prices for ingredients (average values for September 2011, June 2012, August 2013 and February 2014, respectively (online Supplementary Table S1)). These months were selected because they had large differences in prices of soft wheat, maize grain and soya bean meal, which resulted in contrasting price ratios for soya bean meal:soft wheat and maize grain:soft wheat. Prices were obtained from the La Dépêche, a market newspaper for professionals of grain trade sector. Final results were expressed as means and standard deviations of results of the four economic contexts.
Finally, based on expert knowledge, distances from storage organisations or production plant to the feed factory were set to represent those common in Brittany, north-west France: 100 km for meals and 500 km for cereals and co-products. They represent mean distances to areas of cereal production, harbours (for imported meals), and mills and starch manufacturers (for co- and by-products).
Sensitivity analysis
In order to investigate the possible effects of the values of weighting factors on the outputs of the MO feed formulation problem, we performed sensitivity analysis (SA) of PD, CC, AC, EU, NRE, LO and feed cost to the weighting factors of the objective function.
For this purpose, we propose an objective function MOg which is a generalisation of equation (6). MOg allows variation of the weighting factors while ensuring that the sum of the weighting factors which apply on environmental impacts sum up to 1.
 $$\eqalignno{{\rm min MO}_{{\rm g}} {\equals} &\left( {1{\minus}\alpha } \right){\; \times}\left( {{{{\rm Cost}} \over {{\rm Cost}^{{{\rm ref}}} }}} \right){\plus}\alpha \;{\times}\left( {{1 \over {\delta _{{{\rm PD}}} {\plus}\delta _{{{\rm CC}}} {\plus}\delta _{{{\rm NRE}}} {\plus}\delta _{{{\rm LO}}} }}} \right){\times}\cr & \left( \matrix{ \delta _{{{\rm PD}}} {{{\rm LCA}_{{{\rm PD}}} } \over {{\rm LCA}_{{{\rm PD}}}^{{{\rm ref}}} }} \hfill \cr {\plus}\delta _{{{\rm CC}}} {{{\rm LCA}_{{{\rm CC}}} } \over {{\rm LCA}_{{{\rm CC}}}^{{{\rm ref}}} }}{\plus}\delta _{{{\rm NRE}}} {{{\rm LCA}_{{{\rm NRE}}} } \over {{\rm LCA}_{{{\rm NRE}}}^{{{\rm ref}}} }}{\plus}\delta _{{{\rm LO}}} {{{\rm LCA}_{{{\rm LO}}} } \over {{\rm LCA}_{{{\rm LO}}}^{{{\rm ref}}} }} \hfill \cr} \right)$$
where α, δ PD, δ CC, δ NRE and δ LO are weighting factors. The link between equations (6) and (9) is made by the transformation of variables that apply on weighting factors, e.g. for PD:
 $$\beta _{{{\rm PD}}} {\equals}{{{\delta _{{{\rm PD}}} } \over {( {\delta _{{{\rm PD}}} {\plus}\delta _{{{\rm CC}}} {\plus}\delta _{{{\rm NRE}}} {\plus}\delta _{{{\rm LO}}} } \right)}$$
For an illustrative purpose, the sensitivity of PD, CC, AC, EU, NRE, LO to α, δ PD, δ CC, δ NRE, δ LO was only calculated for pig feeds. Sensitivity indices were produced for each of the four economic contexts previously described.
The Sobol method for SA was chosen as the mostly recommended method to perform global SA, i.e. SA which calculates sensitivity indices for the whole range of variation of the parameters and accounting for the effects of interactions between parameters. First- and total-order Sobol indices are calculated for each output of interest( Reference Sobol 28 ). Further details of the methodology can be found in the Supplementary material and in Cadero et al. ( Reference Cadero, Aubry and Brun 29 ).
Results
Variations in cost and environmental indexes with multiobjective formulation
For MO formulation of all feeds in both scenarios (LIM and NLIM), the environmental index decreased and the cost index increased as α increased from 0 to 1 (Fig. 1).
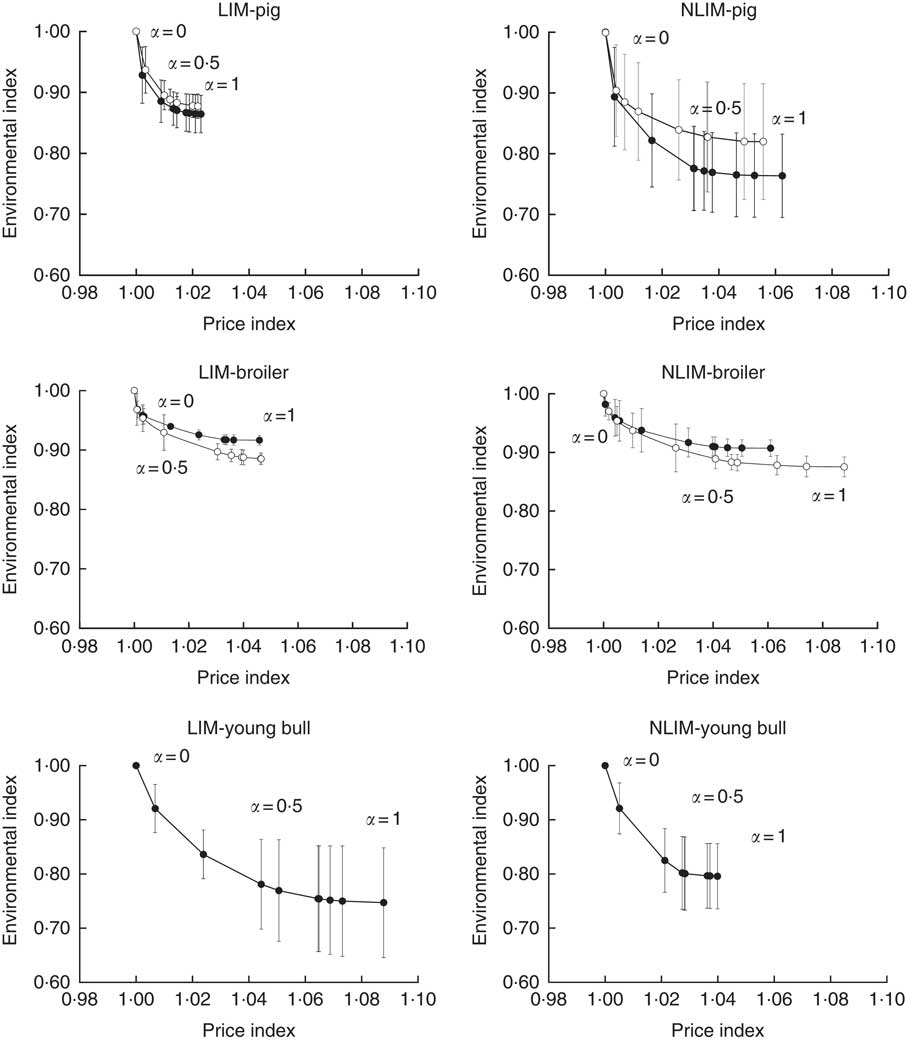
Fig. 1 Variations in mean environmental and cost indexes of the multiobjective feed formulation problem as α, the weight of the environmental index, increases from 0 to 1 when formulating pig, broiler and young bull feeds in scenarios of limited (LIM) and non-limited (NLIM) ingredient availability. •, Growing; ○, finishing. Error bars represent 1sd.
For pig feeds, and less so for broiler feeds, MO formulation decreased the environmental index more in NLIM than in LIM. Conversely, for young bull feeds, MO formulation decreased the environmental index less in NLIM than in LIM. For pig and broiler feeds, MO formulation increased the cost index more in NLIM than in LIM, but not for young bull feeds. For each species in each context, the mean value of α lim has been calculated (Table 3).
Table 3 Feed cost and environmental impacts (±1sd) of 1 ton of a weighted blend (averaged on four economic scenarios) for pig (40 % grower and 60 % finisher), broiler (6 % starter, 20 % grower and 74 % finisher) and young bulls formulated with multi-objective (MO) formulation (at α=α lim averaged on the four economic scenarios)Footnote * (Mean values and standard deviations)
PD, P demand; NRE, non-renewable energy; CC, climate change with land-use change potential; LO, land occupation; AC, acidification potential; EU, eutrophication potential; LIM, limited; LC, least-cost; NLIM, non-limited.
* Percentage differences (Δ) between MO and LC formulations in scenarios of LIM and NLIM feed-ingredient availability are provided.
For pig feeds, when α=α lim, the environmental index decreased by 12 % in LIM and 20 % in NLIM, while the cost index increased by 1 % in LIM and 4 % in NLIM. When α is increased up to 1, the environmental index further decreased by 1 % in LIM and remained stable in NLIM, while the cost index further increased by 1 % in LIM and 2 % NLIM.
For broiler feeds, when α=α lim, the environmental index decreased by 10 % in LIM and NLIM, while the cost index increased by 3 % in LIM and 4 % in NLIM. When α is increased up to 1, the environmental index further decreased by 1 % in LIM and NLIM, while the cost index further increased by 1·5 % in LIM and 2·3 % in NLIM.
For young bull feeds, when α=α lim, the environmental index decreased by 26 % in LIM and 21 % in NLIM while the cost index increased by 7 % in LIM and 3 % in NLIM. When α is increased up to 1, the environmental index remained stable in LIM and NLIM, while the cost index further increased by 2 % in LIM and 1 % in NLIM.
Feed formulas
Fig. 2 shows mean ingredient composition (%) of the feeds formulated at α=α lim in LIM and NLIM. For monogastric feeds, cereals were the main ingredient, while for young bull feed, either cereal co-products or oil meals were the main ingredient, depending on the scenario and type of formulation. For mean pig feeds, compared with those in LIM-LC (the current situation of price and environmental impacts of livestock feeds), those in NLIM-MO contained less cereals (−33% points) and oil meals (−12 points) but more wheat co-products (16 points) and oilseeds and protein crops (29 points). Environmental impacts of cereals and oil meals are usually higher than those of wheat co-products and protein crops such as spring peas( Reference Wilfart, Espagnol and Dauguet 20 ). Consequently, with MO formulation, the percentages of wheat co-products, oilseeds and protein crops in pig feeds increased from LIM to NLIM due to the increased availability of co-products (e.g. wheat middlings, wheat feed flour) and protein crops (e.g. spring peas).
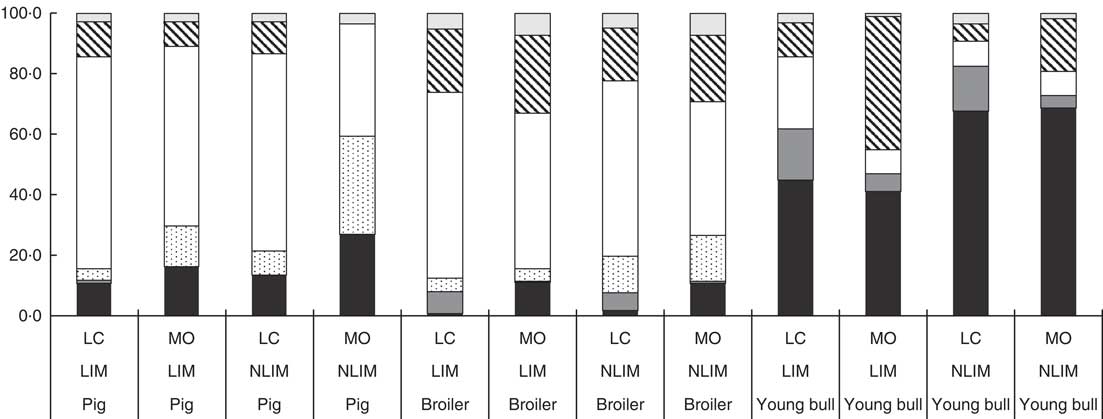
Fig. 2 Mean ingredient composition (%) of feed formulas obtained with least-cost (LC) and multi-objective (MO) formulation in contexts of limited (LIM) and non-limited (NLIM) ingredient availability. ![]() , Co-products of wheat;
, Co-products of wheat; ![]() , co-products of maize;
, co-products of maize; ![]() , oilseeds and protein crops;
, oilseeds and protein crops; ![]() , cereals;
, cereals; ![]() , oil meals;
, oil meals; ![]() , other.
, other.
MO formulation modified broiler feeds less than pig feeds. Compared to mean broiler feeds in LIM-LC, those in NLIM-MO contained less cereals (−17 points) and more wheat co-products, oilseeds and protein crops (10 points each). Indeed, formulation of broiler feeds has stronger nutritional constraints than that of pig feeds, due to higher crude protein and amino-acid requirements contents.
Formulas varied greatly for young bull feeds, which had higher mean percentages of wheat and maize co-products than monogastric feeds, in relation with lower net energy requirements. With MO formulation, compared to mean young bull feeds in LIM-LC, those in NLIM-MO contained more wheat co-products (24 points) and oil meals (6 points).
Costs and environmental impacts of formulated feeds
On average, broiler feeds cost more per ton than pig and young bull feeds and had higher environmental impacts in all categories than pig feeds (Table 3). Young bull feeds had the lowest PD, LO, AC and EU impacts and intermediate values of NRE and CC impacts.
For all feeds, mean PD, NRE and CC decreased by 14, 24 and 20 %, respectively, when using MO formulation instead of LC formulation. MO formulation also decreased AC and EU, which were not included in the MO function, for all feeds. MO formulation also decreased LO for pig (−15 %) and young bull (−8 %) feeds but increased it for broiler feeds (3 %). The mean cost of pig, broiler and young bull feed was 2·5, 3·5 and 5·0 % higher, respectively, with MO formulation than with LC formulation.
For pig feeds, cost and environmental impacts differed more between MO and LC formulation in NLIM than in LIM. For broiler feeds, MO formulation decreased most impacts similarly in NLIM and LIM, but more so for NRE and AC in LIM. Conversely, for young bull feeds, MO formulation decreased most impacts (NRE, CC, AC, EU) more in LIM than in NLIM. LO was the only impact that decreased more with MO formulation in NLIM than in LIM. The increase in feed cost due to MO formulation was greater in NLIM than in LIM for pig and broiler feeds, but not for young bull feeds.
Compared to impacts in the current context (LIM-LC), those with MO formulation and greater ingredient availability (NLIM-MO) decreased by 10 % (LO) to 29 % (CC and AC) for pig feeds, 7 % (EU) to 27 % (NRE) for broiler feeds, and 18 % (PD) to 39 % (NRE) for young bull feeds. Conversely, LO increased by 18 % for broiler feeds. For all feeds, shifting from LIM to NLIM compensated for most of the cost increase caused by MO formulation. As a result, switching from LIM-LC to NLIM-MO increased costs by only 1 % (broiler and young bull feeds) or 2 % (pig feeds).
Sensitivity analysis to the weighting factors
In growing pig feeds, most of the outputs are sensitive to all the weighting factors (Fig. 3). The experiment design of the SA resulted in moderate CV ranging from 1·0 to 2·4 % for cost, 4·9 to 7·1 % for PD, 6·6 to 12·0 % for NRE, 4·2 to 7·3 % for CC, 6·1 to 7·9 % for AC, 2·9 to 5·4 % for EU and 4·2 to 6·2 % for LO. Nevertheless, feed cost ranged from 211 to 262 €/ton and CC ranged from 427 to 569 kg CO2-eq/ton. Consistently, cost, PD, CC, NRE and LO are affected by their respective weighting factors. Depending on the economic context, AC is mostly affected by either α or δ NRE and EU is mostly affected by either α or δ LO. Sensitivity of outputs to weighting factors varies according to the economic context – e.g. sensitivity of outputs to α is higher in 2013 and 2014 contexts than in 2011 and 2012 ones. Total order indices are in all cases much higher than first order indices. This underlines a strong sensitivity of the outputs to interactions between weighting factors.
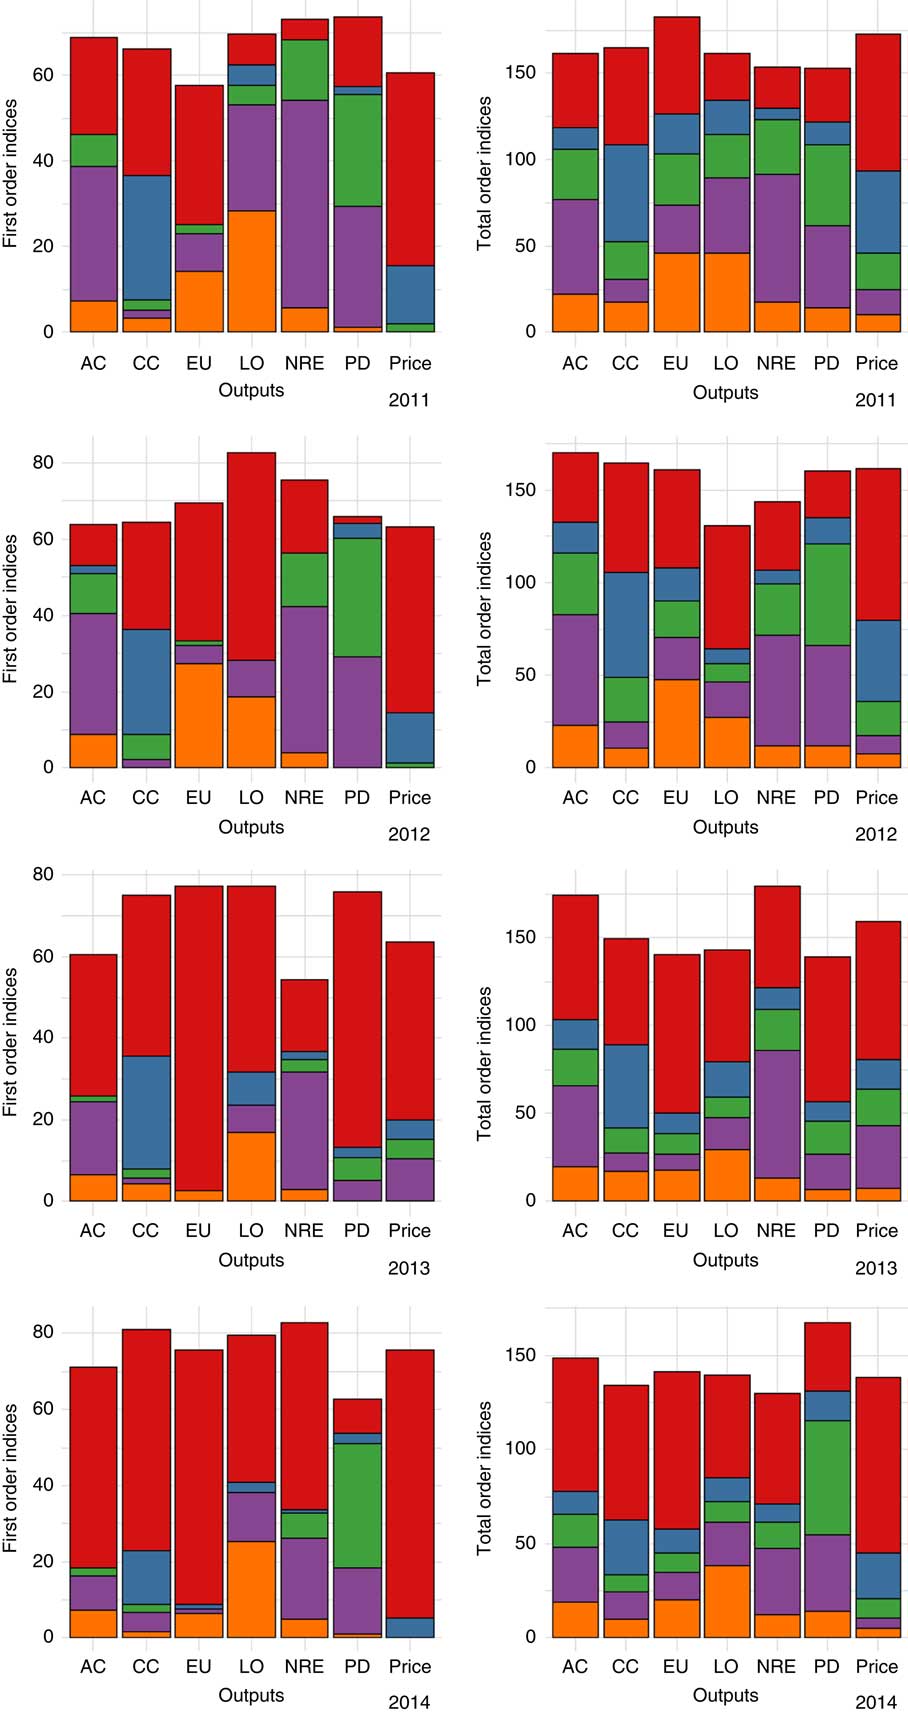
Fig. 3 Sobol first-order and total order indices of the five weighting factors on each output, in 2011, 2012, 2013 and 2014, in growing pig feeds: α: ![]() , δCC:
, δCC: ![]() , δPD:
, δPD: ![]() , δNRE:
, δNRE: ![]() , δLO:
, δLO: ![]() (with CC, climate change; PD, phosphorus demand; NRE, non-renewable energy; LO, land occupation). AC, acidification potential; EU, eutrophication potential.
(with CC, climate change; PD, phosphorus demand; NRE, non-renewable energy; LO, land occupation). AC, acidification potential; EU, eutrophication potential.
Discussion
Economic and environmental optimisation of feed formulas requires standardised data on cost and environmental impacts of ING, whose ranking according to these criteria determines their incorporation rates. For MO formulation in this study, we obtained environmental impact data from the ECOALIM database( Reference Wilfart, Espagnol and Dauguet 20 ), whose data were generated using a single method.
Impact-mitigation potential of multiobjective formulation
Environmental impacts of the LC feeds were consistent with those of previous studies. For instance, CC and NRE impacts of livestock feeds lay within the ranges of those of Wilfart et al. ( Reference Wilfart, Dusart and Méda 30 ). Mean CC and NRE impacts per kg of feed are usually higher for broiler feeds (0·76 kg CO2-eq and 7·04 MJ, respectively)( Reference Leinonen, Williams and Wiseman 6 , Reference Prudêncio da Silva, van der Werf and Soares 9 , Reference Nguyen, Bouvarel and Ponchant 13 ) than for pig feeds (0·54 kg CO2-eq and 5·01 MJ)( Reference Dourmad, Ryschawy and Trousson 8 , Reference MacKenzie, Leinonen and Ferguson 15 , Reference Kool, Blonk and Ponsioen 31 – Reference van Zanten, Bikker and Mollenhorst 35 ), as observed for LC feeds in this study. Because broilers have higher protein and amino-acid requirements than pigs, broiler feeds contain more soya bean meal and other protein-rich ingredients with higher environmental impacts than pig feeds. To our knowledge, the literature contains little information about environmental impacts of finishing feeds for young bulls. The CC impact obtained in LIM-LC (0·52 kg CO2-eq/kg feed) was similar to that of Mogensen et al. ( Reference Mogensen, Hermansen and Nguyen 36 ) (0·48 kg CO2-eq/kg feed). In our study, LO of young bull feeds was lower than those of monogastric feeds, as previously observed for complete feeds for dairy cows( Reference Mogensen, Hermansen and Nguyen 36 – Reference Henriksson, Cederberg and Swensson 38 ).
Compared to LC formulation, MO formulation decreased environmental impacts of all feeds considered, except LO for broiler feeds, which was always slightly higher (1–4 %). The methodology resulted in standard deviations related to the economic contexts that are much lower than the magnitude of the average values (Table 3). This indicates a rather satisfactory robustness of the methodology to reduce environmental impacts at low overcost whatever the economic context. For all feeds, MO formulation partially replaced LC ING with eco-ING. In pig feeds, oil meals and cereals were partly replaced with wheat co-products, spring peas and faba beans, which had lower impacts (Fig. 2). Larger quantities of ingredients were replaced in NLIM than in LIM due to the former’s higher maximum incorporation rates. Mackenzie et al. ( Reference MacKenzie, Leinonen and Ferguson 15 ) highlighted that pig feeds formulated according to environmental objectives contain less cereals and more cereal co-products than those formulated according to economic objectives. In broiler feeds, cereals (mainly maize) and soya bean meal were partially replaced with rapeseed meal and wheat co-products, in accordance with results obtained by Nguyen et al. ( Reference Nguyen, Bouvarel and Ponchant 13 ). In young bull feeds, urea, cereals and maize co-products were replaced with rapeseed meal and wheat bran was replaced with wheat middlings and wheat feed flour.
In all species and feeds, MO formulation resulted in a partial substitution of main products by co-products. In this manuscript, co-products are products resulting from a manufacturing process together with a main product of higher economic value. However, by-products are defined as products not used for human consumption and which result in smaller revenues than main and co-products.
Oishi et al. ( Reference Oishi, Kumagai and Hirooka 39 ) specifically investigated feed formulation with food by-products and highlighted their interest to reduce environmental impacts of feeds. Steinfeld et al. ( Reference Steinfeld, Gerber and Wassenaar 40 ) already underlined that food by-products could reduce agricultural land use for feed production. In our study, by-products indeed replaced partially main and some co-products. For example, wheat and wheat bran were partially replaced by wheat feed flour and wheat middlings, in pig feeds. Therefore, ING databases should include more by-products in the future and MO formulation appears suitable to handle the incorporation of by-products in order to further reduce environmental impacts.
Increasing the availability of ING (NLIM) decreased the cost and impacts of LC feeds, except for LO for monogastric feeds. The impact-mitigation potential of MO formulation was also greater in NLIM than in LIM. This demonstrates the utility of increasing production of protein crops, such as spring peas and faba beans, and the availability of wheat co-products. However, annual production of spring peas and faba beans in France has remained relatively low and constant since 2007 (600 and 240 kt, respectively)( 41 , 42 ). In addition, animal production in Europe often occurs in the same regions and is therefore supplied by the same stocks of ING. Implementing MO formulation in an entire region would result in competition among its animal supply chains( Reference Espagnol, Garcia-Launay and Dusart 43 ).
One issue raised in this study is the potential to mitigate impacts of an entire production system, such as the production of live animals at the farm gate, through MO formulation. This focus on the impacts related to feed production can be considered as a limit of the proposed methodology. However, adopting MO formulation for fattening pig feed could decrease farm-gate impacts of pig production by 7 % for NRE and CC, 9 % for LO, 2 % for AC and 5 % for EU (assuming the following contributions of fattening pig feed to total impacts: NRE: 52 %, CC: 49 %, LO: 72 %, AC: 20 % and EU 45 %). MO optimisation should be used to formulate feeds of all animal stages, along with additional strategies such as multi-phase or precision feeding, to decrease impacts substantially.
In young bull production, the concentrate feeds account for the major part of the diet but feed production is not the major contributor to the impacts. Impacts of beef production in France and in Europe are mostly related to the grassland-based cow-calf system with finishing heifers( Reference Nguyen, van der Werf and Eugene 44 ). When dealing with the national emission inventories (instead of performing LCA) as required by the United Nations, reducing the emissions associated with the production of the large quantities of concentrate feeds for young bull and more generally ruminant production does make sense (5·5 Mt of concentrates per year for bovines produced in France, Agreste( 45 )).
Therefore, reducing substantially the environmental impacts of the livestock sector requires a combination of strategies all along the life cycle among which MO formulation contributes differently according to the animal species considered.
Methodological improvements and issues in multiobjective diet formulation
One major methodological issue in our study was to formulate feed while simultaneously considering several (here, four) environmental objectives and feed cost to avoid pollution swapping and unrealistic feed costs, respectively. One SA was performed for pig growing feeds to address this issue. It only focuses on sensitivity to the weighting factors in various economic contexts and does not include sensitivity to other inputs (e.g. impacts of ING). The outputs were sensitive to almost all weighting factors included in MO function, and to interactions between them. Therefore, a higher value for a given weighting factor does not guarantee a strong reduction of the related impact and may result in an increase of some other impacts. Consequently, giving all impacts (except CC) the same weighting factor is one way to limit pollution transfer, and it provides a pragmatic answer to the current debate on weighting environmental impacts in decision making. Other approaches include basing weighting factors on monetary valuation, public opinion or the state of the receiving environment( Reference Soares, Toffoletto and Deschenes 46 ). Although relevant for comparing the LCA of various scenarios, using these approaches for optimisation may increase greatly impacts that are associated with lowest weighting factors. The weighting factors we chose decreased all impacts considered (except LO for broiler feeds), even those excluded from the objective function. We also LIM the use of maximum constraints on environmental impacts to obtain a robust method which could always solve the feed formulation problem. This method avoided having to increase environmental constraints in iterative steps to identify mitigation potentials, an approach used in a previous study( Reference Nguyen, Bouvarel and Ponchant 13 ). In our method, the maximal constraints on environmental impacts were set at 5 % relatively to LC formulation, only to limit any potential pollution transfer (e.g. LO in broiler feeds).
Feed cost increased by <7 % for young bull feeds and 4 % for monogastric feeds. Keeping feed cost in the objective function ensured formulation of feeds whose additional cost may be acceptable to supply chains. Pomar et al. ( Reference Pomar, Dubeau and Letourneau-Montminy 12 ) considered cost and one environmental objective (reduction in P excretion) in feed formulation, which decreased excess and unavailable P in the diet by approximately 20 % but increased cost by only 5 %. In a more recent study, MacKenzie et al. ( Reference MacKenzie, Leinonen and Ferguson 15 ) investigated a composite MO function that included non-renewable resource use, AC, EU and CC, but no economic objective. Consequently, some of their feed formulas cost 30 % more, their maximum constraint on cost. The purpose of the present methodology was to provide optimal cost and environmental solutions that can be around or far from the least-cost (reference) solution, depending on the value of the weighting factor α. The methodology can produce all the optimal solutions (highlighted in Fig. 2) for application by feed manufacturers. Addressing both objectives by producing all optimal solutions, seems useful for end-users and supply chains and may support decision-making.
Our method, however, provides no way to reduce on-farm emissions from feed digestion and manure management. Therefore, it should be used along with feeding strategies that reduce animal N and P excretions. We introduced maximum constraints on crude protein and P contents in feeds to ensure that MO formulation would not increase N and P excretions.
Future challenges to upscaling multiobjective optimisation
Many strategies to mitigate impacts of animal production have been identified. They include feeding strategies, such as multi-phase and precision feeding, which reduce nutrient excretions and the subsequent emissions, and manure-management strategies, such as the use of covered slurry ponds. Reducing the fattening duration of a given group or batch of animals (and consequently carcass weights) when the revenue per kg of carcass is relatively low and the prices of ING are high might improve economic( Reference Rivest 47 ) and environmental results. At the end of the fattening period, animals gain more weight as fat, which increases growth requirements. As a result, the cost of producing the last few kg of weight gain increases dramatically. Consequently, combining strategies to maximise impact mitigation requires integrated MO optimisation of the entire production system and the product life cycle. MacKenzie et al. ( Reference MacKenzie, Leinonen and Ferguson 15 ) and Oishi et al. ( Reference Oishi, Kumagai and Hirooka 39 ) were the first to propose one MO optimisation at the whole-farm level. MacKenzie et al. ( Reference MacKenzie, Leinonen and Ferguson 15 ) considered nutrient excretions and environmental impacts at the farm gate using a specific feeding programme (four feeding phases), which is an interesting approach, but one which cannot combine improvements in feed formulation with those in feeding programme. Oishi et al. ( Reference Oishi, Kumagai and Hirooka 39 ) developed a formulation model which calculated animal N and P excretions in beef systems but did not include the entire production life cycle. Such models investigate specific situations, but are LIM in the number of mechanisms they can investigate. For instance, different levels of feed rationing, precision feeding and slaughter weight have not been investigated. Using more mechanistic models to represent entire production units (from the animal to the entire system) would help identify more ways to optimise the system. Morel & Hill( Reference Morel and Hill 48 ) developed a modelling approach that combined feed formulation and a stochastic model of pig growth with optimisation of the feeding strategy (based on an objective function that included feeding cost and animal excretion of volatile solids and N). Further studies are required to develop operational decision-support tools which optimise feeding strategies to reduce impacts of feeds and animal excretion. Other criteria, such as the target slaughter weight( Reference Ferguson 49 ), can also be included in such tools. This requires collaboration among animal scientists, mathematicians and computer scientists to develop reliable methods.
Conclusion
MO formulation of feeds seems a promising approach to reduce environmental impacts related to livestock production. We developed a method to perform MO formulation which includes multiple environmental impacts and feed costs, and allows a wide range of potential weighting factors between economic and environmental indexes to be investigated. Results indicate that it is possible to simultaneously reduce all environmental impacts considered (except LO for broiler feeds) in the contexts investigated. This potential appears moderate, however, especially considering possible competition for low-impact ING among animal supply chains. Therefore, there is great interest in developing more sophisticated approaches which consider profitability of the animal-production system and environmental impacts at the farm gate.
Acknowledgements
The authors are very grateful to Yves Dronne, consultant for Feedsim Avenir and Cyrille Nzally (INRA PEGASE) for their contribution to development of the MO function, Jean-Paul Métayer (Arvalis-Institut du végétal), Isabelle Bouvarel (ITAVI), Benoît Rouillé (IDELE) and the feed manufacturers who contributed to development of the scenarios. The authors are also thankful to Réseau Mixte Technologique Elevage et Environnement for technical support.
The results presented in this study were obtained in the ECOALIM project, funded by the French Ministry of Agriculture (CASDAR partenariat et innovation-2012) and the French Environment and Energy Management Agency (ADEME REACCTIF-2012, 1260C0061).
All authors participated in designing the formulation tool and the scenarios to be tested. F. G-L., L. D. and S. L-R. constructed the diet formulation tool, formulated the diets and conducted the LCA model simulations. All the authors contributed to the interpretation of the outcomes. F. G-L. and A. W. wrote the paper and all the other co-authors reviewed it.
The authors declare that there are no conflicts of interest.
Supplementary materials
To view supplementary material for this article, please visit https://doi.org/10.1017/S0007114518002672


