


Introduction
The predominance of herbicide-resistant weeds continues to threaten U.S. corn (Zea mays L.), cotton (Gossypium hirsutum L.), and soybean production by reducing the number of effective chemical weed control options (Norsworthy et al. Reference Norsworthy, Ward, Shaw, Llewellyn, Nichols, Webster, Bradley, Frisvold, Powles and Burgos2012). Herbicides have been the main method of weed control in these crops for decades, and as a result, the discovery of herbicide-resistant weeds dates back to the 1950s (Heap Reference Heap2022). There are currently 509 unique cases of herbicide resistance across the globe, consisting of 266 weed species (Heap Reference Heap2022). Historically, farmers have relied on new herbicide chemistries to address herbicide resistance (Heap and Duke Reference Heap and Duke2018). Since the early 1980s, only one new herbicide mode of action has been discovered (Duke and Dayan Reference Duke and Dayan2021). The compounding problems of herbicide resistance in weeds along with a lack of new effective herbicide modes of action has resulted in a greater need for a more diversified approach to weed management, including nonconventional methods of weed control (Bajwa et al. Reference Bajwa, Mahajan and Chauhan2015; Norsworthy et al. Reference Norsworthy, Ward, Shaw, Llewellyn, Nichols, Webster, Bradley, Frisvold, Powles and Burgos2012). In one review of the subject, Bajwa et al. (Reference Bajwa, Mahajan and Chauhan2015) described several nonconventional methods of weed control including weed electrocution, weed seed destruction, bioherbicides, and precision-based tools. The authors of that study speculated that electrocution may have practical implications in weed management. However, little research has been conducted on weed electrocution.
The idea of weed electrocution emerged in the 1970s using a machine manufactured by Lasco Lightning Weeder (Ottertail, MN) for the control of weeds in a variety of settings (Diprose et al. Reference Diprose, Benson and Hackam1980). The majority of previously published research on weed electrocution was conducted to control annual weed beets within sugar beet crops and to control the bolting of the crop. Diprose et al. (Reference Diprose, Benson and Hackam1980) conducted laboratory and field research to determine the effectiveness of electrocution on annual weed beets infesting the sugar beet crop and found that effective control of sugar beet bolts required in excess of 5 kilovolts (kV) in order to avoid excessively long treatment times (Diprose et al. Reference Diprose, Benson and Hackam1980). One field study that contained a mobile generating unit found that the treatments of 4, 6, and 8 kV were effective regardless of contact time, whereas 3 kV was effective only at contact times greater than 5 s (Diprose et al. Reference Diprose, Benson and Hackam1980). The successes of the mobile generating unit progressed into a tractor-driven electrocution system that stopped to apply voltages between 4 and 8.4 kV for a range of time from 4.3 s to 21.8 s. Results from this experiment followed a similar trend as the laboratory study, which showed that the higher the treatment voltage, the less time was required to injure plants (Diprose et al. Reference Diprose, Benson and Hackam1980). A second experiment with a tractor-driven system was conducted with a constant voltage output of 8.4 kV and a tractor speed of 1.6 km/h. Seventy-five percent of the treated weed beets in this trial were successfully controlled (Diprose et al. Reference Diprose, Benson and Hackam1980). This research supports the potential of electrocution to be a successful method of eliminating weed escapes in other crops where a height differential exists between the weed and crop canopy, such as soybean.
Diprose and Benson (Reference Diprose and Benson1984) described the energy costs required for two types of electrical weeding: continuous contact and spark discharge. Continuous contact requires a range of voltages from 6 to 25 kV, whereas spark discharge uses higher voltages between 25 and 60 kV (Diprose and Benson Reference Diprose and Benson1984). The associated energy costs were estimated at 19 MJ ha−1 and 14.5 MJ ha−1 for continuous contact and spark discharge, respectively. Coleman et al. (Reference Coleman, Stead, Rigter, Xu, Johnson, Brooker, Sukkarieh and Walsh2019) also demonstrated that the energy cost associated with site-specific treatment is directly proportional to the number of weeds present. Therefore, an area with high weed densities can be costly. Because of the high amount of energy required by weed electrocution, it can also lead to high financial costs and dangers to operators or nearby personnel (Korres et al. Reference Korres, Burgos, Travlos, Vurro, Gitsopoulos, Varanasi, Duke, Kudsk, Brabham, Rouse and Salas-Perez2019; Wei et al. Reference Wei, Liping, Zhijun, Guangwei and Ruirui2010). Thus far, these factors have likely contributed to the relatively low adoption rate of weed electrocution in most conventional agriculture systems (Korres et al. Reference Korres, Burgos, Travlos, Vurro, Gitsopoulos, Varanasi, Duke, Kudsk, Brabham, Rouse and Salas-Perez2019).
As the number of herbicide-resistant weed populations throughout U.S. agriculture continues to increase, the need for alternative methods of weed control becomes more dire. Few studies have been conducted on weed electrocution to determine its effectiveness and practicality in a major agricultural crop like soybean. Although weed electrocution may never completely replace chemical control options, it could be used in an integrated approach to help combat herbicide-resistant weeds (Harker and O’Donovan Reference Harker and O’Donovan2013). The limited amount of information available on weed electrocution has shown that the amount of voltage, contact time with voltage, plant species, plant morphology, plant age, amount of wood fibers within the plants, and number of electrocution passes are all factors that have been found to influence control (Diprose et al. Reference Diprose, Benson and Hackam1980, Reference Diprose, Fletcher, Longden and Champion1985; Rask and Kristofferson, Reference Rask and Kristofferson2007).
The objectives of this research were to 1) determine the efficacy of weed electrocution on problematic weed species at different growth stages, different tractor speeds, and with either a single or sequential electrocution pass; 2) investigate the viability of weed seeds following electrocution; and 3) determine the effects of electrocution on soybean injury and yield at different soybean growth stages.
Materials and Methods
Equipment and Site Description
All electrocution treatments were conducted with the Weed ZapperTM 6R30 unit (Old School Manufacturing LLC, Sedalia, MO). This implement consisted of a power takeoff (PTO)-driven 110,000-W generator attached to a 125-horsepower tractor, with a 3-m copper boom in the front that was capable of being raised or lowered depending on weed size. The generator produces from 225 to 275 amps, and it is advertised that approximately 7 to 20 amps and 15,000 volts actually reach the plants contacted (B. Kroeger, personal communication; Anonymous 2021). With the PTO engaged and the unit turned on, the copper boom will send an electric current through any plant that comes into contact with it. All experiments were conducted in 2020 and 2021 at the Bradford Research Center near Columbia, Missouri. The soil type of the locations where all the field trials were located is a Mexico silt loam with 2.2% to 2.5% organic matter and a pH ranging from 6.7 to 7.4.
Individual Weed Experiments
To determine the efficacy of electrocution on individual weed species, separate locations were chosen that had previously contained dense, natural infestations of waterhemp, common cocklebur, giant ragweed, common ragweed, horseweed, giant foxtail, yellow foxtail, and barnyardgrass. Experiments were conducted in the absence of a crop. Approximately 1 wk prior to electrocution, all broadleaf species were treated with clethodim to eliminate grass species and achieve a pure stand of the desired broadleaf weeds (Table 1). All grass species were treated with dicamba to eliminate broadleaf species and achieve a pure stand of the desired grass. Herbicide treatments were applied with a 3-m-wide boom using a CO2-pressurized backpack sprayer calibrated to deliver 140 L ha−1 at 138 kPa. Clethodim applications were applied with XR 8002 nozzles (TeeJet®, Spraying Systems Co., Wheaton, IL), while dicamba applications were made with TTI 11002 nozzles.
Table 1. Sources and rates of herbicides and adjuvants used in the experiments.
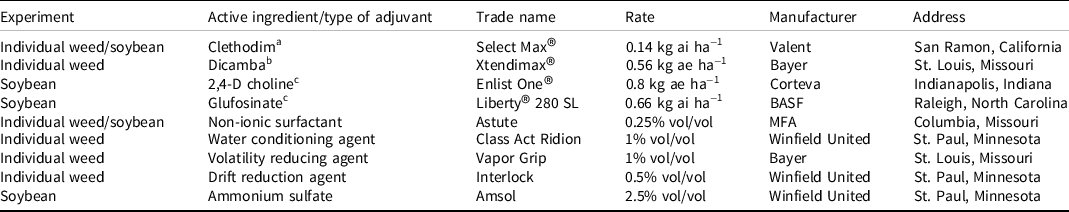
a Applied with non-ionic surfactant.
b Applied with water conditioning agent, volatility reducing agent, and drift reduction agent.
c Applied with ammonium sulfate.
Each weed species was treated with electrocution once plants reached average heights and/or growth stages of 30 cm, 60 cm, flowering, pollination, and seed set (Table 2). The electrocution boom was maintained at a height of approximately 30 cm above the soil surface. Treatments consisted of two different tractor speeds, 3.2 or 6.4 km h−1, and were applied either singly or in a sequential two-pass system spaced approximately 1 wk following the first pass. A nontreated control was included for comparison. Treatments were arranged in a randomized complete block design with four replications. Individual plots were 3 m by 15 m.
Table 2. Dates of electrocution and average densities of weed species at the time of electrocution in 2020 and 2021.
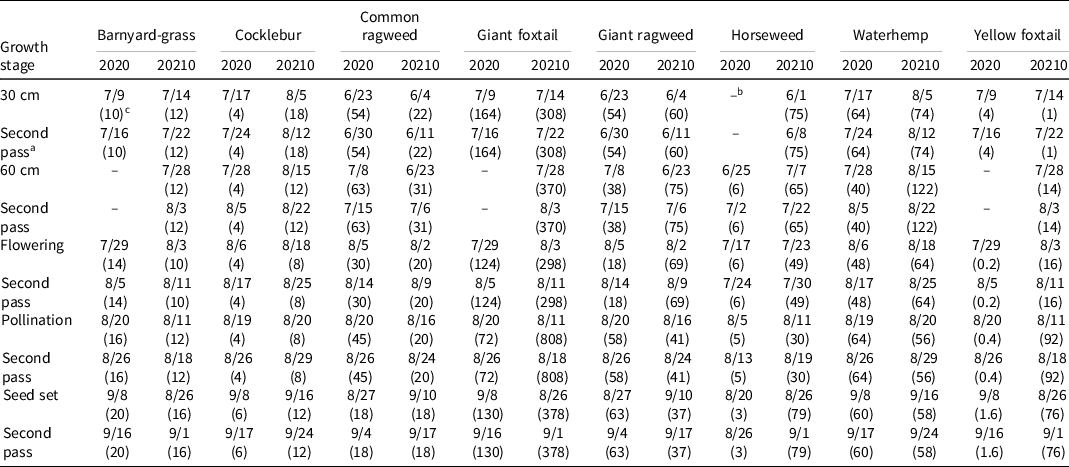
a Indicates the second pass of electrocution that occurred to plots within the same growth stage as the previous row.
b Dashes indicate electrocution timings that did not occur due to unfavorable soil conditions or because the 60-cm and flowering growth stages occurred at the same time.
c Values within parentheses are the average density of the weed species per square meter at the time of treatment.
Prior to each application, 10 plants of each of the target weed species were collected by cutting plants at the soil surface, weighing each plant immediately, and then drying plants in a forced-air oven at 37 C. Dry weights were recorded every 48 h until the weights stopped decreasing between measurements. Moisture content was then determined using the equation ([fresh weight – dry weight]/fresh weight * 100). Soil moisture was also determined prior to each electrocution treatment by taking two soil moisture measurements in each plot using a FieldScout TDR 350 soil moisture probe (Spectrum Technologies, Inc., Aurora, IL). Lastly, average plant density per square meter and height of plants were determined at the time of each electrocution application in at least one plot per replication. Following application, visual control ratings were taken at 3 and 42 d after treatment (DAT) on a scale of 0% to 100%, where 0 was equivalent to no injury and 100 was equivalent to complete control of the plant. Following the last application, recovered plants were determined by counting plants within a 1-m2 quadrat in each plot that had green tissue and a clear ability to regrow and/or produce seed following electrocution.
Seed Viability Testing
Following the last electrocution timing, seedheads that were present at electrocution were collected within a 1-m2 quadrat in each plot, placed in paper bags, and stored until further analysis. Seed were gleaned from seedheads and then the resulting samples of seed were weighed. The number of seed in a 0.05-g subsample of seed from each sample of yellow foxtail, barnyardgrass, common ragweed, and waterhemp were counted to extrapolate the total number of seeds in each sample in method similar to that described by Schwartz-Lazaro et al. (Reference Schwartz-Lazaro, Norsworthy, Young, Bradley, Kruger, Davis, Steckel and Walsh2016). A 1-g subsample of seed from the giant ragweed samples and 2-g2 sample of seed from the cocklebur samples were counted and extrapolated in the same manner. Horseweed seeds were not tested due to size and the inability to slice embryos. Seeds were then stored in labeled paper bags until viability screening. Subsamples of seeds from each weed species were then tested for viability following procedures from the Tetrazolium Testing Handbook (Miller Reference Miller2010; Peters Reference Peters2000). Twenty-five seeds (25 burs for cocklebur) from each sample were preconditioned on water-saturated filter paper (Whatman No. 2, Fisher Scientific, Hanover Park, IL) in a 10-cm Petri dish and soaked overnight to allow seedcoats to soften. Petri dishes were prepared with filter paper saturated with a 0.5% or 1% solution of tetrazolium (2,3,5-triphenyl tetrazolium chloride; MP Biomedicals, LLC, Solon, OH), depending on the species (Miller Reference Miller2010; Peters Reference Peters2000). Seeds were then cut in half to expose the embryos and placed embryo-down onto the filter paper. Petri dishes were wrapped with foil and stored in darkness to prevent degradation of the tetrazolium solution (Miller Reference Miller2010). Once seeds had incubated on the solution for the prescribed time, they were evaluated under a dissecting microscope. Seeds with a red-stained embryo were considered viable, whereas seeds that did not have a red-stained embryo or did not have an embryo inside the seedcoat were considered nonviable.
Statistical Analysis
Visual rating, seed viability, and recovered plant data were analyzed using the GLIMMIX procedure in SAS software (SAS version 9.4, SAS Institute Inc., Cary, NC). Means were separated using Fisher’s protected LSD test at P ≤ 0.05. Fixed effects were growth stage, speed of the implement, and number of passes with the implement, whereas year and plot were random effects. Years were chosen as random effects in the model so that conclusions could be made across a range of environments (Blouin et al. Reference Blouin, Webster and Bond2011; Carmer et al. Reference Carmer, Nyquist and Walker1989). Pearson’s correlation coefficients were generated in SAS software using the CORR procedure to assess potential relationships between soil moisture, plant moisture, plant density, and plant height with visual weed control.
Soybean Experiment
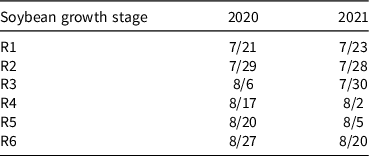
Glufosinate and 2,4-D-resistant soybean (‘MorSoy 3859E’and ‘Pioneer 38T05E’ in 2020 and 2021, respectively) were planted in rows spaced 76 cm apart at an approximate density of 350,000 seeds ha−1 on June 2 and June 4 in 2020 and 2021, respectively. The trial area was prepared by discing followed by a single pass with a field cultivator. In both years the trial was placed in an area that had previously contained dense infestations of waterhemp. Electrocution treatments took place at a constant speed of 4.8 km h−1 with single passes at the R1, R2, R3, R4, R5, and R6 stages of soybean growth and sequential passes at the R1 followed by R3 and R1 followed by R5 growth stages. Table 3 presents the dates that each electrocution treatment took place. The electrocution boom maintained contact with the top 2 to 8 cm of soybean foliage approximately 75% of the time in order to evaluate soybean injury and yield loss that could occur if soybean were electrocuted. Half of the plots were maintained weed-free by applying 2,4-D choline plus glufosinate approximately 4 wk after planting (Table 1) to determine the effects of electrocution on soybean injury and yield without the interference of weeds. The remaining half of the plots were designed to simulate a weed escape scenario in soybean, and received a treatment of clethodim to control grass species and create a purer stand of waterhemp. All herbicide treatments were applied using a CO2-pressurized backpack sprayer calibrated to deliver 140 L ha−1 at 138 kPa. The 2,4-D choline and glufosinate treatment was applied with AIXR 11002 nozzles, while the clethodim treatment was applied with XR 8002 nozzles. Non-electrocuted, weed-free, and weed escape controls were included for comparison. All treatments were arranged in a randomized complete block design with six replications and individual plots were 3 m by 18 m. Each plot contained four soybean rows.
Table 3. Dates of electrocution treatments and the associated soybean growth stages in 2020 and 2021.
Plant and soil moisture measurements were conducted in the same manner as described previously. Average soybean and waterhemp density and heights were recorded at each application. Following application, visual waterhemp control ratings were taken at 7 and 42 DAT on a scale of 0% to 100%, where 0% was equivalent to no injury and 100% was equivalent to complete control of the plant. Visual estimates of soybean injury were also assessed at the same timings as the waterhemp control ratings, using a scale of 0% to 100%, where 0% represented no injury and 100% represented complete plant death. Soybean yield was collected by harvesting the two innermost soybean rows within each plot using a small-plot combine (8XP Kincaid®, Massey Ferguson, Haven, KS) equipped with a Harvest Master H2 Single Grain Gauge® (Juniper Systems, Logan, UT), and moisture was adjusted to 13%.
Visual waterhemp control, visual soybean injury, and soybean yield data were analyzed using the GLIMMIX procedure in SAS software. Means were separated using Fisher’s protected LSD at P ≤ 0.05. Fixed effects were soybean growth stage and initial weed presence, while year and plot were random effects. Years were chosen as random effects in the model so that conclusions could be made across a range of environments (Blouin et al. Reference Blouin, Webster and Bond2011; Carmer et al. Reference Carmer, Nyquist and Walker1989). The relationship between visual waterhemp control and height differences between waterhemp and the soybean canopy at application was analyzed in SAS software using the Pearson PROC CORR procedure.
Results and Discussion
Individual Weed Experiments
Growth stage at the time of electrocution affected control of all weed species at both the 3 and 42 DAT ratings (P < 0.001; Table 4). Additionally, the number of passes was a significant factor in the level of control observed for at least one rating timing for all species besides yellow foxtail (Table 4). The average control of weeds other than yellow foxtail was from 4% to 15% higher with two passes compared with one (Table 5). These results are consistent with those reported by Diprose et al. (Reference Diprose, Fletcher, Longden and Champion1985) who noted that higher weed control within beet crops following two passes with electrocution compared with one. Speed was significant only for the 3 DAT rating for giant foxtail (P < 0.05; Table 4) and for 3 and 42 DAT ratings for giant ragweed (P < 0.001; Table 4). There were interactions between growth stage and number of passes for barnyardgrass, cocklebur, giant foxtail, giant ragweed, and horseweed. A growth stage by speed interaction occurred only for giant ragweed.
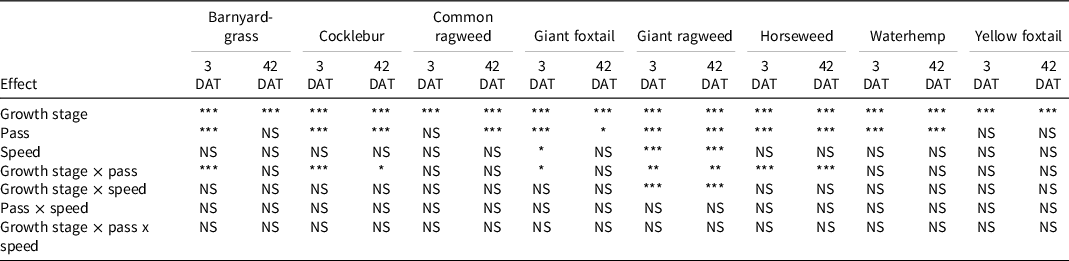
a Asterisks (*, **, and ***) indicate significant differences at α = 0.05, 0.01, and 0.001, respectively. NS indicates no significant differences at α = 0.05.
b Abbreviation: DAT, days after treatment.
Table 5. Visual control of various weed species at 3 and 42 d after treatment following one or two passes of electrocution. a,c
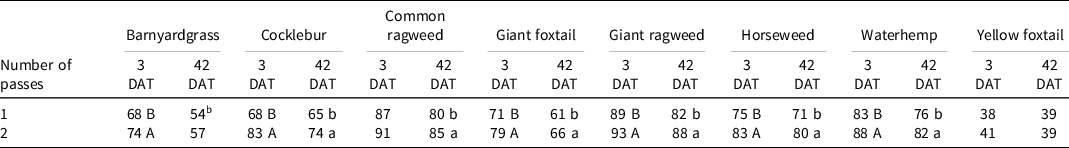
a Means followed by the same letter within a column are not different, α = 0.05.
b Means within the same column that are not followed by a letter are not significant, α = 0.05.
c Abbreviation: DAT, days after treatment.
The visual injury symptoms observed following electrocution included severe necrosis and an immediate wilting phenotype. Cross sections of the apical and basal portions of electrocuted stems revealed that browning or necrosis of cells was observed as soon as 3 h after treatment (HAT) and typically became more prominent by 24 HAT (Figure 1). In general, vascular tissues seemed to stay intact with no cell lysis evident. Necrosis observed in the apical and basal portions of the stems provides support that the electrical signal is likely moving through the vascular tissues, but more research should be conducted to confirm this possibility.
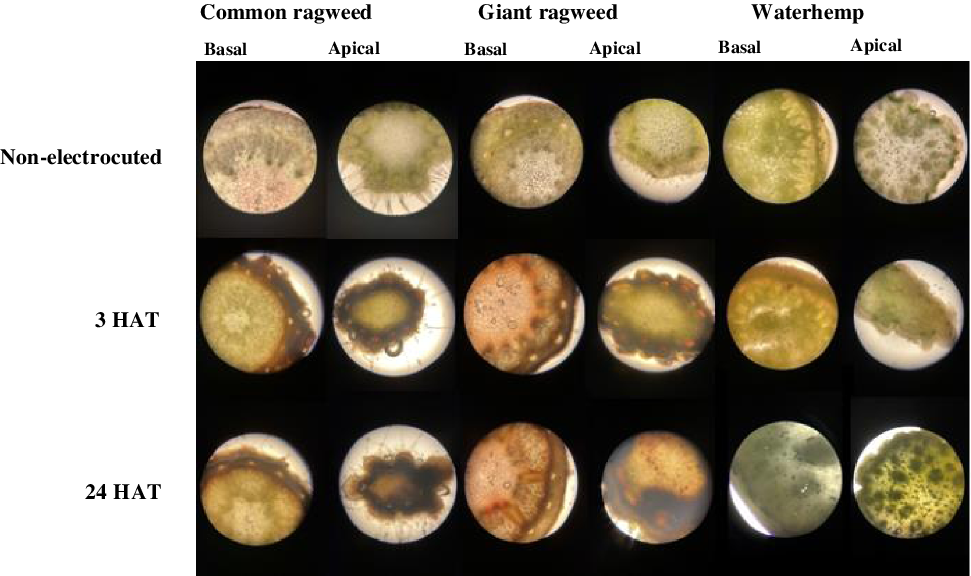
Figure 1. Common ragweed, giant ragweed, and waterhemp apical and basal stem cross sections from nonelectrocuted plants, plants from 3 h after treatment (HAT), and plants from 24 HAT.
In most cases, there seemed to be a slight decline in control observed by 42 DAT due to some recovery from electrocuted plants or as a result of newly emerging plants. Overall, there was a trend toward greater weed control when electrocution occurred in the later growth stages (Figure 2), which is most likely due to a greater number of weeds being contacted by the electrocution boom when weeds were taller. Several weed species were controlled similarly when electrocution occurred in later growth stages. However, when the level of control was averaged across all growth stages, the order of control from greatest to least was giant ragweed > common ragweed > waterhemp > horseweed > cocklebur > giant foxtail > barnyardgrass > yellow foxtail. Grass species typically had slightly lower visual control compared to broadleaf species, which is likely due to differences in physiology of the plants.
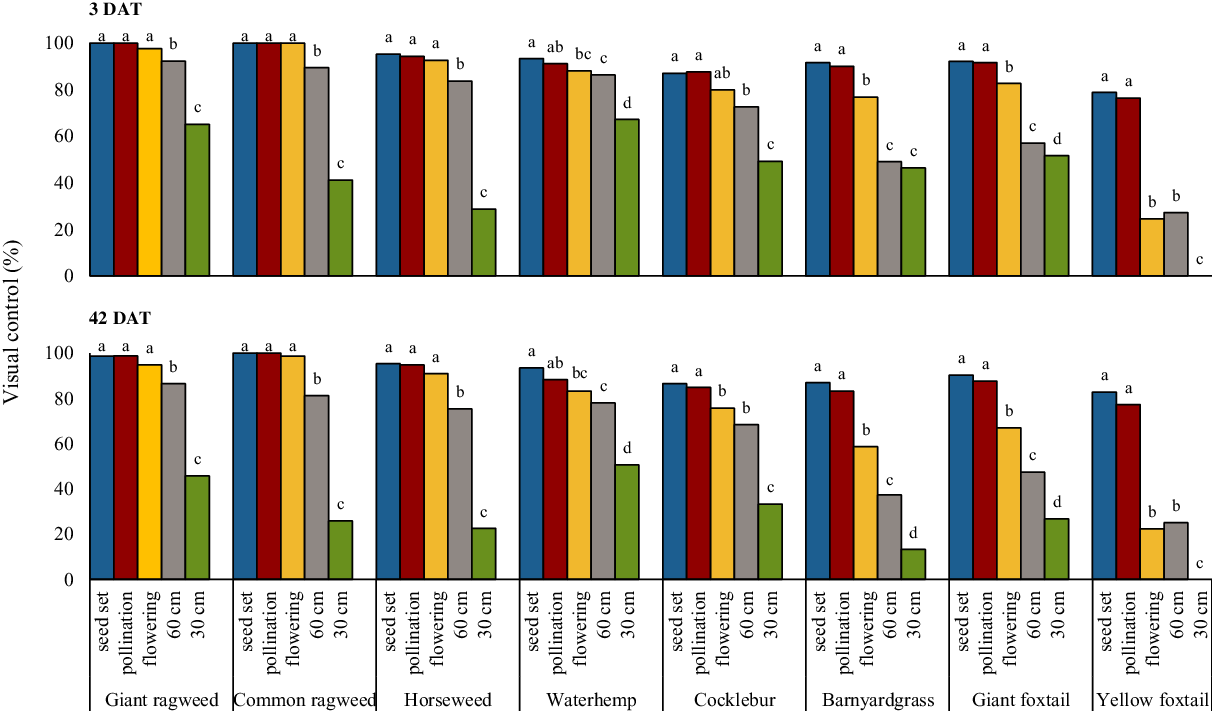
Figure 2. Visual control of various weed species 3 and 42 d after treatment (DAT) at various growth stages. Bars followed by the same letter within a given species and graph are not different, α = 0.05.
Although the number was minimal, some barnyardgrass, giant and yellow foxtail, and waterhemp plants survived electrocution treatments (Figure 3). For the grass weed species, more plants recovered following electrocution at the earlier growth stage timings. For waterhemp, the number of recovered plants never exceeded 1.6 plants/m2, and more plants recovered following electrocution at pollination and flowering compared to the other growth stages. It is possible that the survival of some waterhemp plants may be due to only parts of the plant getting electrocuted and the tendency of waterhemp to compensate growth at the axillary buds when a loss of apical dominance occurs (Horak and Loughin Reference Horak and Loughin2000; Mager et al. Reference Mager, Young and Preece2006). Similar responses can exist following a failed herbicide application. For example, Haarmann et al. (Reference Haarmann, Young and Johnson2020) found that waterhemp plants produced 1.7 to 7.9 new branches upon recovery from a failed application of glufosinate. Diprose et al. (Reference Diprose, Benson and Hackam1980) also observed that weeds among beet crops that survived applications of electrocution contained multi-branched stems with only one or two branches that had been contacted by the electrode. The number of passes was also a significant factor for recovered waterhemp. On average, 1.4 waterhemp plants/m2 recovered following one pass of electrocution, whereas 0.68 plants/m2 recovered following sequential passes (data not shown).
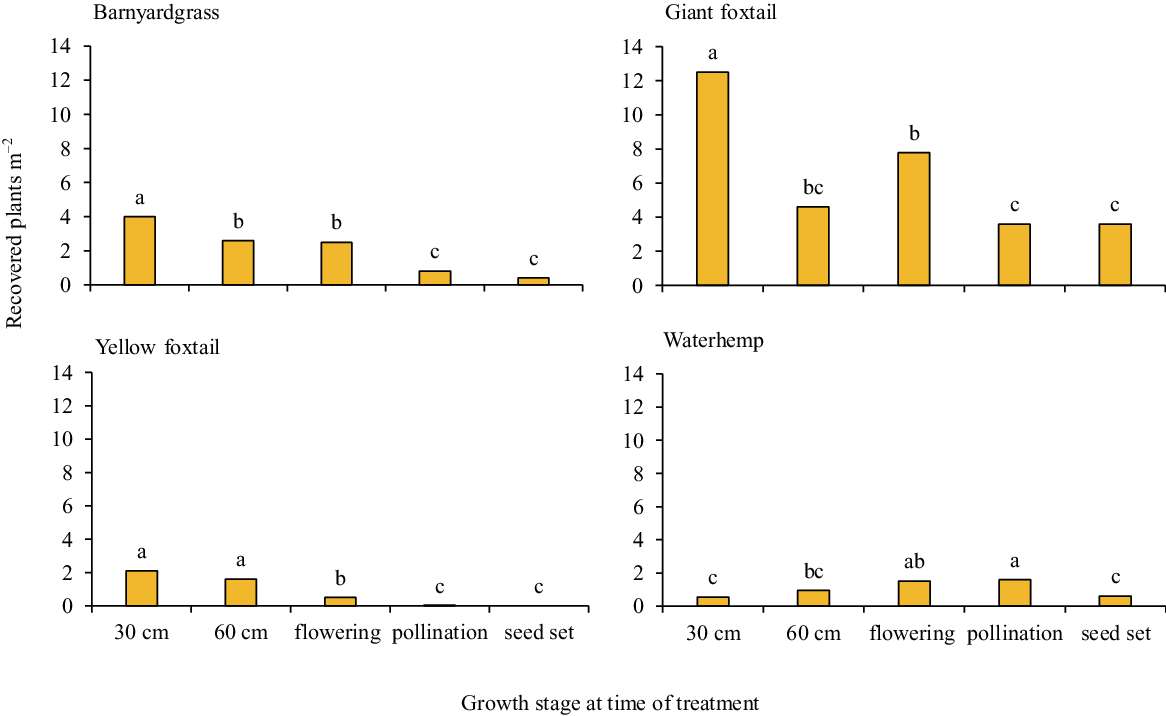
Figure 3. The average number of barnyardgrass, giant and yellow foxtail, and waterhemp plants per square meter that recovered following electrocution at different growth stages. Bars followed by the same letter within a species are not different, α = 0.05.
Pearson correlation coefficients indicated that the control of all weed species 3 and 42 DAT was related to the plant height and amount of plant moisture present at the time of electrocution (Table 6). When considering all broadleaf weeds alone, significant correlations existed among plant moisture, height, and control, whereas for grass species, visual control and plant moisture, density, and height were significantly correlated (Table 6). The strongest correlation observed was for the effect of plant height on grass weed species control. Coefficients were 0.70 and 0.76 at 3 and 42 DAT, respectively, indicating that higher control was achieved as plant height increased. Similar positive coefficients were produced for relationships between plant height and control when comparisons were made on broadleaf weeds alone or all species combined. These results emphasize the importance of plant height on the success of weed electrocution. Among all species for which plant moisture was significant, correlation coefficients were negative, indicating that higher plant moisture led to lower control. There was also a significant positive correlation between grass weed control and plant density, but it is difficult to speculate why greater control of these species would occur when present at higher densities.
Table 6. Pearson correlation coefficients and their significance for visual control, soil moisture, plant moisture, plant density, and plant height at 3 and 42 days after treatment. a,b
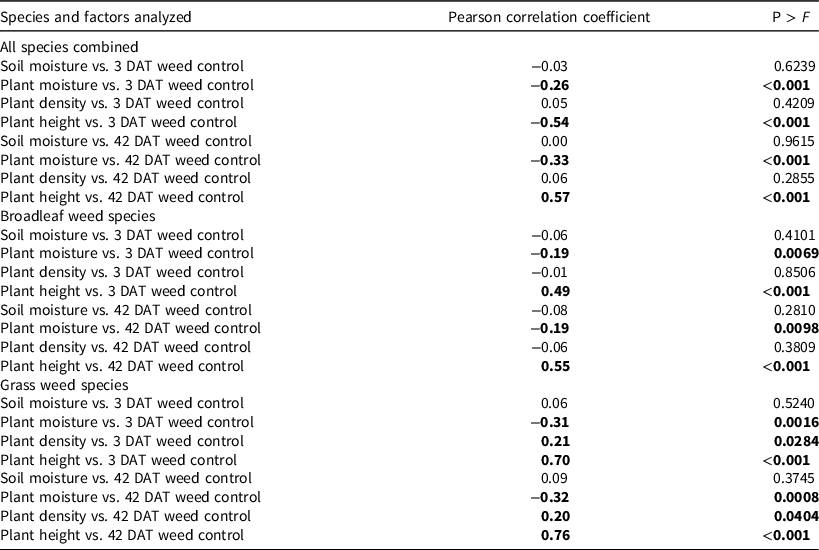
a Abbreviation: DAT, days after treatment.
b Bold type indicates values significant at α ≤ 0.05.
Late-season electrocution reduced weed seed viability from 54% to 80% compared to the nontreated control of each species (Figure 4). Common ragweed had the highest percentage of nonviable seeds (80%), whereas giant foxtail was lowest (54%). Waterhemp, the most common and troublesome weed found in soybean in the United States (VanWychen Reference VanWychen2019), exhibited a 59% reduction in weed seed viability. Diprose et al. (Reference Diprose, Fletcher, Longden and Champion1985) also reported that weed seed viability in beet crops was reduced by 83% compared to the nontreated control. Collectively, these results indicate that electrocution can serve as an effective method of reducing the number of viable seed that are returned to the soil seedbank.
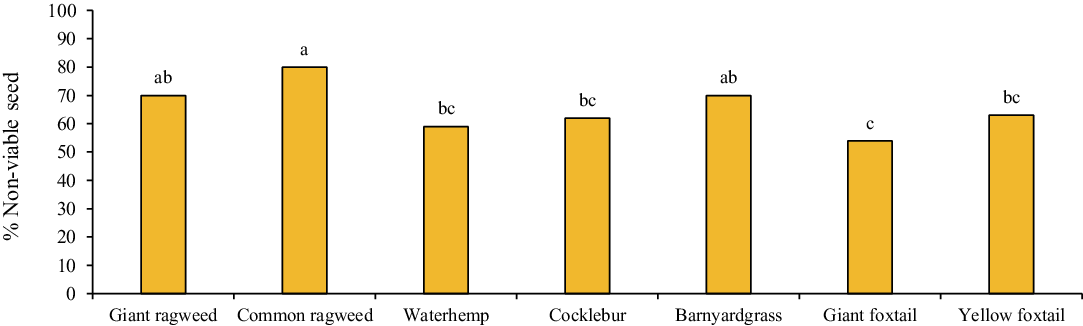
Figure 4. Viability of weed seeds following electrocution. Viability was determined in comparison to the nontreated control of each species. Bars followed by the same letter are not different, α = 0.05.
Soybean Experiment
Soybean injury in response to weed electrocution at various growth stages ranged from 11% to 25% 7 DAT but declined to 5% to 17% by 42 DAT (Table 7). The interaction between soybean growth stage and initial weed presence at the time of treatment was insignificant (P = 0.96), therefore, soybean yield was combined across the weed-free and weed escape treatments (Figure 5). Yield losses ranged from 11% to 26% compared to the nontreated control (Figure 5). The lowest yield loss came from the R1 followed by R3 treatment, which also had the highest visual soybean injury (Figure 5; Table 7). Yield of soybean electrocuted at the R4 and R6 growth stages was not statistically different from that of the nontreated control. However, soybean yields were lower than those of the nontreated control following application at all other growth stages. Overall, our results suggest that too much contact of the electrocution boom with the soybean canopy in later growth stages will likely cause yield loss. It is important to reiterate that in this research, soybean injury and yield loss occurred due to purposely contacting soybean plants with the electrocution boom. However, under normal circumstances in which a height differential exists between the weed escapes and the upper portions of the soybean canopy, contact of the soybean foliage would not need to occur.
Table 7. Soybean injury and waterhemp control 7 and 42 d after treatment following electrocution at different soybean growth stages. a
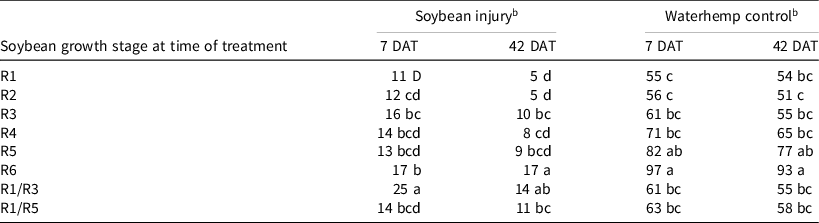
a Abbreviation: DAT, days after treatment.
b Values followed by the same letter within a column are not different, α = 0.05.
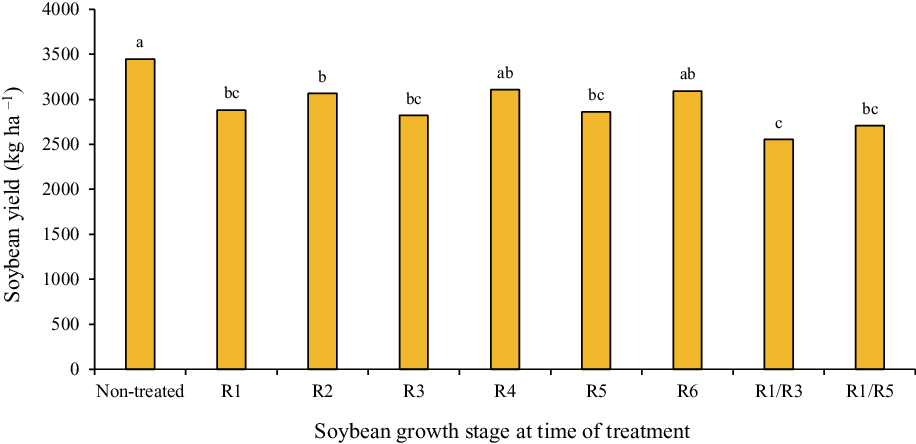
Figure 5. Soybean yield following electrocution at different growth stages. Bars followed by the same letter are not different, α = 0.05.
Control of waterhemp escapes ranged from 55% to 97% 7 DAT and from 51% to 93% 42 DAT (Table 7). Sequential electrocution treatments did not provide greater waterhemp control than any of the single application treatments. Greatest waterhemp control was achieved when electrocution treatments took place at the R5 and R6 stages of soybean growth, most likely due to a greater proportion of waterhemp plants being above the soybean canopy. To further explore this possibility, waterhemp control in relation to the difference in height between waterhemp and soybean at the time of treatment was determined. The scatter plot and best-fit line in Figure 6 suggest higher waterhemp control was achieved when there was a greater height differential between the weed and soybean canopy. Pearson correlation coefficients for this relationship were 0.91 (P < 0.001) and 0.89 (P < 0.001) for the 7 and 42 DAT ratings, respectively, and corroborate that observation. These results agree with those from the individual weed experiment with waterhemp. Diprose et al. (Reference Diprose, Benson and Hackam1980) also reported that most of surviving weed beet plants were below the crop canopy.
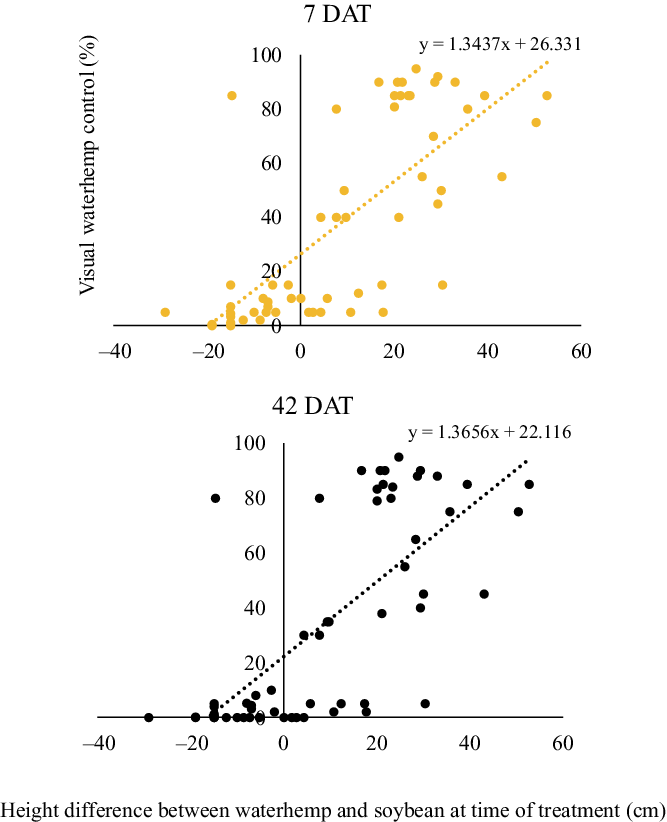
Figure 6. Waterhemp control at 7 and 42 d after treatment (DAT) in relation to the difference in height between waterhemp and soybean at the time of electrocution.
In conclusion, in order to achieve maximum efficacy, electrocution applications should take place when weed species are at least 60 cm tall and/or when weeds escape above the soybean canopy. A second sequential electrocution pass approximately 1 wk following the first did not always improve weed control, especially when a soybean crop was present. This lends support for the importance of a height differential between the weed and the soybean canopy. Although most weeds were completely controlled following electrocution, giant foxtail, yellow foxtail, barnyardgrass, and waterhemp had some surviving plants. Overall, results from these experiments indicate that using weed electrocution in an integrated approach can help combat herbicide-resistant weeds and is best fit to serve as a late season rescue treatment that can offer both weed control as well as reduction of viable weed seed return to the soil seedbank. Future research with weed electrocution should explore factors that have an effect on plant survival as well as physiological differences that may affect efficacy among species.
Acknowledgments
We thank Dr. Christy Spinka for statistical advice and Del Knerr for technical support. This project was funded in part by the Missouri Soybean Merchandising Council. The authors do not declare any other conflicts of interest.


 Open access