


Introduction
Due to the prevalence of glyphosate-resistant weeds such as Palmer amaranth (Amaranthus palmeri S. Watson), horseweed (Erigeron canadensis L.), and waterhemp [Amaranthus tuberculatus (Moq.) J.D. Sauer] in soybean production systems, dicamba has become a critical herbicide used for weed control (Wechsler et al. Reference Wechsler, Smith, McFadden, Dodson and Williamson2019). The introduction of transgenic dicamba-resistant crops in 2017 created a new tool for managing difficult-to-control glyphosate-resistant broadleaf weeds (Johnson et al. Reference Johnson, Young, Matthews, Marquardt, Slack, Bradley, York, Culpepper, Hager, Al-Khatib, Steckel, Moechnig, Loux, Bernards and Smeda2010). With this technology, dicamba products can be applied preplant in no-till production systems and over the top of resistant soybean and cotton (Gossypium hirsutum L.) during the growing season.
Dicamba is a synthetic auxin herbicide, classified in group 4 by the Weed Science Society of America (WSSA). With increased use of dicamba products during the growing season, there is increased concern for off-target dicamba deposition onto broadleaf specialty crops. In 2017, it was estimated that 1.5 million crop hectares in the United States were injured by dicamba off-target movement (WSSA 2018). Off-target deposition of dicamba can occur through wind-driven particle drift, tank and spray equipment contamination, and vaporization (Behrens and Lueschen Reference Behrens and Lueschen1979; Egan and Mortensen Reference Egan and Mortensen2012), and can lead to economic losses and legal issues between growers, manufacturers, and applicators. Physical drift occurs when spray particles are carried by the wind off target onto an adjacent field. Dicamba products are volatile, with substantive vaporization possible, which increases the risk for secondary off-target movement (Behrens and Lueschen Reference Behrens and Lueschen1979). Volatilization occurs when the herbicide evaporates from the plant foliage and travels by wind to an adjacent field (Oseland et al. Reference Oseland, Bish, Steckel and Bradley2020). Dicamba injury, even at very low rates, can cause a distinctive leaf cupping, epinasty, swollen petiole bases, and terminal chlorosis in broadleaf plants, whereas grasses tend to be tolerant of dicamba injury (Griffin et al. Reference Griffin, Bauerle, Stephenson, Miller and Boudreaux2013; McCown et al. Reference McCown, Barber and Norsworthy2018; Monaco et al. Reference Monaco, Weller and Ashton2002).
Currently, researchers rely on visual estimates to determine the amount of acute injury that a crop endures from herbicides (Colquhoun et al. Reference Colquhoun, Heider and Rittmeyer2014; Knezevic et al. Reference Knezevic, Osipitan and Scott2018; Mohseni-Moghadam and Doohan Reference Mohseni-Moghadam and Doohan2015). In a meta-analysis of soybean response to dicamba, Kniss (Reference Kniss2018) demonstrated that visible injury severity associated with a 5% soybean yield loss varied greatly across 11 studies, ranging from 10% to 43% visible injury. Perception of visible injury varies among individuals, causing injury severity ratings to be subjective, and therefore prone to inconsistencies. For example, Parker et al. (Reference Parker, Shaw and Royle1995) noted that visual estimates varied greatly from actual injury levels, even after averaging, when compared to image analysis methods for disease severity in wheat, suggesting that visual estimates are both imprecise and inaccurate. Two disease treatments were statistically indistinguishable with visual ratings but were able to be statistically separated with imaging analysis techniques. Additionally, Neeser et al. (Reference Neeser, Martin, Juroszek and Mortensen2000) concluded that visual methods for estimated weed biomass and weed control in soybean were less consistent and more biased, since the photographic estimate method more accurately predicted yield than the visual rating method. Zhang et al. (Reference Zhang, Huang and Reddy2019) used hyperspectral imaging and machine learning to assess dicamba injury on soybean and concluded that this method was able to accurately differentiate recoverable from nonrecoverable injury with 90% overall accuracy. A practical method that can provide a quantitative measurement of dicamba-induced leaf deformation would be valuable to researchers.
This paper assesses the leaf deformation index (LDI) method, which uses a flatbed scanner to measure the ratio projected leaf area and flattened leaf area. Because the method proposed here requires leaf area measurements, it may be used not just by researchers, but also by crop consultants and growers who have appropriate tools such as a camera or scanner. Further development of this method could allow growers to objectively assess and quantify impacts of dicamba off-target movement in the field. One intended use of this method for researchers would be to separate closely related species by their relative sensitivities based on leaf deformation, to determine which crop is more at-risk for injury. Because specialty crops vary greatly in morphology and architecture, it is difficult to visually distinguish leaf deformation severity among different crops. For example, previous literature shows that soybean, tomato, and grape (Vitis vinifera L.) crops are sensitive to sublethal rates of dicamba (Knezevic et al. Reference Knezevic, Osipitan and Scott2018; Kniss Reference Kniss2018). However, it is difficult to accurately determine which of these three crops is the most sensitive using visual evaluations alone, and therefore the most at-risk for dicamba injury. Although yield reductions may provide some insight to relative sensitivities, crops that have marketable foliage, such as basil (Ocimum basilicum L.) and lettuce (Lactuca sativa L.), may be aesthetically injured by dicamba and therefore be unmarketable. It is important to be able to organize crops by relative sensitivities so that growers can plan their planting strategies around dicamba-treated areas and thereby reduce the risk of dicamba off-target injury. The objectives of this study were to evaluate the LDI imaging analysis method for suitability and to use this novel method to quantify relative sensitivities of different vegetable crop species to sublethal rates of dicamba.
Materials and Methods
Plant Culture
This study was conducted between 2019 and 2021 in a greenhouse on the campus of Rutgers University in New Brunswick, NJ. The photoperiod was 16 h with supplemental artificial lighting provided by a 400-watt high-pressure sodium lamp when photosynthetically active radiation fell below 400 µE m−2 s−1. Daily low temperatures ranged from 18 C to 20 C with an average of 19 C. Daily high temperatures ranged from 21 C to 23 C with an average of 22 C. ‘Roma’ tomato, ‘Caprice’ snap bean, ‘Burpless Beauty’ cucumber, and ‘SG 4078 GT/LL’ dicamba-susceptible soybean were planted in commercial growing medium (SunGro® Horticulture Professional Growing Mix, Agawam, MA) in the greenhouse, and potted plants were hand watered daily. Soybean, cucumber, and snap bean were grown in 10-cm square pots while tomato was grown in 3.7-L round pots.
Herbicide Treatments
Sublethal rates of dicamba were applied to the vegetable crops to simulate possible active ingredient quantities found in drift and evaluate the morphological effects. Applications were made with a research track sprayer chamber (Generation 3; DeVries Manufacturing SB8-211, Hollandale, MN) equipped with a single 8002EVS Flat Fan TeeJet® nozzle (TeeJet, Glendale Heights, IL), delivering 140 L ha−1 at 310 KPa. Herbicide application was targeted at the growth stage at which the vegetable crop would be during mid-June in New Jersey, when soybean is typically treated with dicamba. The herbicide was applied to tomato, snap bean, cucumber, and soybean plants when plants were 30 to 38 cm tall, at the cotyledon stage, at the V2 stage, and at the V3 stage, respectively. The dicamba (XtendiMax®; Bayer Crop Science, Research Triangle Park, NC) doses were 0, 56, 112, 280, 560, 1,120, and 2,240 mg ae ha−1, which represent, respectively, 0, 1/10,000, 1/5,000, 1/2,000, 1/1,000, 1/500, and 1/250 of the maximum recommended label rate for soybean application (560 g ae ha−1). The experiment was arranged in a randomized complete block design with five replications and was repeated in the winters of 2020 and 2021.
Visual Evaluations
Visual estimation of leaf deformation was based on percent reduction of projected leaf area caused by dicamba-induced deformation compared to the nontreated control foliage. The leaf deformation rating is based on a composite estimation of leaf cupping, leaf crinkling, and leaf strapping compared to the nontreated control. Leaf deformation was visually evaluated 4 wk after treatment (WAT) using a scale from 0 (flat leaf) to 100 (no measurable leaf area). Because dicamba tends to accumulate in meristematic tissue of broadleaf plants and manifest injury in the uppermost leaves, visual evaluations included only foliage that emerged after the herbicide treatments were applied (Chang and Vanden Born Reference Chang and Vanden Born1971; Griffin et al. Reference Griffin, Bauerle, Stephenson, Miller and Boudreaux2013; McCowan et al. Reference McCown, Barber and Norsworthy2018). The visual estimation of leaf deformation was subtracted from 100 to provide a visual estimate of nondeformed leaf area and allows direct comparison with LDI values.
Leaf Deformation Index
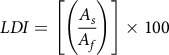
The first newly emerged leaf on each plant was marked with tape immediately after dicamba application, because dicamba exposure consistently affects new leaf development (Robinson et al. Reference Robinson, Simpson and Johnson2013). Therefore, a single leaf was selected as a representative sample because most of the leaf deformation symptomology was localized in the first emerged leaf. To allow for full extension of the first newly emerged leaf, 4 WAT was determined to be the optimal sampling time across the four plant species we investigated. Marked leaves were then removed and the LDI was measured for each leaf sample based on a method developed by Sassenrath-Cole (Reference Sassenrath-Cole1995) to quantify leaf deformation following dicamba applications. Leaf shadow and leaf area were measured using a Perfection V800 photo scanner (Epson, Los Alamitos, CA) and jointly computed by WinRhizo Arabidopsis 2017 software (Regent Instruments Inc., Quebec City, QC, Canada). The software employed the “distinct objects” modification and omitted the “root morphology” function within the measurement settings, and all images were acquired in grayscale at 400 dots per inch. Global projected area was recorded for each leaf sample. “Leaf shadow” refers to the two-dimensional projection of the leaf in its natural configuration when illuminated by the scanner (Sassenrath-Cole Reference Sassenrath-Cole1995). “Leaf area” refers to the two-dimensional projection of the flattened leaf when illuminated by the scanner. For each leaf sample, the leaf shadow was measured by placing the leaf in its natural configuration face-down on the scanner, because the light source of the scanner is underneath the leaf, in attempt to mimic regular light conditions on the top leaf surface. Then, the leaf area is determined by gently flattening the same leaf under a clear plastic tray face-down and measuring the area (Figure 1). The LDI was calculated as indicated in Equation 1:
 $$LDI = \left[ {\left( {{{{A_s}} \over {{A_f}}}} \right)} \right] \times 100$$
Figure 1. Demonstration of leaf deformation measured using a photo scanner for nonflattened leaf of cucumber exposed to 1,120 mg ae ha−1 of dicamba (A) and the resulting leaf area (B), and for the same flattened leaf (C) and the resulting leaf area (D).
where A s is the leaf shadow area and A f is leaf flattened area.
Low LDI values indicate higher levels of leaf deformation, whereas LDI values closer to 100 indicate lower levels of deformation. LDI serves as a quantitative measurement of leaf deformation caused by dicamba independently of leaf area reduction.
Statistical Analysis
For statistical analysis, dicamba rate and plant species were considered fixed effects while blocks nested within runs were considered random effects. Analysis of variance was conducted on LDI and visual estimation of leaf deformation data to determine whether the effect of dicamba rate was significant (P ≤ 0.05) using the GLM procedure in SAS 9.4 (SAS Institute, Cary, NC). Nonlinear regression analysis was then performed on LDI and visual estimation of leaf deformation data with the NLIN procedure in SAS and using a four-parameter log-logistic model (Equation 2) as recommended for dose response studies (Knezevic et al. Reference Knezevic, Streibig and Ritz2007; Seefeldt et al. Reference Seefeldt, Jensen and Fuerst1995):
 $$Y = \delta + (\alpha - \delta )/\{ 1 + \exp [\beta (\log \,x - \log \,\theta )]\} $$
where Y is the dependent variable (LDI or visual estimation of leaf deformation), x is the dicamba rate expressed in mg ae ha−1, δ is the lower limit of the response, α is the upper limit of the response, θ is the I50 inflection point (i.e., dicamba rate corresponding to 50% response between upper and lower limit), and β is the slope around the point of inflection. Data were plotted in SigmaPlot 12.0 (Systat Software Inc., San Jose, CA). A paired t-test was performed using the TTEST procedure in SAS 9.4 to determine whether I50 means differed significantly (P ≤ 0.05) depending on the methodology used for quantifying leaf deformation.
Root mean square error (RMSE) and modeling coefficient efficiency (ME) were calculated to assess the goodness of fit for LDI and visual estimation of leaf deformation (Heneghan and Johnson Reference Heneghan and Johnson2017; Sarangi et al. Reference Sarangi, Irmak, Lindquist, Knezevic and Jhala2016). RMSE was computed using Equation 3:
 $$RMSE = {\left[ {{1 \over n}\sum\limits_{i \,= 1}^n {{{({P_i} - {O_i})}^2}} } \right]^{{1 \over 2}}}$$
where P i and O i are the predicted and observed values, respectively, and n is the total number of observations. Smaller RMSE values indicate a better fit to the model (McMaster et al. Reference McMaster, Wilhelm and Morgan1992). ME was used instead of R 2 since the R 2 computation is very biased to highly parameterized models and therefore provides an inadequate evaluation of the goodness of fit (Sarangi et al. Reference Sarangi, Irmak, Lindquist, Knezevic and Jhala2016). ME was computed using Equation 4:
 $$ME = 1 - \left[ {\sum\limits_{i \,= \,1}^n {{{({O_i} - {P_i})}^2}\bigg/\sum\limits_{i\, = \,1}^n {{{({O_i} - {{\overline O}_i})}^2}} } } \right]$$
where $ {\overline O}_i$
is the mean observed value and all other parameters are the same as un Equation 2. ME ranges from −∞ to 1 with values closer to 1 demonstrating a better goodness of fit of the model.
$ {\overline O}_i$
is the mean observed value and all other parameters are the same as un Equation 2. ME ranges from −∞ to 1 with values closer to 1 demonstrating a better goodness of fit of the model.
Results and Discussion
Soybean
In this study, mean visual estimates of nondeformed leaf area at 4 WAT were 50%, 61%, 73%, 84%, 94%, 98%, and 100% for the highest to lowest rates of dicamba, respectively (Figure 2A). Results of the log-logistic analysis suggest that the I50 of soybean visual leaf deformation rating was 530 mg ae ha−1 (Table 1). The I50 value for the LDI measurement was 351 mg ae ha−1 for soybean and was not significantly different from the I50 obtained with visual rating according to the t-test analysis (P = 0.274). A meta-analysis of soybean responses to dicamba concluded that susceptible soybean could be injured by 1/20,000th of the label rate (0.03 g ae ha−1), and a 5% yield reduction is likely at rates as low as 1/1,000th of the label rate (0.9 g ae ha−1; Kniss Reference Kniss2018). LDI values for soybean were 71%, 76%, 83%, 87%, 96%, 98%, and 98% on average from highest to lowest rate, respectively. The I50 calculated by LDI is lower than the visual I50, suggesting that a lower dose of dicamba caused 50% of leaf deformation using the LDI method when compared to visual rating techniques. Differences in I50 between the two methods may be attributed to differences in the ranges of values. The upper limits of both methods have similar values within each crop, whereas the lower limits vary greatly between both methods. Additionally, it is notable that as the rates increased, the differential between the two methods increased in all four crops. The differential between the two methods at high rates may be attributed to visual overestimation of leaf deformation when injury was relatively high. This phenomenon has been documented in previous studies that evaluated the accuracy of visual injury assessments for plant diseases (Bock et al. Reference Bock, Poole, Parker and Gottwald2010; Price et al. Reference Price, Gross, Ho Wey and Osborne1993). Previous studies have also indicated that qualitative visual rating methods are not as precise or accurate as quantitative rating methods, suggesting a need for an unbiased rating method for evaluating dicamba drift foliar injury (Neeser et al. Reference Neeser, Martin, Juroszek and Mortensen2000; Parker et al. Reference Parker, Shaw and Royle1995).
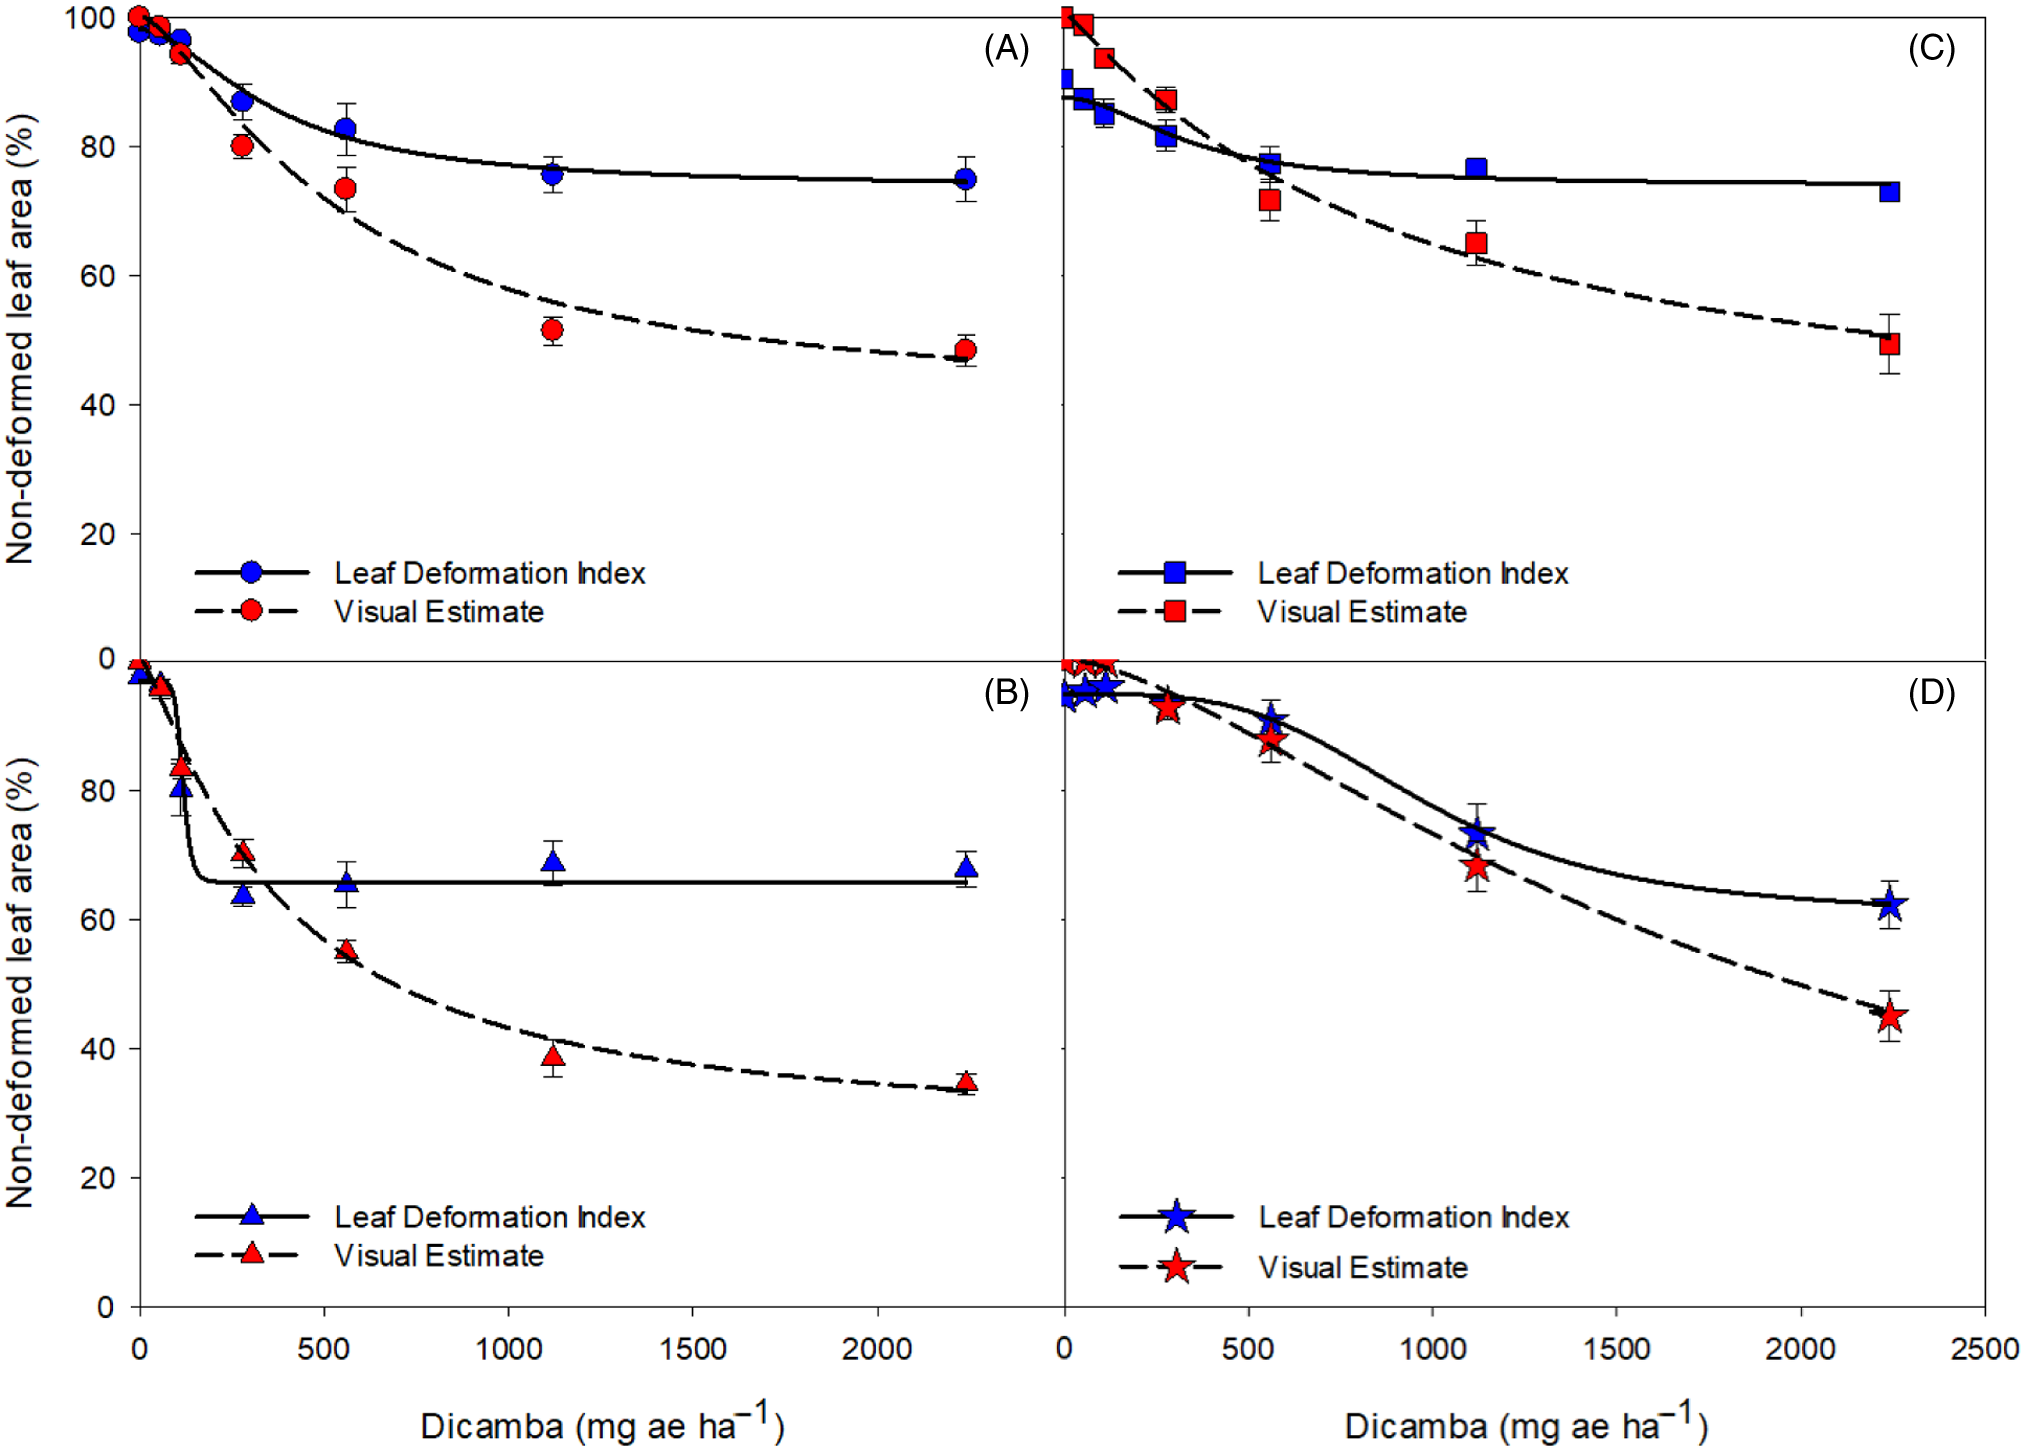
Figure 2. Measured leaf deformation index and visual estimate of nondeformed leaf area 28 d after treatment in response to 0, 56, 112, 280, 560, 1,120, and 2,240 mg ae ha−1 rates of dicamba for soybean (A), snap bean (B), tomato (C) and cucumber (D).
Table 1. Log-logistic dose-response model parameters for measured leaf deformation index and visual estimation of leaf deformation 28 d after application of 0, 56, 112, 280, 560, 1,120, and 2,240 mg ae ha−1 rates of dicamba.
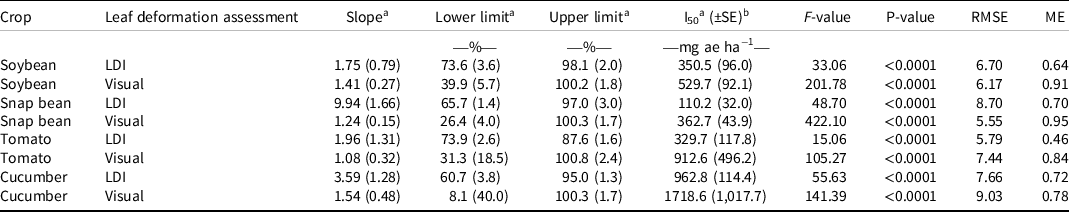
a Values are followed by ± standard errors in parentheses.
b Abbreviations: I50, dicamba rate corresponding to 50% response between upper and lower limit; ME, modeling efficiency; RMSE, root mean square error.
Snap Bean
Snap bean visual estimates of nondeformed leaf area were 33%, 41%, 55%, 73%, 85%, 96%, and 100% from highest to lowest rate, respectively (Figure 2B). LDI values for snap bean were 79%, 69%, 69%, 74%, 80%, 93%, and 97% on average from highest to lowest rate, respectively. The I50 values for snap beans were approximately 363 and 110 mg ae ha−1 for visual leaf deformation and LDI, respectively, suggesting that the inflection point was approximately three times lower with the LDI method than with the visual leaf deformation method (Table 1). The I50 value for the LDI measurement was significantly different from the I50 obtained with visual rating according to the t-test analysis (P < 0.0001). The large separation of the two I50 values implies that the LDI method is a more sensitive method for detecting crop sensitivity, because 50% of the observations occurred at a lower rate for the LDI measurement than for the visual leaf deformation measurement.
Tomato
Visual estimates of nondeformed leaf area for tomato were 50%, 65%, 72%, 87%, 95%, 99%, and 100% from the highest to lowest dicamba rate, respectively (Figure 2C). Previous research suggests that tomato crops are very sensitive to low doses of dicamba, with tomato height decreasing by up to 50% when exposed to 1/50 of the label rate (Knezevic et al. Reference Knezevic, Osipitan and Scott2018). LDI ratings for tomato were 69%, 79%, 77%, 81%, 85%, 90%, and 93%, from the highest to lowest rate applied, respectively. The I50 values for tomato were approximately 913 and 330 mg ae ha−1 for visual leaf deformation and LDI, respectively (Table 1). Similar to snap bean, the I50 value for the LDI measurement was different from the I50 obtained with visual rating according to the t-test analysis (P = 0.0206), indicating that the 50% leaf deformation threshold was reached at a significantly lower dicamba rate based on the LDI compared to the visual method.
According to visual deformation ratings, tomato was, on average, less sensitive than soybean to dicamba. However, LDI measurements indicate that tomato was on average more sensitive than soybean. This discrepancy is attributed to difficulty in visually evaluating plants with different plant architecture. Because soybean and snap bean leaves are relatively flat in their natural, uninjured conformation, it was easier to visually evaluate the percent of leaf deformation for these crops. Conversely, tomato plants have naturally curled and crinkled leaflets, making visual evaluation of leaf area reduction more variable.
Cucumber
Visual estimates of nondeformed leaf area for cucumber were 33%, 75%, 90%, 99%, 100%, 100%, and 100% from the highest to lowest rate applied, respectively (Figure 2D). Previous studies on cucurbit crops showed significant dicamba sensitivity. Early season injury by dicamba (1/75th and 1/250th of the dicamba label rate) reduced watermelon yield by 13% to 20% (Culpepper et al. Reference Culpepper, Sosnoskie, Shugart, Leifheit, Curry and Gray2018). Additionally, 1/75th of the label rate applied to cucumber caused a 23% reduction in vine length and an average 48% reduction in the number of fruits (Hand et al. Reference Hand, Vance, Randell, Shugart, Gray, Luo and Culpepper2021). Cucumber LDI values were 62%, 79%, 91%, 91%, 96%, 95%, and 95%, from the highest to lowest rate applied, respectively. The cucumber I50 values for visual injury and LDI were 1,719 and 963 mg ha−1, respectively, indicating that a lower dose caused 50% leaf deformation using the LDI method when compared to visual rating techniques (Table 1). The I50 value for the LDI measurement was not significantly different from the I50 obtained with visual rating according to the t-test analysis (P = 0.2861).
According to I50 values, snap beans were more sensitive to dicamba than all other crops evaluated in this research (Table 1). Cucumber had less visual leaf deformation on average across rates when compared to all other crop species, although the highest rate (1/250th of the label rate) resulted in a lower visually estimated percentage of nondeformed leaf area for cucumber (34%) than for soybean (49%) and tomato (50%). At the low rates, cucumber was less injured using a visual assessment than all other crop species. LDI values also indicated that cucumber endured the most severe leaf deformation at high dicamba rates, yet the least severe leaf deformation at low dicamba rates. Additionally, the LDI data indicate that tomato leaf deformation was more severe than that to cucumber at low dicamba rates, but rates >500 mg ae ha−1 did not increase tomato leaf deformation. In all crops, the LDI and visual rating methods had values that did not vary greatly at low rates of dicamba but differed more when higher rates were applied. This suggests that the LDI and visual assessment methods may have equivalent uses when injury rates are lower, but the LDI method may be able to more accurately discern between injury levels when higher rates are applied. This demonstrates that the LDI method may be able to provide more information about the intricate relationships between dicamba rate, leaf deformation, and species than the visual rating method alone. This LDI method is useful to explain the sensitivity of closely related species to dicamba, but it can also objectively separate unrelated crop species with varied plant architecture. RMSE values for all crops tested ranged from 5.55 to 9.03, and ME values ranged from 0.46 to 0.95, indicating that this model is sufficient for the data (Table 1).
The LDI method developed in this research has the potential to quantify dicamba leaf deformation as a complementary tool to visual evaluation. For all crop species tested, I50 values were lower for LDI evaluations than for visual evaluations. Future studies may address some limitations of this study, including performing this technique in a field setting, using more tissue samples, and sampling at other plant growth stages. Differences in LDI and visual evaluations also may be attributed to differences between rating one representative leaf sample and whole plant ratings. Because leaf deformation may not always translate to a yield reduction in the field, future studies should aim to associate LDI and yield loss to help growers assess injury risk from off-target deposition of dicamba. Additionally, future studies may evaluate I10 values to investigate fine differences in relative sensitivities between several crops. With more research, tools such as a smartphone application could be developed to measure projected leaf areas for use by growers and crop consultants to mitigate the variability of visual evaluations of injury in the field. Further development of this method could prove useful for both researchers and growers to objectively assess dicamba off-target injury.
Acknowledgments
Funding for this research was provided by Bayer Crop Science and the Rutgers New Jersey Agricultural Experiment Station. We thank Baylee Carr, Tim Jensen, Suzanne Polashock, David Mayonado, Corrie Hopkins and the crew at the Rutgers University NJAES greenhouses for their technical support. We also thank Mark VanGessel for reviewing the manuscript. No conflicts of interests have been declared.


 Open access