


Cover crops are increasingly being used to provide multiple ecosystem services that sustain and enhance soil and water quality and reduce pest management inputs (O’Connell et al. Reference O’Connell, Grossman, Hoyt, Shy, Bowen, Marticorena, Fager and Creamer2014; Singer et al. Reference Singer, Nusser and Alf2007). Weed suppression has been ranked among the top three reasons farmers in the U.S. Northeast adopt cover crops, along with increasing soil organic matter and reducing erosion (Hamilton Reference Hamilton2016; O’Connell et al. Reference O’Connell, Grossman, Hoyt, Shy, Bowen, Marticorena, Fager and Creamer2014; Sustainable Agriculture Research and Education 2015). While individual cover crop species are known to be particularly effective at providing a specific ecosystem service, a growing number of studies indicate that cover crop mixtures may increase the breadth of services provided (Brainard et al. Reference Brainard, Bellinder and Kumar2011; Finney et al. Reference Finney, White and Kaye2015). It is therefore important to develop cover-cropping strategies, including mixtures that can effectively suppress weeds while also meeting other farmer objectives.
Cover crops can be used to suppress weeds during several crop production phases. Cover crop residues retained on the soil surface can directly limit germination and growth of weeds in the following cash crop (Mirsky et al. Reference Mirsky, Curran, Mortensen, Ryan and Shumway2011; Ryan et al. Reference Ryan, Mirsky, Mortensen, Teasdale and Curran2011; Teasdale and Mirsky Reference Teasdale and Mirsky2015). However, there are many cropping systems where substantial cover crop residues are not retained during the cash crop phase due to management constraints. Cover crops can also be used to prevent weed germination and growth in the period between cash crops (Brainard et al. Reference Brainard, Bellinder and Kumar2011; Dorn et al. Reference Dorn, Jossi and Van der Heijden2015; Lawson et al. Reference Lawson, Cogger, Bary and Fortuna2015). In this case, the living cover crops directly compete with the weeds.
Weed-suppressive cover crop stands can improve long-term weed population management in multiple ways. Most importantly, they can help prevent the buildup of weedy plant populations and therefore reduce weed pressure in future cash crops. Limiting weed population growth is a foundation of weed management in organic systems, where chemical weed control options are limited. More specifically, weed-suppressive cover crops can be especially important in organic reduced-till systems, where cover crop residues are used to suppress weeds in the following cash crop. In those systems, limiting germination of summer-annual weeds in the cover crop phase can improve weed control later in the summer (Mirsky et al. Reference Mirsky, Curran, Mortensen, Ryan and Shumway2011). In conventional systems, cover crops planted between cash crops can offset the need for an early-season herbicide application or tillage before cash crop planting and, as such, are considered a best management practice for reducing selection pressure for herbicide resistance (Norsworthy et al. Reference Norsworthy, Ward, Shaw, Llewellyn, Nichols, Webster, Bradley, Frisvold, Powles, Burgos, Witt and Barrett2012). Integrating weed-suppressive cover crops into weed management programs can be especially important in no-till systems, where weed control tactics other than herbicide use are more heavily constrained. A relatively weed-free cover crop stand may also be better able to deliver desired ecosystem services that derive from specific cover crop species, such as nitrogen fixation in the case of leguminous cover crops (Brainard et al. Reference Brainard, Bellinder and Kumar2011). Finally, cover crops can suppress weeds that act as “green bridges” for pathogens, nematodes, or insect pests (Creech et al. Reference Creech, Webb, Young, Bond, Harrison, Ferris, Faghihi, Westphal and Johnson2007; Wisler and Norris Reference Wisler and Norris2005), although cover crops themselves can also become green bridges (Koike et al. Reference Koike, Smith, Jackson, Wyland, Inman and Chaney1996). Though weedy species may sometimes provide important ecosystem services such as nitrogen retention (White et al. Reference White, DuPont, Hautau, Hartman, Finney, Bradley, LaChance and Kaye2017; Wortman et al. Reference Wortman, Francis, Bernards, Drijber and Lindquist2012), weeds are generally seen as undesirable in a growing cover crop.
The ability of a living cover crop to suppress weeds is somewhat species- or genus-specific, due to functional traits that differ by taxonomic group. Grasses (Gramineae) like cereal or oats are highly weed suppressive due to their rapid growth rate and efficient nitrogen uptake (Brainard et al. Reference Brainard, Bellinder and Kumar2011; Brennan and Smith Reference Brennan and Smith2005; Dorn et al. Reference Dorn, Jossi and Van der Heijden2015; Finney et al. Reference Finney, White and Kaye2015; Hayden et al. Reference Hayden, Brainard, Henshaw and Ngouajio2012). Grasses may also be allelopathic (Kato-Noguchi et al. Reference Kato-Noguchi, Kosemura, Yamamura, Mizutani and Hasegawa1994; Schulz et al. Reference Schulz, Marocco, Tabaglio, Macias and Molinillo2013). Similarly, mustards (Brassicaceae) can suppress weeds through direct competition and the release of allelopathic compounds (Björkman et al. Reference Björkman, Lowry, Shail, Brainard, Anderson and Masiunas2015; Finney et al. Reference Finney, White and Kaye2015). Conversely, legumes (Leguminosae) such as red clover and hairy vetch (Vicia villosa Roth) grow slowly at first, so they compete poorly with weeds in the fall (Lawson et al. Reference Lawson, Cogger, Bary and Fortuna2015; but see Hayden et al. Reference Hayden, Brainard, Henshaw and Ngouajio2012). In addition, some important functional traits transcend taxonomic groups. For example, some species winter kill in USDA hardiness zones above 5 (oats, forage radish), thereby possibly reducing their capacity for weed suppression in the spring, while others are winter hardy if they have time to establish in the fall (cereal rye, canola, red clover).
Even if research on intercropping has shed some light on how combinations of species may suppress weeds (Lithourgidis et al. Reference Lithourgidis, Dordas, Damalas and Vlachostergios2011), the mechanism of weed suppression in a cover crop mixture is still not well understood. Some studies suggest that increased cover crop diversity results in greater cover crop biomass and therefore greater weed suppression (Akemo et al. Reference Akemo, Regnier and Bennett2000; Brennan and Smith Reference Brennan and Smith2005; Lawson et al. Reference Lawson, Cogger, Bary and Fortuna2015). This relationship has also been found in nonagricultural ecosystems, where increasing plant diversity (of species and/or functional traits) resulted in greater complementarity of resource exploitation and greater plant growth (Hooper et al. Reference Hooper, Chapin, Ewel, Hector, Inchausti, Lavorel, Lawton, Lodge, Loreau, Naeem, Schmid, Setala, Symstad, Vandermeer and Wardle2005; Loreau et al. Reference Loreau, Naeem, Inchausti, Bengtsson, Grime, Hector, Hooper, Huston, Raffaelli, Schmid, Tilman and Wardle2001; Tilman Reference Tilman1999). According to the complementarity hypothesis, niche exploitation should increase with increasing cover crop diversity, thereby preempting weed establishment and growth. Other cover crop studies have reported that mixtures are particularly weed suppressive when they contain one or more highly competitive species providing the desired functional traits (high biomass, rapid fall growth), regardless of the performance of other species in the mixture (DeHaan et al. Reference DeHaan, Weisberg, Tilman and Fornara2010; Smith et al. Reference Smith, Atwood and Warren2014). As a result, mixtures and monocultures may provide similar levels of weed suppression if both have sufficient biomass of the main weed-suppressive species. Cover crop planting date can also mediate weed suppression, since it can influence weed seedbank expression, cover crop species establishment, and overwinter mortality and biomass production of both weeds and cover crops (Lawson et al. Reference Lawson, Cogger, Bary and Fortuna2015; Mirsky et al. Reference Mirsky, Curran, Mortensen, Ryan and Shumway2011; Nord et al. Reference Nord, Ryan, Curran, Mortensen and Mirsky2012). Interactions between planting date and weed suppression in cover crop mixtures have not been widely explored. Given these uncertainties, understanding how cover crop mixtures suppress weeds can provide useful information to design weed-suppressive mixtures that can still provide other ecosystem services.
In this study, we quantified the weed-suppressive effects of six cover crop species and four cover crop mixtures in a long (after winter wheat) and a short (after corn silage) fall growing window. This research is part of a large, multidisciplinary project aimed at assessing multifunctionality of cover crop species and mixtures, wherein weed suppression is one of nine ecosystem services being measured (Murrell et al. Reference Murrell, Schipanski, Finney, Hunter, Burgess, LaChance, Baraibar, White, Mortensen and Kaye2017). Mixtures were designed to meet particular goals (e.g., manage nitrogen, provide habitat for beneficial insects, etc.), with only one mixture primarily focused on weed suppression.
The main objectives of this study were to (1) quantify the weed-suppressive effects of cover crop monocultures and mixtures in two planting windows typical of a dairy/grain production system and (2) quantify the roles of cover crop biomass and cover crop species richness in weed suppression. We hypothesized that mixtures would be as weed suppressive as grass monocultures and more weed suppressive than brassica and legume monocultures. Cover crop biomass was expected to be the main factor explaining weed suppression in monocultures and mixtures. As a consequence, in spring we expected higher weed suppression in winter-hardy cover crop monocultures and mixtures, compared with winter-killed monocultures.
Materials and Methods
Site
The field experiment was conducted at the Russell E. Larson Agricultural Research Center near Rock Springs in central Pennsylvania (40.717°N, 77.917°W, 350 m elevation). Annually this region receives 975 mm of precipitation with mean monthly temperatures ranging from −3 C (January) to 22 C (July). The dominant soil series at the site (comprising >80% of total land area) is a Murrill channery silt loam (fine-loamy, mixed, semiactive, mesic Typic Hapludult) with the remainder of the site underlain by Hagerstown silt loam (fine, mixed, semiactive, mesic Typic Hapludalf) and Buchanan channery loam soils (fine-loamy, mixed, semiactive, mesic Aquic Fragiudult). Soil texture is a clay loam with sand (21% to 27%), silt (40% to 48%), and clay (30% to 34%) varying across the study site.
Experimental Design and Crop Management
The experiment was managed according to U.S. organic certification standards (www.ams.usda.gov/NOP), and the data presented here were collected during the 3-yr transition period leading up to organic certification. The experiment was initiated in August 2012, and the data were collected through September 2015, covering three full growing seasons. We will refer to the years of the study according to the fall-to-spring cover crop growing window, not the calendar year, such that years 1 to 3 refer to fall 2012 to spring 2013, fall 2013 to spring 2014, and fall 2014 to spring 2015, respectively.
The experiment was a randomized complete block design with four replications in which 10 cover crop treatments and a no–cover crop control (total of 11 treatments) were embedded in a full entry rotation of corn, soybean [Glycine max (L.) Merr.], and winter wheat. This crop rotation included two opportunities for establishing cover crops: (1) a long window following wheat and before corn (referred to hereafter as AW, after wheat), in which the cover crop was planted in August (August 8 to August 24); and (2) a short window following corn and before soybean (referred to hereafter as AC, after corn), with planting occurring in early fall (September 20 to October 10). Cover crops in the two windows were terminated in early to mid-May.
Cover crop treatments ranged in diversity from one to six species. In total there were 88 main cover crop treatment plots (11 treatments by 2 planting windows by 4 replicates). Each plot was 24 m by 29 m with a 3-m alley separating the plots. Monocultures of the following six cover crops were included in the study: oats (‘Jerry’), cereal rye (‘Aroostook’), common medium red clover (variety not stated), Austrian winter pea (variety not stated), winter canola (‘Wichita’), and forage radish (‘Tillage Radish’). In addition, these same species were combined into two mixes of three species, one of four and one of six (Table 1). The combination of three taxonomic families (Gramineae, Leguminosae, and Brassicaceae) was expected to result in mixtures with different and complementary functional traits, leading to a suite of ecosystem services. In addition, mixtures were made up of species with different phenological niches, namely winter-killed and winter-hardy species.
Table 1 The composition and seeding rates (kg ha−1) of the 11 cover crops used in the experiment in each growing window.Footnote a , Footnote b
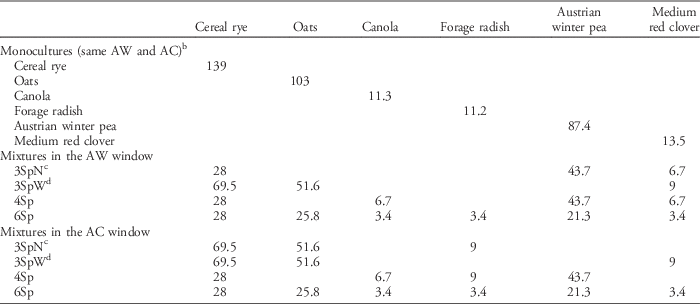
a Note that 3SpN and 4Sp differ between windows, while 3SpW and 6Sp do not.
b Abbreviations: AW, after wheat; AC, after corn; 3SpN: cereal rye, medium red clover, Austrian winter pea; 3SpW: oats, cereal rye, medium red clover; 4Sp: cereal rye, canola, medium red clover, Austrian winter pea; 6Sp: cereal rye, oats, forage radish, canola, medium red clover, Austrian winter pea.
c 3SpN: species selected to maximize nutrient cycling before corn or soybean.
d 3SpW: species selected to maximize weed control.
Monoculture seeding rates (Table 1) were based on extension recommendations (typically provided on a mass or volume basis). Seeding rates were converted to pure live seeds (PLS) m−2 using measured seed size and expected germination rate (NRCS USDA 2009) so that similar plant populations could be established each year. The composition of cover crop mixture treatments was determined based on management goals and the characteristics of the following corn or soybean crop (Table 2). Seeding rates of the species in mixture were determined based on the number of species in the mix, whether or not they typically overwinter, and the following crop, with guidance from regional cover-cropping experts and extension literature (Duiker and Curran Reference Duiker and Curran2007; Hunter et al. Reference Hunter, Roth and Frier2010; McCauley et al. Reference McCauley, Miller, Holmes, Burgess and Jones2012; D Wilson, Penn State Cooperative Extension, personal communication). Seeding rates were selected with the aim of achieving even expression of all species in each mixture. See Murrell et al. (Reference Murrell, Schipanski, Finney, Hunter, Burgess, LaChance, Baraibar, White, Mortensen and Kaye2017) for a detailed description of seeding rate selection.
Table 2 Composition of the cover crop mixtures after wheat (AW) and after corn (AC), percent of monoculture (mon.) seeding rates for each species, and rationale for each mixture.Footnote a
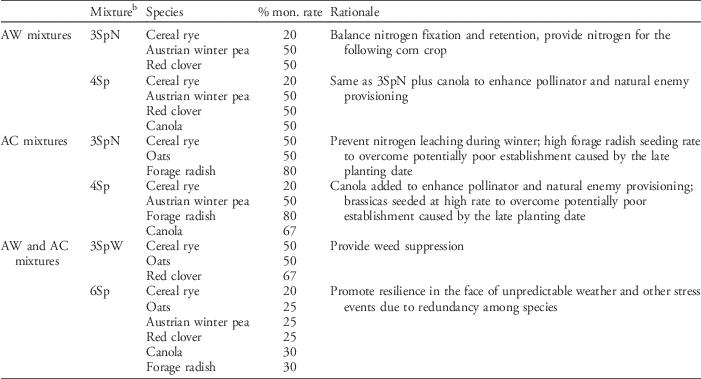
a Note that 3SpW and 6Sp were the same in both windows.
b Abbreviations: 3SpN: cereal rye, medium red clover, Austrian winter pea; 3SpW: oats, cereal rye, medium red clover; 4Sp: cereal rye, canola, medium red clover, Austrian winter pea; 6Sp: cereal rye, oats, forage radish, canola, medium red clover, Austrian winter pea.
Before cover crop seeding, the stubble from the preceding crop was incorporated with a chisel plow, followed by a tandem disk, an S-tine cultivator, and finally a cultimulcher. All cover crop treatments were drilled 2.5-cm deep in rows spaced 19 cm apart with a Great Plains drill fitted with a cone distributor to help achieve uniform within-row seed placement. Legume seeds were mixed with peat-based rhizobial inoculant before sowing. Cover crop sowing and termination dates are shown in Table 3. Although we attempted to keep sowing dates consistent across years, rainfall delayed cover crop planting in year 1 by 2 to 3 wk compared with years 2 and 3. Cover crop termination occurred in mid-May in year 1 but was moved two weeks earlier in years 2 and 3 to avoid excessive growth of cereal rye, which led to nitrogen immobilization and impacted the yield of the following corn in year 1. Cover crops were terminated with one pass of a Kuhn flail mower, then incorporated to a depth of 20 cm with a moldboard plow. The fallow no–cover crop controls were rototilled in the fall and spring to eliminate weed growth, but a 3 by 3 m area was left undisturbed to serve as a “weedy subplot.” In year 1, the weedy subplot was mistakenly tilled in the fall and so could not be used as a true control.
Table 3 Cover crop (CC) sowing date and weed and CC biomass sampling (BS) dates in each growing window.Footnote a

a CCs were terminated the day after spring BS. Year 1: fall 2012 to spring 2013; year 2: fall 2013 to spring 2014; year 3: fall 2014 to spring 2015.
Cover Crop and Weed Sampling
Peak cover crop and weed biomass were sampled annually in mid-October to early November before the first killing frost and again in May just before cover crop termination (Table 3). Weed biomass in the fall and spring was used as an indicator of cover crop weed suppression (Finney et al. Reference Finney, White and Kaye2015; Nord et al. Reference Nord, Ryan, Curran, Mortensen and Mirsky2012; Ryan et al. Reference Ryan, Mirsky, Mortensen, Teasdale and Curran2011). Biomass was destructively sampled and measured at three random points in each plot using 0.25-m2 quadrats. Fall and spring sampling locations were paired and spaced 1 m apart. In the no–cover crop control plots, a single weed biomass sample was taken in the weedy subplot area. Weed biomass in the weedy subplots was relatively uniform and greater than in the cover crop treatments, so this one sample adequately captured the relative magnitude of weed biomass and seed production in the absence of tillage and cover crops. All cover crop and weed plants were clipped at the ground surface, placed in bags, refrigerated, and sorted to species shortly after. Once sorted, the fresh biomass was placed in a drying oven at 65 C for 1 wk and then weighed. In year 3, weed seed production was estimated to provide another indicator of cover crop weed suppression. To do so, the oven-dried weed biomass was crushed and sieved and the weed seeds were counted by species.
Statistical Analysis
All data were analyzed using linear mixed models, PROC MIXED in SAS (v. 9.4, SAS Institute, Cary, NC), unless otherwise stated. Weed biomass data were analyzed by growing window (AW vs. AC), season (fall vs. spring), year, and all interactions among these factors. All two-way interactions (window*year, window*season, and year*season) were significant, so all analyses were performed for each window and season separately.
Weed Suppression by Cover Crops
Weed biomass in fall and spring was analyzed as an indicator of weed suppression. The three biomass subsamples were averaged to represent plot-level biomass. In most cases, weed biomass was first log transformed to normalize the data and ensure variances were homogeneous, though data for the fall of year 2 were square-root transformed.
Weed biomass data were analyzed according to the following cover crop categories (number of treatments within each category are given in parentheses):
-
∙ Cover crop treatment (11)
-
∙ Cover crop “family”: grasses (2), legumes (2), brassicas (2), and mixtures (4)
Fallow plots were excluded from the cover crop family analysis. In addition, since one species of each cover crop family was winter-killed (oats and forage radish in all years, and pea in years 2 and 3), cover crop family analysis was not performed on spring data. Year, cover crop category, and the interaction between year and cover crop category were treated as fixed effects, with block as a random effect. Year was treated as a fixed effect due to the nonrandom management changes imposed after year 1. When treatment effects were significant at P<0.05, comparisons were assessed using Tukey’s significance adjustment.
Weed seed production data (seeds m−2) were analyzed with a generalized linear mixed model with a Poisson distribution, using PROC GLIMMIX in SAS (v. 9.4). Cover crop treatment was used as an explanatory variable, with block as a random effect.
Mechanisms of Weed Suppression
To explore the potential mechanisms of weed suppression by different cover crops, we regressed weed biomass on total cover crop biomass by family (grasses, brassicas, legumes, and mixtures) in the fall and spring of the AW window. Additionally, to explore the contribution of the grass species to weed suppression in mixtures, we regressed weed biomass against grass biomass in the mixture. In the AC window, cover crop and weed biomass were too low for any meaningful regression in the fall, and a bimodal distribution of spring biomass did not lend itself to regression analysis. Finally, weed biomass and weed species richness data were regressed on cover crop species diversity in the fall and spring AW window.
Results and Discussion
Overall, mixtures and grass monocultures provided greater levels of weed suppression than brassica and legume monocultures, confirming our first hypothesis. Weed biomass was significantly affected by year, season, and the length of the fall growing period, so results will be presented separately for the longer fall growing period AW and the shorter fall growing period AC.
Weed Suppression by Monocultures and Mixtures in the AW Window: Fall
In the long fall growing period AW, grass monocultures (oats and cereal rye) and mixtures containing a grass cover crop were consistently more weed suppressive than brassica (tillage radish and canola) and legume (pea and medium red clover) cover crops (Table 4). Weed suppression by brassica monocultures varied across years as shown by the significant interaction of cover crop treatment and year (F=1.77, P=0.039), while the legumes were consistently the least weed-suppressive cover crops. All species, except red clover, were relatively evenly represented in the mixtures (Figure 1A; Murrell et al. Reference Murrell, Schipanski, Finney, Hunter, Burgess, LaChance, Baraibar, White, Mortensen and Kaye2017), so it was not the case that mixtures suppressed weeds because they were fully composed of one aggressive species.
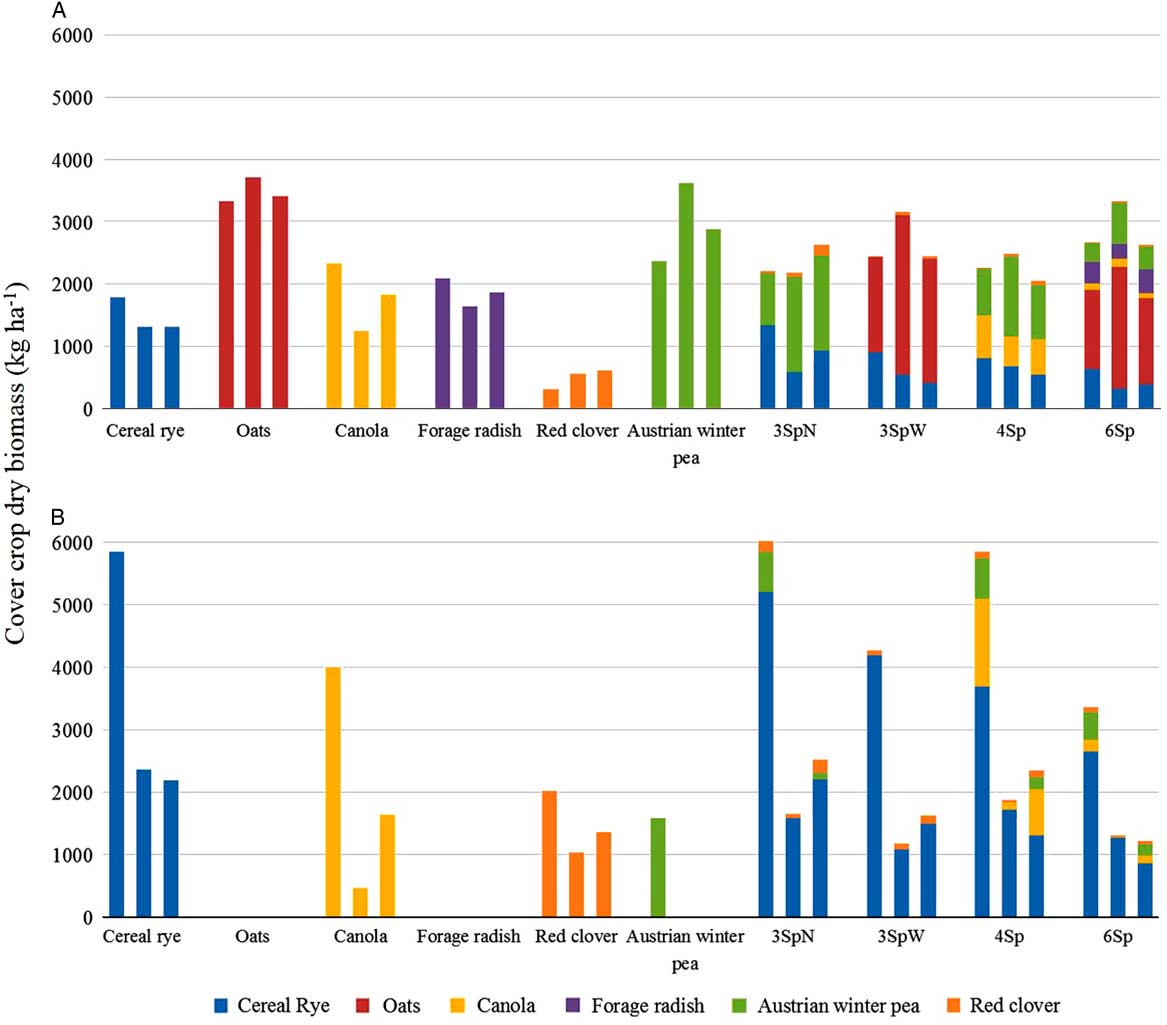
Figure 1 Cover crop aboveground biomass in the fall (A) (three bars correspond to fall of 2012, 2013, and 2014, respectively) and spring (B) (three bars correspond to spring of 2013, 2014, and 2015, respectively) of the after wheat window (adapted from Murrell et al. Reference Murrell, Schipanski, Finney, Hunter, Burgess, LaChance, Baraibar, White, Mortensen and Kaye2017).
Table 4 Mean weed biomass (kg ha−1) across all 3 yr by cover crop family in the fall of the after wheat window.Footnote a
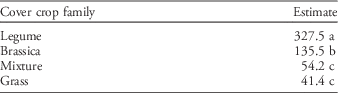
a Different letters indicate significant differences with P<0.05.
The relative performance of cover crop families was similar across years. However, interannual variability in weather and planting date exerted a strong influence on final weed biomass across cover crop treatments (Table 5A; Figure 2). On average, fall weed biomass was 39.8, 549.3, and 128.3 kg ha−1 in years 1, 2, and 3, respectively. This variability was likely due to environmental conditions that influenced cover crop and weed germination and growth. Growing degree days (GDD), precipitation and soil moisture differed across years. GDD (base temp 4.4 C) from planting to fall sampling were 1,280, 1,844, and 1,605 for years 1, 2 and 3, respectively. Rainfall during the week after cover crop planting was 2.8, 2.5, and 5.8 cm in years 1, 2, and 3, respectively. Similarly, soil moisture content 5-cm deep during the 5 d surrounding cover crop planting averaged 22.1% and 28.1% for years 2 and 3, respectively (soil moisture data for year 1 were not available). Low soil moisture content and precipitation in year 2 may have delayed cover crop germination (Wilson et al. Reference Wilson, Baker and Allan2013) and emergence, resulting in less-competitive cover crops and greater weed germination and biomass accumulation. In this year, only oats and 3SpW (which contained oats and rye) were able to limit weed biomass to below 200 kg ha−1. These results suggest that inclusion of an aggressive grass like oats in cover crop mixtures can reduce weather-related risks of weed establishment and growth in early-planted fall cover crops.
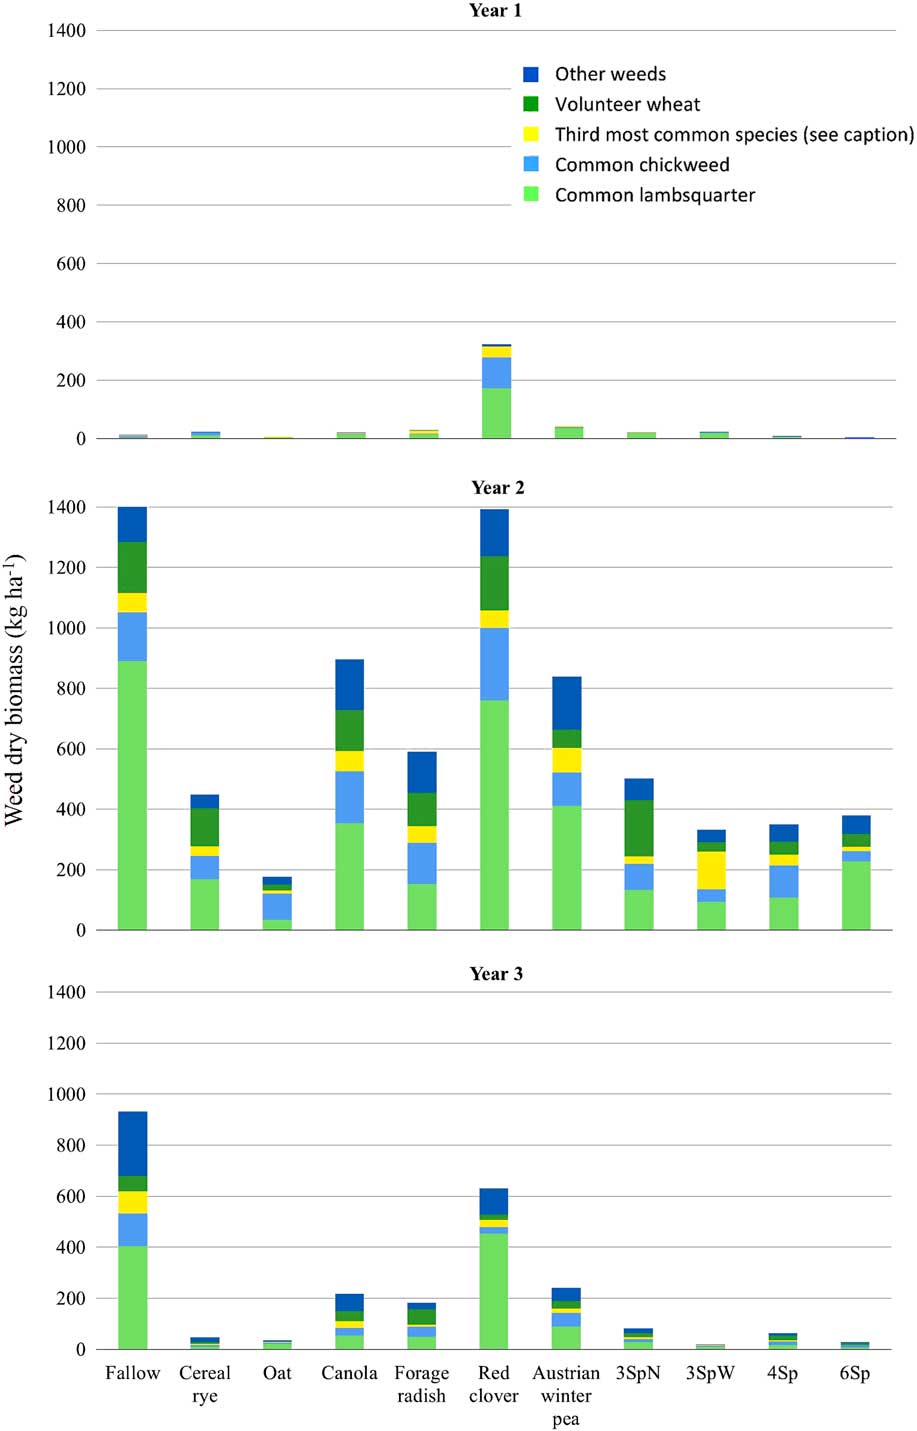
Figure 2 Weed biomass by species for each cover crop treatment in the fall of the after wheat (AW) window for the 3 yr (year 1: 2012, year 2: 2013, and year 3: 2014). Common lambsquarters (Chenopodium album L.). Third most common species noted in figure key are given here. In the fall year 1 (2012): in the fallow: henbit (Lamium amplexicaule L.); in the forage radish: fall panicum (Panicum dichotomiflorum Michx.); in 3SpW: shepherd’s purse [Capsella bursa-pastoris (L.) Medik]; and in all the other treatments: eastern black nightshade (Solanum ptychanthum Dunal). In the fall year 2 (2013): in 3SpN, 3SpW, and the fallow: witchgrass (Panicum capillare L.); in 4Sp, 6Sp, clover, and oats: Amaranthus spp.; in the forage radish, canola, and rye: eastern black nightshade; and in the pea: giant foxtail (Setaria faberi Herrm.). In the fall year 3 (2014): in the fallow, clover, and oats: henbit; in 3SpN, 4Sp, pea, and rye: giant foxtail; in 3SpW: velvetleaf (Abutilon theophrasti Medik.); in 6Sp: smooth crabgrass [Digitaria ischaemum (Schreb.) Schreb. ex Muhl.]; in the canola: common ragweed (Ambrosia artemisiifolia L.); and in the forage radish: fall panicum.
Table 5 Cover crop and weed dry matter (kg ha−1) in the after wheat window in the fall and spring of all years.Footnote a , Footnote b
a Abbreviations: 3SpN: cereal rye, medium red clover, Austrian winter pea; 3SpW: oats, cereal rye, medium red clover; 4Sp: cereal rye, canola, medium red clover, Austrian winter pea; 6Sp: cereal rye, oats, forage radish, canola, medium red clover, Austrian winter pea; Can, canola; Clov, medium red clover; Fa, fallow; Rad, forage radish; Y, year (year 1: fall 2012 to spring 2013; year 2: fall 2013 to spring 2014; year 3: fall 2014 to spring 2015).
b Different letters within a year indicate significant differences with P<0.05.
c The weedy subplot in the fallow treatment was mistakenly tilled.
Mechanisms of Weed Suppression: Cover Crop Biomass
Cover crop resource preemption is one mechanism that can drive weed suppression, and cover crop biomass is frequently used as an indicator of resource preemption (Akemo et al. Reference Akemo, Regnier and Bennett2000; Brennan and Smith Reference Brennan and Smith2005; Lawson et al. Reference Lawson, Cogger, Bary and Fortuna2015). However, in this study, brassica cover crops were the only cover crop family for which weed biomass was negatively correlated to cover crop biomass (R2= 0.40, P=0.0008). For both mixtures and grasses, weed biomass was consistently low (average of 148 and 113 kg ha−1 for the mixtures and grasses, respectively) and did not vary with cover crop biomass. Likewise, biomass of grasses in the mixtures did not explain weed biomass. There was also no relationship between weed biomass and cover crop biomass for the legume cover crops, but for the opposite reason: weed biomass was consistently high.
The differences among these responses point to important in-season weed-suppression dynamics that cannot be detected using only final cover crop biomass. Both legumes grew slowly at first, allowing substantial weed establishment and leading to the highest levels of weed biomass among all the cover crop treatments (705 and 361 kg ha−1 on average across years for clover and pea, respectively). However, medium red clover rarely produced more than 600 kg ha−1 of fall biomass, while Austrian winter pea grew quickly later in the fall and produced an average of ~3,000 kg ha−1. Therefore, weed biomass production was decoupled from legume cover crop biomass production. For the grasses, weed suppression from 1,500 kg ha−1 of final cereal rye biomass was equivalent to that from around 3,500 kg ha−1 of oat biomass (averaged across years). This suggests that weed suppression by grass species is driven by their early-season functional traits—such as rapid emergence, growth, and soil coverage—rather than the total biomass they produce (Dorn et al. Reference Dorn, Jossi and Van der Heijden2015). These results illustrate a weakness of using final cover crop biomass as a predictor of cover crop resource preemption and resulting weed suppression. Other functional traits such as early-season cover crop density or ground cover may be better predictors of weed suppression by cover crops (Lawley et al. Reference Lawley, Teasdale and Weil2012).
The fact that mixtures and grass monocultures had similar levels of weed suppression (Table 4) has important implications for the design of weed-suppressive cover crop mixtures, because it suggests that the weed-suppressive capacity of a cover crop mixture may result from the presence of one or several highly weed-suppressive species, rather than from the average behavior of all the species in the mixture (Smith et al. Reference Smith, Atwood and Warren2014). Interestingly, grass species in mixtures were seeded at rates as low as 20% of their monoculture seeding rate (e.g., in 3SpN and 4Sp; Table 1), but all mixtures had similar levels of weed suppression. These results indicate that diverse mixtures containing low seeding rates of aggressive grasses can provide sufficient weed suppression while allowing the growth of other species that may perform other important ecosystem functions. These results are in agreement with Lawson et al. (Reference Lawson, Cogger, Bary and Fortuna2015), who reported that a 25:75 mixture of cereal rye and hairy vetch suppressed weeds as effectively as a 50:50 mixture and also provided extra nitrogen for the following crop.
Mechanisms of Weed Suppression: Cover Crop Species Richness
Weed biomass decreased with increasing cover crop species richness, but species richness only explained 12% of weed biomass variability (R2=0.12, P<0.0001; Figure 3). The effect of cover crop species diversity on weed biomass may have been confounded by the presence of cereal rye in all mixtures. As a result, we are not able to directly test the applicability of the diversity-function hypothesis (Knops et al. Reference Knops, Tilman, Haddad, Naeem, Mitchell, Haarstad, Ritchie, Howe, Reich, Siemann and Groth1999; Tilman Reference Tilman1999) to weed suppression by cover crop mixtures. A more complete replacement series design would be required to tease out the effects of diversity per se. However, our results suggest that the identity and functional traits of the cover crops, both in monoculture and mixture, are important determinants of weed suppression.

Figure 3 Relationship between cover crop species richness and weed biomass (kg ha−1) in the fall of the after wheat window for the 3 yr (2012, 2013, and 2014).
Weed Suppression by Monocultures and Mixtures AW: Spring
In the spring, AW weed biomass was generally low across all treatments. This was due to winter kill of the summer-annual weed species that emerged with the fall-planted cover crop and low germination and growth of winter-annual weeds (Table 5B). As in the fall, medium red clover was consistently the weediest treatment, and cereal rye, oats, and the mixtures were the most weed-suppressive cover crops (Table 5B). Rapid cereal rye growth in the spring likely prevented weed germination and growth but also led to cereal rye dominance in the mixtures (Figure 1B). Except for in 4Sp in year 1, cereal rye accounted for at least 80% of the spring biomass of cover crop mixtures (Figure 1B). Oats winter-killed as expected, but nevertheless suppressed spring weeds effectively. The low levels of weed biomass in the standing dead oat biomass may have resulted from the high weed suppression in the fall, the substantial residues remaining in the spring, or alellopathic effects of the straw. Similarly, weed biomass in the forage radish plots, another winter-killed species, was equally low, except for year 3. Contrary to our expectations, winter hardiness may not always be a necessary trait for suppression of spring weed germination and growth.
In the spring of the third year of the study, weed seed production was measured as another indicator of weed suppression by cover crops. Weed seed production was highest in the absence of a cover crop (fallow plots), with 36,594 seeds m−2 (Table 6). Seed production in the cover crops was highest in the clover (16,083 seeds m−2); intermediate in the radish, canola, oats, and 4Sp (2,000 to 6,000 seeds m−2); and lowest in the cereal rye, pea, 3SpN, 3SpW, and 6Sp (average of 642 seeds m−2). Common chickweed [Stellaria media (L.) Vill.] was present in all treatments and accounted for 90% of the seed production, whereas the remaining 10% was composed of hairy bittercress (Cardamine hirsuta L.) and spring whitlowgrass (Draba verna L.) seed. Though these results come from just 1 yr of data and must be taken with caution, it is likely that the large reductions in weed biomass provided by the mixtures and grass monocultures substantially reduced weed seed return to the seedbank. Even the least competitive cover crop (red clover) was able to reduce weed seed production by half compared with a no–cover crop control. Together, these results suggest that cover cropping can be an important tool for managing the weed seedbank by reducing weed pressure in future cash crops and potentially decreasing the need for tillage or herbicide use (Brainard et al. Reference Brainard, Bellinder and Kumar2011).
Table 6 Mean and standard error of the mean (SEM) of weed seed production (seeds m−2) in spring of year 3 (spring 2015) in the after wheat window.Footnote a
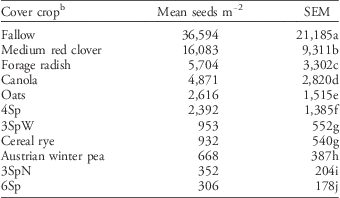
a Different letters indicate significant differences with P<0.05.
b Abbreviations: 4Sp, cereal rye, canola, medium red clover, Austrian winter pea; 3SpW, oats, cereal rye, medium red clover; 3SpN, cereal rye, medium red clover, Austrian winter pea; 6Sp, cereal rye, oats, forage radish, canola, medium red clover, Austrian winter pea.
When analyzed by cover crop treatment, spring cover crop biomass of the winter-hardy species was significantly correlated with spring weed biomass, but variance explained was only 1% (P=0.001). When analyzed by family, the results were similar to those seen for the fall. Weed biomass in the grasses (cereal rye), legumes (red clover and pea in year 1), and mixtures was not correlated to cover crop biomass, while it was for brassicas (canola) (R2=0.25, P=0.05).
Taken together, the results for the AW growing window suggest that low seeding rates of aggressive grasses in the mixtures can provide good weed suppression both in the fall and spring. This finding may enable the design of cover crop mixtures that enhance cropping system multifunctionality without jeopardizing weed management, but new strategies are needed to maintain mixture diversity in the spring. Although both oats and cereal rye allowed other species to accumulate biomass in the fall, cereal rye reduced the diversity of spring mixture biomass (Murrell et al. Reference Murrell, Schipanski, Finney, Hunter, Burgess, LaChance, Baraibar, White, Mortensen and Kaye2017). A different, less aggressive winter-hardy grass such as triticale [x Triticosecale Wittm. Ex. A. Camus (Secale x Triticum)] may ameliorate this cereal rye dominance (White et al. Reference White, Barbercheck, Dupont, Finney, Hamilton, Hartman, Hautau, Hinds, Hunter, Kaye and LaChance2015), but it may have to be coupled with an aggressive winter-killed species such as oats or forage radish to provide enough weed suppression in the fall. Further research is needed to understand the exact mechanism of weed suppression by mixtures, but early fall growth may be a more important functional trait explaining weed suppressiveness of cover crops than final cover crop biomass or winter hardiness.
Weed Suppression by Monocultures and Mixtures in the AC Window: Fall and Spring
In the short AC window, due to the late planting date, cover crop monocultures, mixtures, and weeds all failed to accumulate substantial biomass before the winter (Table 7). Only cereal rye consistently survived the winter and produced substantial spring biomass, and it accounted for 90% to 100% of the total biomass in the mixtures (Murrell et al. Reference Murrell, Schipanski, Finney, Hunter, Burgess, LaChance, Baraibar, White, Mortensen and Kaye2017). In spring, average weed biomass was greater than in the fall but was uniformly low (Table 7B). Spring weed biomass was suppressed by the presence of cereal rye and was therefore greater in the monocultures (except cereal rye) than in the mixtures.
Table 7 Cover crop and weed dry matter (kg ha−1) in the after corn window in the fall and spring of all years.Footnote a , Footnote b
a Abbreviations: 3SpN, cereal rye, oats, forage radish; 3SpW, oats, cereal rye, medium red clover; 4Sp, cereal rye, canola, forage radish, Austrian winter pea; 6Sp, cereal rye, oats, forage radish, canola, medium red clover, Austrian winter pea; Can, canola; Clov, medium red clover; Fa, fallow; Rad, forage radish; Y, year (year 1: fall 2012 to spring 2013; year 2: fall 2013 to spring 2014; year 3: fall 2014 to spring 2015).
b Different letters within a year indicate significant differences with P<0.05.
c The weedy subplot in the fallow treatment was mistakenly tilled.
Cereal rye had a strong negative effect on weed seed production. Where cereal rye was present, regardless of rye seeding rate, 3,055 seeds m−2 (standard error of the mean [SEM]=1,314) were produced on average. Weed seed rain in the pea and canola plots—which survived the winter sporadically but did not accumulate a large amount of biomass in the spring—was intermediate (7,963 seeds m−2, SEM=3,424, and 10,316 seeds m−2, SEM=4,436, respectively). In all other treatments—which are pooled here because cover crop establishment was too poor to have affected weed growth—average weed seed production was 28,588 seeds m−2 (SEM=12,292). Again, common chickweed and spring whitlowgrass were the main species producing seeds at the time of cover crop termination. Despite minimal fall weed growth in the AC window, spring weed seed production in the absence of an actively growing cover crop was large. These results suggest that it is important to establish a competitive cover crop even if the available fall growing window is short, because failing to do so may increase weed seed rain, potentially creating weed problems for future crops.
Acknowledgments
We are grateful to the entire Cover Crop Cocktails team from Penn State University and the staff of the Russell E. Larson Agricultural Research Center for planting, managing, and assisting in data collection in our experimental plots, and to many undergraduate assistants for their assistance with data collection. This project was funded by a grant from the USDA National Institute of Food and Agriculture, Organic Research and Extension Initiative (2011-51300-30638). This material is also based upon work supported by the National Science Foundation under grant no. DGE1255832. Any opinions, findings, and conclusions or recommendations expressed in this material are those of the authors and do not necessarily reflect the views of the National Science Foundation.


