Type 2 diabetes (T2D) is characterized by hyperglycemia due to impaired insulin secretion, insulin resistance in muscle and nonsuppressible hepatic glucose production (DeFronzo, Reference DeFronzo1988). Genetic factors are highly influential in the development of diabetes. The monogenic forms of diabetes are responsible for approximately 5% of cases and are caused by mutations in genes encoding insulin; the insulin receptor glucokinase; and the transcription factors hepatocyte nuclear factor-1 alpha (HNF-1alpha), HNF-1beta, HNF-4alpha, insulin promoter factor-1 and NeuroD1/BETA2 (Bell et al., Reference Bell, Pilkis, Weber and Polonsky1996; Horikawa et al., Reference Horikawa, Iwasaki, Hara, Furuta, Hinokio, Cockburn and Bell1997; Malecki et al., Reference Malecki, Jhala, Antonellis, Fields, Doria, Orban and Krolewski1999; Steiner et al., Reference Steiner, Tager, Nanjo, Chan, Rubenstein, Scriver, Beaudet, Sly and Valle1995; Stoffers et al., Reference Stoffers, Zinkin, Stanojevic, Clarke and Habener1997; Taylor, Reference Taylor, Scriver, Beaudet, Sly and Valle1995; Yamagata et al., Reference Yamagata, Furuta, Oda, Kaisaki, Menzel, Cox and Bell1996; Yamagata et al., Reference Yamagata, Oda, Kaisaki, Menzel, Furuta, Vaxillaire and Bell1996). Mutations in mitochondrial genes can cause diabetes, often in correlation with hearing loss (Maassen & Kadowaki, Reference Maassen and Kadowaki1996). Large genomewide association study (GWAS) meta-analyses have now identified over 240 less strongly penetrant risk loci (Mahajan et al., Reference Mahajan, Taliun, Thurner, Robertson, Torres, Rayner and McCarthy2018; Suzuki et al., Reference Suzuki, Akiyama, Ishigaki, Kanai, Hosoe, Shojima and Kadowaki2019), so that 18% of the total T2D heritability can be attributed to known loci. This still leaves a substantial role for other loci, particularly for Indigenous Australian populations, where there is a dearth of genetic data.
While the overall T2D prevalence among Australians over 25 years of age is considerable at 7.2% (Zimmet & Welborn, Reference Zimmet and Welborn2001), the rates are six times higher in Indigenous Australian communities (Bastian, Reference Bastian1979; Gault et al., Reference Gault, O’Dea, Rowley, McLeay and Traianedes1996). The significant prevalence of T2D and associated metabolic disturbances in Indigenous Australians are of substantial importance for study as they are major factors contributing to high morbidity and mortality in this group (O’Dea, Reference O’Dea1992). Complications of T2D, including nephropathy, retinopathy and foot ulcers, that lead to amputation are common, and the clustering of hyperglycemia with insulin resistance, elevated plasma triglyceride, low high-density lipoprotein cholesterol, hypertension and central obesity also predisposes to macrovascular disease (Guest et al., Reference Guest, O’Dea, Hopper and Larkins1993; Hayman, Reference Hayman1997; O’Dea, Reference O’Dea1991; O’Dea et al., Reference O’Dea, Lion, Lee, Traianedes, Hopper and Rae1990).
Epidemiological indications strongly implicate key genetic factors in the predisposition of groups of Indigenous Australians to T2D. A major piece of evidence for the genetic influences that underlie ethnic differences in diabetes prevalence is the inverse connection of diabetes and insulin resistance to European admixture. Among Indigenous Australian groups residing in New South Wales, diabetes was twice as common in inland towns as in coastal towns where European admixture was often present (Williams et al., Reference Williams, Moffitt, Fisher and Bashir1987), and in central Australia, glucose intolerance and 2-hour insulin levels were inversely connected with European admixture (O’Dea et al., Reference O’Dea, Patel, Kubisch, Hopper and Traianedes1993). This T2D predisposition is transmitted in a family-specific manner, rather than uniformly present in all Indigenous Australians. However, these genetic effects interact with environmental and social factors such as weight gain and low physical activity, as T2D has remained infrequent among Indigenous Australians who maintain hunter-gatherer lifestyles (O’Dea et al., Reference O’Dea, Patel, Kubisch, Hopper and Traianedes1993).
In other populations there have been breakthroughs in this field. In the Greenlandic Inuit population, a common TBC1D4 variant that confers muscle resistance and T2D (Moltke et al., Reference Moltke, Grarup, Jorgensen, Bjerregaard, Treebak, Fumagalli and Hansen2014) was recently reported. Independently within the same population, a separate signal was located in a cluster of fatty acid desaturases that determine omega-3 polyunsaturated fatty acid levels. The associated alleles modulate fatty acid composition, as well as multiple metabolic and anthropometric phenotypes, including weight and height (Fumagalli et al., Reference Fumagalli, Moltke, Garup, Racimo, Bjerregaard, Jorgensen and Neilsen2015; Garup et al., Reference Garup, Moltke, Andersen, Dalby, Vitting-Seerup, Kern and Hansen2018). In the Samoan population, a GWAS discovered a variant of CREBRF associated with obesity, which when overexpressed selectively decreased energy use and increased fat storage in an adipocyte cell model (Minster et al., Reference Minster, Hawley, Su, Sun, Kershaw, Cheng and McGarvey2016).
There are complexities involved in the mapping of diabetes susceptibility genes. Different ethnic groups have distinct population histories, and in each population, different genes are likely to be responsible for disease susceptibility. The genetic analysis of the Indigenous Australian population is likely to make a unique contribution to the understanding of diabetes susceptibility and resistance.
We previously recruited a large multigenerational pedigree of admixed Indigenous Australian descent with a high prevalence of T2D (Busfield et al., Reference Busfield, Duffy, Kesting, Walker, Lovelock, Good and Shaw2002). The pedigree consists of 232 living members, 56 of whom are affected with T2D. We conducted a genomewide scan at an average resolution of 10 cM, for T2D susceptibility genes, and undertook linkage analysis and found strong evidence for linkage to chromosome 2q24.3 with a multipoint LOD score of 3.9 < 1 cM centromeric from marker D2S2345, with a 3-LOD support interval of 18 cM. This interval does contain the known adiposity/T2D locus COBLL1 (Manning et al., Reference Manning, Hivert, Scott, Grimsby, Bouatia-Naji, Chen and Langenberg2012) and fasting glucose locus G6PC2 (Bouatia-Naji et al., Reference Bouatia-Naji, Rocheleau, Van Lommel, Lemaire, Schuit, Cavalcanti-Proenca and Froguel2008). Secondary peak two-point LOD scores on the genomewide scan were noted on chromosome 8p (LOD score 1.77 at D8S549) and chromosome 3q (LOD score 1.8 at D3S1311; Busfield et al., Reference Busfield, Duffy, Kesting, Walker, Lovelock, Good and Shaw2002). In the present article, we describe fine mapping of the 2q24.3 region, with the identification of four SNPs showing strong association with T2D, which all lie within a gene encoding ceramide synthase 6 (CerS6).
Limitations
This study is limited by its focused scope on a population of Indigenous Australians, and therefore its findings may not be applicable to broader populations with T2D. However, this research is still highly relevant for endocrine study as it provides insight into the tangible influences that genetics can have on the onset of T2D.
Methods
Subjects
We ascertained clinical details from a community of Indigenous Australian descent in North Stradbroke Island, Queensland. The pedigree consists of 232 living members, 56 of whom are affected with T2D. We have previously reported the clinical details and phenotypic characterization of this pedigree (Busfield et al., Reference Busfield, Duffy, Kesting, Walker, Lovelock, Good and Shaw2002). While it was necessary to divide the pedigree for linkage analysis in the previous article, in the present association analyses, we used the complete pedigree, usually incorporating an empirical genetic relationship matrix.
We also recruited a replication sample of 234 unrelated individuals from a number of mainland Indigenous communities in our region. These participants were all of Indigenous descent and well matched in terms of age (52.0 ± 17 pedigree vs. 51.3 ± 16 controls) and sex; 84 (36%) were individuals with T2D, further confirming the high rates of this disease in Indigenous Australians.
The study protocol was approved by the Princess Alexandra Hospital, the Prince Charles Hospital and University of Queensland Ethics Committee, and all participants provided informed consent before the study. These studies were performed after full consultation and with the approval of the Indigenous Australian communities.
SNP Mapping
Initially, 136 SNPs spanning both chromosome 2 and 3 were selected from the linkage-based minimal candidate region to have a minor allele frequency greater than 0.3 in both the African American and Caucasian populations. In the follow-up genotyping, an additional 61 SNPs for the CerS6 gene were tagged SNPs selected from the HapMap database (International HapMap Consortium (IHMC), 2005) for comprehensive coverage of the entire CerS6 locus, and included an additional 70 kbp both up- and downstream of exon 1 and exon 10, respectively. SNP genotyping was carried out at the Australian Genome Research Facility (AGRF), Brisbane, Australia using the homogenous MassExtend (hME — single base extension) assay analyzed on the Sequenom Autoflex Mass spectrometer and the Samsung 24-pin nanodispenser.
Genotype Imputation
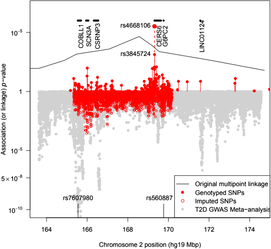
The BEAGLE 5.0 package (Browning et al., Reference Browning, Zhou and Browning2018) was used to impute ungenotyped SNPs in the 2q24 region. As this does not specifically model the pedigree relationships, the ‘best-guess’ imputed genotypes gave rise to a large number of Mendelian inconsistencies even for SNPs with a DR2 = 1, a fact that must be borne in mind when assessing results from imputed SNPs. To guard against problems, we examined genotyped and imputed genotype association results separately (see Figure 1).

Fig. 1. Plot of the –log10 p value for association of SNPs with T2D in pedigree members. Upper panel shows results for genotyped SNPs and the original multipoint linkage results converted into p values (recall linkage analysis uses a less severe multiple testing threshold). The result for rs4668106 combining the pedigree and replicate samples is labeled. The lower panel shows results for imputed SNPs, along with Fisher-combined p values from two large published GWAS meta-analyses. The position of the published T2D and FPG SNPs rs7607980 in COLBB1 and rs560887 in G6PC2 are indicated at the bottom (meta-analysis p = 10−18 and 10−128, respectively).
Mutation Screening
We sequenced all 10 exons as well as intron/exon boundaries and 600 base pairs into the putative promoter region of CERS6 to investigate a causal mutation. In brief, PCR products were initially generated from salted-out lymphocyte DNA (Miller et al., Reference Miller, Dykes and Polesky1988) of 12 individuals to represent each of the three SNP genotypes (T/T, G/T, G/G). PCR reactions contained the following reagents; 10 pmol each primer, 2.5 mM MgCl2, 0.25 mM dNTPs, 0.5 U Red Hot Taq (ABgene) and 1 × reaction buffer IV (ABgene).
PCR products were generated on a Corbett Research Palm-Cycler using the following program: 94°c for 2 mins, and 30 cycles of 94°c for 30 s, 55–72°c for 30 s, 72°c for 40 s; a final 5-min incubation took place at 72°c. PCR products were purified using centrifugation and washing through High Pure PCR gel matrix columns (Roche) and sequenced using ABI dye terminator chemistry using the standard protocol. Washed and precipitated sequence reactions were separated by the AGRF. Sequence data were analyzed using the Chromas software package. All polymorphisms identified were screened in the family members using the aforementioned method.
Statistical Analyses
The SPSS 7.0 and R statistical packages (R Core Team, 2019) were used to carry out standard descriptive and statistical analyses. We estimated the genetic ancestry of study participants using the PC-AIR (which adjusts for relatedness) and PCA packages in R (Conomos et al., Reference Conomos, Gogarten, Brown, Chen, Rice, Sofer and Yu2019) to analyze a set of microsatellite markers from our earlier study that overlapped with those used in the Human Genome Diversity Project. Allelic association analysis was carried out as a logistic mixed-model regression in the GENESIS package (Chen et al., Reference Chen, Wang, Conomos, Stilp, Li, Sofer and Lin2016; Conomos et al., Reference Conomos, Gogarten, Brown, Chen, Rice, Sofer and Yu2019), including an empirical genomic relationship matrix based on the microsatellite and SNP genotype data estimated using the Sib-pair program (Duffy, Reference Duffy1997), and with sex, age and the first principal component from the PC-AIR analysis as fixed effects. We also used MENDEL 16.0 (Lange et al., Reference Lange, Papp, Sinsheimer, Sripracha, Zhou and Sobel2013) to perform individual SNP and haplotype logistic regression-based association analysis, including birth year and sex as covariates. For the replication Indigenous sample, we compared allele frequencies of the control and affected groups using a chi-square test, then combined these data with the pedigree data and carried out a mixed-model analysis, including the sample as a stratifying variable. To identify the most strongly associated observed SNP, we carried out Bayesian model averaging (Raftery et al., Reference Raftery, Hoeting, Volinsky, Painter and Yeung2006).
Association testing of our panel of 197 SNPs in our two intervals on chromosomes 2 and 3 is equivalent to 139 independent statistical tests after adjustment for linkage disequilibrium (Moskvina & Schmidt, Reference Moskvina and Schmidt2008). A 5% experiment wide, type-1 error rate is therefore obtained by using a critical p-value threshold of .0004.
We also compared our results to those from two recently published large meta-analyses of T2D in European (Mahajan et al., Reference Mahajan, Taliun, Thurner, Robertson, Torres, Rayner and McCarthy2018) and Asian (Suzuki et al., Reference Suzuki, Akiyama, Ishigaki, Kanai, Hosoe, Shojima and Kadowaki2019) populations that have made individual SNP association results available. We combined the p values from each study for each overlapping SNP using the Fisher method.
We consulted a number of bioinformatics databases to assess the loci exhibiting association in our results, including the GTEx portal (GTEx Consortium, 2013), and the Pancreatic Islet Regulome Browser (Miguel-Escalada et al., Reference Miguel-Escalada, Bonàs-Guarch, Cebola, Ponsa-Cobas, Mendieta-Esteban, Rolando and Ferrer2018; Mularoni et al., Reference Mularoni, Ramos and Pasquali2017).
Results
The genetic principal components analysis using the previously collected microsatellite markers showed no significant differences between the ancestries of diabetic and unaffected individuals within the pedigree. Cases varied markedly from each other in their scores on the first four principal components.
We genotyped pedigree members for a total of 136 SNPs spanning both chromosomes 2 and 3. Of the 136 SNPs selected, 5 were dropped from the analysis either because of low minor allele frequency or because of Hardy-Weinberg disequilibrium suggesting additional assay problems. This analysis identified a single SNP (rs4668106) that demonstrated strong association with T2D, p = 4.3 × 10⁻⁵ (Table 1, Figure 1).
Table 1. SNPs and their association with type 2 diabetes in members of a large indigenous Australian pedigree
a Number of alleles.
b Allele 1.
c Allele 2.
d Minor allele frequency.
e Number typed.
f Degrees of freedom.
The SNPs demonstrating a statistically significant relationship are shown in bold type.
We then proceeded to screen for rs4668106 in a random unrelated cohort of 234 Indigenous Australians, 84 of whom suffered from T2D: rs4668106 showed no evidence of Hardy-Weinberg disequilibrium, while the rs4668106*T allele was shown to be associated with T2D in this cohort (p = .001; Table 2).
Table 2. Genotype frequencies for rs4668106 in original pedigree and indigenous replication sample and combined association analysis
The SNP rs4668106 is located within intron 8 of the ceramide synthase 6 gene (CERS6). An additional 61 SNPs were selected from the HapMap database (IHMC, 2005) suitable for haplotype coverage of the entire CERS6 locus, as well as approximately 70 kbp of flanking sequence. These additional SNPs were screened for association with T2D. The strongest association was found for the T allele of rs3845724 with a p value of 1.1 × 10⁻⁵, but two other SNPs rs4668102, and rs4668089 exhibited similar strength of association (p = 4.6 × 10⁻⁵, p = 1.3 × 10⁻⁵; Tables 1 and 3).There is almost perfect disequilibrium between rs4668106 and rs3845724 (Table 4).
Table 3. Frequency of top diabetes-associated SNPs

Note: P-values are in previous table.
a MGRB is the Sydney Genomics Collaborative Medical Genomics Reference Bank.
Table 4. Proportions of rs4668089-rs4668102-rs4668106-rs3845724 haplotypes in diabetic patients and unaffected individuals from this study compared with U.S. population controls

In a Bayesian model averaging analysis testing 20 SNPs (larger windows lead to numerical problems) in an interval containing the four best SNPs, the posterior probability of a nonzero log odds ratio for rs4668089 was 100%, while it was 13.6% for the next best SNP, rs4668106. The examination of the haplotypes segregating in the family found that the most common haplotype, involving the four best SNPs (TCTT), was increased in diabetics (75%) compared to nondiabetics (50%). However, haplotype was not a significantly better predictor of diabetes than rs4668089.
We tested these SNPs for association to diabetes-associated continuous phenotypes (body mass index and waist hip ratio; Figure 2). Testing the SNPs for association with fasting plasma glucose (FPG) levels indicates that the T/T allele of rs4668089 was associated with affected individuals with very elevated FPG levels. When the SNPs were tested for association with waist circumference, the best evidence for association was with rs4668102 (p = .003) (Figure 3).

Fig. 2. Relationship between rs4668089 genotype and blood glucose, body mass index and waist-to-hip ratio adjusting for age. The red curve is locally weighted regression curve for the T/T genotype, and the blue curve is for the G/T genotype.

Fig. 3. SNP genotype association with waist circumference for members of the Indigenous Australian pedigree.
On examination of the GTEX eQTL database, the best hits for rs4668106 and rs3845724 were for expression levels of G6PC2 in three tissue types: omentum, skin and tibial nerve. In each case, the common allele was associated with a 0.3 SD increase in G6PC2 transcript levels (best p value 3 × 10⁻⁷ for rs3845724 in nerve). Known regulatory variants within G6PC2 are strongly associated with FPG level (Bouatia-Naji et al., Reference Bouatia-Naji, Rocheleau, Van Lommel, Lemaire, Schuit, Cavalcanti-Proenca and Froguel2008). When we look up results for either of these SNPs in the DIAGRAM and Japan BioBank T2D GWAS meta-analyses (Mahajan et al., Reference Mahajan, Taliun, Thurner, Robertson, Torres, Rayner and McCarthy2018; Suzuki et al., Reference Suzuki, Akiyama, Ishigaki, Kanai, Hosoe, Shojima and Kadowaki2019), neither is significantly associated in those populations (all p values > .3). However, this is also the case for rs560887 in G6PC2, a SNP associated with FPG at p = 10−218 in a recent meta-analysis (Depuis et al., Reference Dupuis, Langenberg, Prokopenko, Saxena, Soranzo, Jackson and Barroso2010).
As the identified SNPs are intronic, we sequenced all coding regions of this gene to rule out coding polymorphisms in linkage disequilibrium with the SNPs. Sequence analysis of all 10 exons, 800 bp upstream of exon 1 and all intron/exon boundaries in four affected and four unaffected family members identified a number of genetic variations. These were screened in all pedigree members; however, none were found to be associated with T2D.
Discussion
We have detected association between common SNP alleles intronic to CERS6 and risk of T2D at a statistically significant level (rs4668106 unadjusted p = 3 × 10⁻⁶, adjusted for 139 effective tests p = 4.2 × 10⁻⁴). Ceramide synthase 6 (CERS6, previously known as LASS6) is one of the six members of the ceremide synthase gene family in humans. This enzyme generates C14 ceramide and C16 ceramide. CerS6-knockout mice demonstrate a significant decrease in C16-containing sphingolipids, accompanied by behavioral abnormalities, protection from high-fat-diet-induced obesity and glucose intolerance, as well as protection from colitis and neutrophil activation. Activation of CerS6 and subsequent elevation of C16- ceremide were demonstrated in response to folate stress, serum starvation, deficiency of cytochrome c oxidase and methotrexate. CerS6 is an integral membrane protein and has three domains located within the lumen of the endoplasmic reticulum, five transmembrane regions and three cytoplasmic regions. Tissue expression of human CerS6 transcripts demonstrated a wide distribution profile, with highest levels observed in transformed lymphocytes and fibroblasts, skin, small intestine, cerebellar hemisphere and frontal cortex, heart ventricle, ovary, stomach and uterus (Holmes et al., Reference Holmes, Barron and Krupenko2018). Variants in CERS6 in other populations have been associated with diabetic nephropathy, insulin resistance, lipid levels, Parkinson’s disease, TNF levels and adenocarcinoma of the lung (National Center for Biotechnology Information (NCBI), 2019). The potential role of ceramides in diabetes and its complications are of interest (Galadari et al., Reference Galadari, Rahman, Pallichankandy, Galadari and Thayyullathil2013). Ceramide serves as a hub in sphingolipid metabolism. Evidence from a plethora of studies would suggest that ceremide could play a significant role in diabetes by several different mechanisms, including inducing pancreatic beta cell apoptosis, increasing insulin resistance and reducing insulin gene expression.
Two major hypotheses have been proposed to explain how increased adipose stores affect overall insulin resistance leading to T2D. First, when adipocytes exceed their storage capacity, fat begins to accumulate in other tissues leading to the production of metabolites that inhibit insulin signal transduction. Second, obesity triggers a chronic inflammatory state, and cytokines released from either adipocytes or macrophages infiltrate tissue and antagonize insulin action. The sphingolipid ceramide is a putative intermediate linking both excess nutrients (i.e. saturated fatty acids) and inflammatory cytokines (e.g. tumor necrosis factor alpha) to the induction of insulin resistance. Moreover, ceramide has been shown to be toxic in a variety of different cell types, including pancreatic beta cell, suggesting a possible pathway leading to the beta cell dysfunction seen in T2D. Ceramides have been shown to function as a second messenger in a variety of cellular events, including apoptosis and differentiation. Ceramides have the ability to regulate Akt/protein kinase B (PKB), which has been shown to promote the uptake of glucose, lipid and amino acids in various storage tissues. In both skeletal muscle and adipose tissue, Akt/PKB stimulates the translocation of an insulin-stimulated glucose uptake transporter (GLUT4) from the plasma to the cell membrane, thereby facilitating the increased rate of glucose into the tissue. Studies have reported that ceramide inhibits insulin-stimulated glucose uptake, GLUT4 translocation and glycogen synthesis; however, the precise mechanisms remain unclear. Increased CerS6 expression has been associated with the glucose intolerance and hepatic insulin resistance associated with hypercortisolism (NCBI, 2019). Short, as well as long, incubation with palmitate resulted in increased accumulation of ceremide in rat hepatocytes, which caused insulin resistance (Konstantynowicz-Nowicka et al., Reference Konstantynowicz-Nowicka, Harasim, Baranowski and Chabowski2015). We conclude that further research is indicated to functionally analyze the potential role of CerS6 in the pathogenesis and pathophysiology of T2D.
After highlighting CERS6, we also note that rs4668106 and rs3845724 genotypes are both suggestively related to expression of G6PC2. The glucose-6-phosphatase catalytic subunit 2 (also known as IGRP) is a pancreatic islet specific component of a complex that hydrolyses glucose-6-phosphate. In type 1 diabetes, the protein is an important autoantigen, but more critically in the current setting, variants in this gene are strongly associated with FPG levels, with the C allele of the known regulatory SNP rs560887 increasing FPG by 0.075 mmol/l (Baerenwald et al., Reference Baerenwald, Bonnefond, Bouatia-Naji, Flemming, Umunakwe, Oeser and O’Brien2013). G6PC2 lies 100 kbp telomeric to CERS6, and we are increasingly aware that regulatory SNPs can be at such distances from the target; for example, FTO SNPs and IRX3 expression. The Islet Regulome Browser (Mularoni et al., Reference Mularoni, Ramos and Pasquali2017; Miguel-Escalada et al., Reference Miguel-Escalada, Bonàs-Guarch, Cebola, Ponsa-Cobas, Mendieta-Esteban, Rolando and Ferrer2018) Hi-C experiment shows ‘high-confidence’ evidence of a chromatin interaction between the region of CERS6 close to our association peak with a strong enhancer region of G6PC2 (Figure 4).

Fig. 4. The plot from Islet Regulome Browser (http://www.isletregulome.org) showing Virtual 4C estimates for interaction between ‘bait’ region on G6PC2 and distal CERS6/CERS6-AS1. The chromatin interaction map is constructed from promoter capture HiC data (four human islet samples) centered on the queried bait region, hence, virtual 4C. A CHiCAGO score >5 is a high-confidence interaction (Miguel-Escalada et al., Reference Miguel-Escalada, Bonàs-Guarch, Cebola, Ponsa-Cobas, Mendieta-Esteban, Rolando and Ferrer2018).
In conclusion, this study demonstrates a strong association between noncoding variants in the CERS6 gene on chromosome 2q24.3 and T2D in a large Indigenous Australian pedigree and in a population of unrelated Indigenous Australian subjects. This finding highlights a potentially significant role of this gene in the development of T2D in this population.
Acknowledgements
We are grateful to the people who participated in the research program, which would not have been possible without the commitment and enthusiasm of the friends and staff of the Yulu-Burri-Ba health centre, North Stradbroke Island Queensland, Cherbourg Community health Centre and the Beaudesert community. This work was funded by an NHMRC Project Grant, by the Princess Alexandra Hospital Research and Development Foundation, by the Lions Medical Research Foundation, by the Novo Nordisk Regional Diabetes Support Scheme, by the Australian Government’s Cooperative Research Centre for the Discovery of Genes for Common Human Diseases, by National Health and Medical Research Council of Australia (NHMRC) grants, the National Institute of Health (NIH) and the Prince Charles Hospital Foundation. Special thanks are extended to Mrs. Chryssa Aroney for her generous donation. In recognition of the support of the Sylvia and Charles Viertel Charitable Foundation. This paper is dedicated to the memory of Professor Robert Turner.