


Scientific investigations aimed at disentangling the contribution of genetic factors underlying complex and polygenic traits have demonstrated the necessity of large sample sizes (Evangelou et al., Reference Evangelou, Warren, Mosen-Ansorena, Mifsud, Pazoki, Gao and Million Veteran2018; Wray et al., Reference Wray, Ripke, Mattheisen, Trzaskowski, Byrne and Abdellaoui2018). Only when sample sizes are vast is it possible to estimate the contribution of each locus influencing a complex trait (Tam et al., Reference Tam, Patel, Turcotte, Bosse, Pare and Meyre2019; Visscher et al., Reference Visscher, Brown, McCarthy and Yang2012, Reference Visscher, Wray, Zhang, Sklar, McCarthy, Brown and Yang2017). It is both difficult and financially challenging for a single site to accrue large enough sample sizes to achieve adequate statistical power. Therefore, one pragmatic approach for obtaining the large number of samples required is to aggregate samples collected by different groups, either through meta- or mega-analysis. Currently, twin registers from around the world routinely employ this strategy for genotypic and phenotypic data (Silventoinen et al., Reference Silventoinen, Jelenkovic, Sund, Honda, Aaltonen, Yokoyama and Kaprio2015, Reference Silventoinen, Jelenkovic, Sund, Hur, Yokoyama, Honda and Kaprio2016). This approach is powerful if genetic heterogeneity (e.g., as a result of dissimilar population ancestry and demographic histories) is not an issue or is appropriately accounted for. Here, we explore the degree of genetic similarity between multiple twin cohorts and indicate whether it is appropriate to combine data from these cohorts for joint-genetic analysis.
In 2006, a study by Sullivan et al. (2006) empirically showed that samples from Australian and Netherlands Twin Registers can be reasonably combined for joint-genetic analyses by estimating the proportion of total genetic variability attributable to genetic difference between cohorts (Sullivan et al., Reference Sullivan, Montgomery, Hottenga, Wray, Boomsma and Martin2006). The calculation of the genetic variability attributable to genetic differences between cohorts, measured by Wright’s fixation index (F ST value), was estimated using analysis of molecular variance on 359 short tandem repeat polymorphism markers. The estimated F ST between Australian (N = 519) and the Netherlands (N = 549) was found to be 0.30%, a value smaller than between many other European groups. The F ST estimates suggested that it is reasonable to combine samples from Australian and Dutch cohorts but admittedly based on calculations in samples of modest size. Here, we evaluate the genetic similarity in larger number of samples and augment the comparison by adding a third cohort of samples obtained from the Avera Twin Register (ATR), a representative population sampling of the Midwestern region of the USA. In this study, we test the genetic variation within and between three populations of interest — Australian, Dutch and Midwestern American — by employing genomic data from a custom-designed genome-wide single nucleotide polymorphism (SNP) array. To further explore the genetic similarity across the cohorts under study, we incorporated genetic data from a globally and genetically distinct population — samples from Nigeria genotyped on the Global Screening Array (GSA) at the Avera Institute for Human Genetics (AIHG).
In collaboration with the Netherlands Twin Register (Boomsma et al., Reference Boomsma, Vink, van Beijsterveldt, de Geus, Beem, Mulder and van Baal2002, Reference Boomsma, de Geus, Vink, Stubbe, Distel, Hottenga and Willemsen2006; Willemsen et al., Reference Willemsen, de Geus, Bartels, van Beijsterveldt, Brooks, Estourgie-van Burk and Boomsma2010, Reference Willemsen, Vink, Abdellaoui, den Braber, van Beek, Draisma and Boomsma2013), the AIHG (Sioux Falls, SD, USA) created the ATR in May 2016 (Kittelsrud et al., Reference Kittelsrud, Ehli, Petersen, Jung, Willemsen, Boomsma and Davies2017). The goal of the ATR is to study the genetic and environmental influences on health, disease and complex traits by harnessing the power of longitudinal biological sample collection and survey correspondence. Participants have enrolled from across all regions of the USA, the great majority coming from Midwestern states, including South Dakota, North Dakota, Minnesota, Iowa and Nebraska. In addition to serving as a prime research model for studying health and disease in a regional setting, another important role of the ATR is to contribute to consortia-driven large-scale genetic studies focusing on the genetic underpinnings of complex traits. Therefore, it is of interest to recognize the degree of genetic similarity between the Midwestern Americans comprising the ATR and the cohorts for which the genetic data are to be combined.
As long-established twin registers, the Netherlands and Australian Twin Registers have served as models for newly formed twin registers from around the world. As is the case for the ATR, the Netherlands and the Australian twin registers are population based with recruitment focused on the presence of twins or higher-order multiples in the family. Through this collaborative initiative, we included 100 saliva samples from Nigerian mothers of twins to use as a genetic contrast group to the Australian, Dutch and Midwestern American populations. Incorporation of genetically distinct samples further enhances the cross-ethnic comparisons that we describe here.
The AIHG recently joined the Illumina-initiated GSA consortium. Broadly, the goal of the consortium is to enable a variety of genotyping applications for biobanks, disease research, translational research, consumer genomics and population genetic studies. Specifically, the GSA has been optimized for high-throughput population-scale studies at lower cost than previous genotyping platforms. Participation of the AIHG in the GSA consortium has allowed for the unique opportunity to design a customized high-density SNP genotyping microarray. A similar strategy for designing population-specific arrays for genome-wide association (GWA) testing has already been described, albeit for a different genotyping platform (Ehli et al., Reference Ehli, Abdellaoui, Fedko, Grieser, Nohzadeh-Malakshah, Willemsen and Hottenga2017).
Here, we report on the design and initial validation of the array, as assessed by the evaluation of concordance, coverage and imputation quality of the core backbone against the Genome of the Netherlands (GoNL) reference set (Boomsma et al., Reference Boomsma, Wijmenga, Slagboom, Swertz, Karssen, Abdellaoui and van Duijn2014; Genome of the Netherlands Consortium, 2014). Additionally, we provide evidence to suggest that the custom-selected content generally enhances imputation quality and provides robust genotype calls for population- and disease-relevant SNPs. Furthermore, we demonstrate that the GSA can be utilized for the generation of high-quality SNP data from multiple tissue sources, namely blood, buccal epithelial brushings and saliva.
With high-density SNP genotype data obtained from the GSA run at AIHG, we assessed the level of genetic similarity across population cohorts of interest: Australian, Dutch and Midwestern American. To facilitate the assessment of population genetic structure, we leveraged the power of state-of-the-art software capable of ingesting genome-wide SNP data obtained from the GSA. Population genetic variation was summarized by uncorrelated principal components (PCs) through principal component analysis (PCA) and estimations of F ST values. Furthermore, we projected the PCs estimated from the samples onto data from the Human Genome Diversity Project (HGDP; Cann et al., Reference Cann, de Toma, Cazes, Legrand, Morel, Piouffre and Cavalli-Sforza2002). Projection of calculated PCs onto the diverse populations comprising the HGDP fostered a global illustration of genetic relatedness between the populations of interest.
Materials and Methods
Participants and Sample Collection
Australian subjects were from the QIMR Berghofer Medical Research Institute (N = 1922; Hopper, Reference Hopper2002, Reference Hopper, Treloar, de Klerk and Morley2006). Other subjects were registered participants of the Netherlands (NTR, N = 10,226; Boomsma et al., Reference Boomsma, de Geus, Vink, Stubbe, Distel, Hottenga and Willemsen2006) and Avera (ATR, Sioux Falls, SD, USA, N = 602; Kittelsrud et al., Reference Kittelsrud, Ehli, Petersen, Jung, Willemsen, Boomsma and Davies2017) Twin Registers, and the Nigerian Twin and Sibling Registry (NTSR, N = 100; Hur et al., Reference Hur, Kim, Chung, Shin, Jeong and Auta2013; see Table 1).
Table 1. Characteristics of samples genotyped on GSA per cohort and tissue

GSA = Global Screening Array; NTR = Netherland’s Twin Register; N = number of samples; MZ = monozygotic twins; DZ = dizygotic twins; MODZT = mothers of DZ twins; MOSDZ = mothers of opposite-sex dizygotic twins; sibs = siblings; parents = parents of twins.
a Percentage of female samples is reported from the unrelated set.
Representative samples of the Midwestern American population were obtained from the ATR. Enrolled participants include twins, multiples, siblings and their parents. Participants complete surveys and questionnaires and provide a cheek swab (buccal brushing) for zygosity testing and genotyping. The majority of the enrolled participants are located in the Midwestern region of the USA, with most being from South Dakota, Minnesota and Iowa.
Samples from the QIMR Berghofer Medical Research Institute (Australia) are a combination of a number of different studies, conducted in many countries over many decades, focused on the genetics of dizygotic twinning (Painter et al., Reference Painter, Willemsen, Nyholt, Hoekstra, Duffy, Henders and Montgomery2010). Samples from mothers of dizygotic twins (MODZT) were collected from Australia and New Zealand and were shipped to the AIHG for genotyping on the GSA regardless of whether they were ungenotyped or previously genotyped on an earlier SNP array. Included in the shipment were two small cohorts of special interest: (1) a Belgian sample of 40 MODZT from 14 multiplex families collected in the 1990s; (2) a sample of 10 MODZT from two multiplex families from the Utah Mormon Database collected in 1994. For the purposes of the study presented here, samples from Belgium and Utah were excluded from the Australian cohort.
The Nigerian sample in the present study was drawn from the NTSR, which included over 3000 adolescent monozygotic and dizygotic twins, their parents and siblings, collected mainly from public schools in Lagos State and Abuja, Federal Capital Territory in Nigeria. Participants of the NTSR completed questionnaires and provided saliva or buccal samples for genotyping. The sample used in the present study consisted of 100 mothers of opposite-sex twins attending public schools in Lagos State, collected for the purpose of a pilot study to understand the genetic underpinnings of dizygotic twinning. Lagos State is located in the southwestern geopolitical zone of Nigeria and one of the most populous urban areas in Nigeria. Although residents of Lagos State are ethnically diverse, they are mainly members of the Yoruba group.
Participants from the NTR included twins, their parents and other relatives (mainly siblings of twins). NTR participants take part in survey and other research projects and provided blood or buccal samples for DNA isolation and genotyping.
DNA Extraction and Genotyping
DNA was isolated from whole blood, buccal epithelial cells (Min et al., Reference Min, Lakenberg, Bakker-Verweij, Suchiman, Boomsma, Slagboom and Meulenbelt2006) and saliva using standard protocols for downstream SNP genotyping. High-density SNP genotyping for all samples was done at the AIHG using a custom-designed Illumina GSA according to the manufacturer’s protocol.
Design of a Customized Genotyping Array and Generation of Genotype Data
The GSA employed for this study was designed following a previously defined strategy for designing population-specific customized genotyping arrays (Ehli et al., Reference Ehli, Abdellaoui, Fedko, Grieser, Nohzadeh-Malakshah, Willemsen and Hottenga2017). Specifically, the GSA was custom designed to contain a core imputation backbone (approximately 660,000 markers) based on commonly utilized reference panels, such as the GoNL (Boomsma et al., Reference Boomsma, Wijmenga, Slagboom, Swertz, Karssen, Abdellaoui and van Duijn2014) and the 1000 Genomes Project (Genomes Project Consortium et al., Reference Auton, Brooks, Durbin, Garrison, Kang and Abecasis2015). In addition to the core backbone, the array includes approximately 30,000 additional markers for fine mapping to further enhance imputation quality, and 8000 markers of interest associated with a variety of conditions, disorders and traits, including neuropsychiatric disorders, drug metabolism, fertility and twinning (Table 2). In total, the GSA contains 697,486 markers.
Table 2. Content and marker selection categories of the custom-designed Illumina GSA

GSA = Global Screening Array; ADME = absorption, distribution, metabolism, excretion; BMI = body mass index; ClinVar = NCBI archive for interpretations of clinical significance of genetic variants; MHC = major histocompatibility complex; PAR = pseudoautosomal region.
Prior to design of the array, initial validation of the GSA content for imputation was assessed by checking concordance, coverage and imputation quality using an extracted subset of markers resembling the GSA (683,937 markers). In brief, a dataset mimicking the content on the GSA was curated from 249 unrelated female individuals of the GoNL project. Males from the GoNL were excluded as the tools used for assessment of genotyping array coverage could not properly handle a homozygous X chromosome. GSA-mimicked markers were quality controlled and retained if minor allele frequency (MAF) was >0.01, missingness per individual was <10%, missingness per SNP was <5% and if there was no statistically significant deviation from Hardy–Weinberg equilibrium (p > 10−5). Quality control and filtering reduced the number of markers to 617,340. Extracted and quality-controlled markers were then selected if they were present in the 1000 Genomes (1000G) reference panel (Genomes Project Consortium et al., Reference Auton, Brooks, Durbin, Garrison, Kang and Abecasis2015; 616,961 markers). The extracted set was phased with SHAPEIT (Delaneau et al., Reference Delaneau, Marchini and Zagury2011) and imputed against the 1000G reference panel phase 3 using IMPUTE2 (Howie et al., Reference Howie, Donnelly and Marchini2009). For the ~12.1 million overlapping markers, concordance was calculated in PLINK (Chang et al., Reference Chang, Chow, Tellier, Vattikuti, Purcell and Lee2015; Purcell et al., Reference Purcell, Neale, Todd-Brown, Thomas, Ferreira, Bender and Sham2007) by comparing the 1000G best-guess genotypes to the original GoNL genotypes.
Genotype calls from the GSA were made using Illumina GenomeStudio2.0 and custom-curated cluster files. In short, cluster positions were defined using genotype data on 1254 samples run on GSA at AIHG by a variety of technicians and across many batches (i.e., reagent and bead-chip lots) so as to account for as much sample variation as possible. Initial assessment of sample-dependent and sample-independent controls, preliminary call rates and percentile distributions of GenCall scores (a quality metric indicating the reliability of genotype calls) yielded a final sample set of 1199 samples for defining cluster positions. Samples were grouped into males and females so that Y chromosome (1480 markers) and X chromosome (17,880) clusters could be generated using subsamples of the appropriate sex. Due to the behavior of the GenomeStudio clustering algorithm, only male samples were used for defining Y chromosome clusters. Similarly, only female samples were used for generating X chromosome clusters since males are not expected to be heterozygotes for X-linked markers. Therefore, X and Y markers were clustered and evaluated taking gender into account. All samples were used to cluster autosomal SNPs (670,744 markers), including XY, and mitochondrial markers.
Following initial clustering, cluster positions were evaluated and edited based on sequential assessment of several cluster metrics. Cluster positions were zeroed (resulting in no genotype calls for a locus) based on low cluster separation (≤0.27), low call frequency (<0.96), low mean normalized intensity values for the heterozygote genotypes (≤0.2), extreme mean normalized theta values of the heterozygote cluster (<0.2 or >0.825), Mendelian inconsistencies, ambiguous clusters, excessive numbers of reproducibility errors and excessive heterozygote calls relative to expectations based on Hardy–Weinberg equilibrium (>0.2). Markers on X and Y chromosomes were manually evaluated and edited on a per-marker basis.
Data Management, Quality Control and Relationship Inference
Individual samples were removed if they had a missing rate greater than 10% or excess genome-wide inbreeding levels/heterozygosity (as calculated in PLINK, F coefficient <−0.10 or >0.10). Reported sex was compared with inferred sex from the genotype data. Sex mismatches were investigated, resolved and subsequently replaced in the dataset.
From each population sample, we selected the largest group of unrelated individuals (Table 1). Unrelated individuals were identified with KING software (Manichaikul et al., Reference Manichaikul, Palmas, Rodriguez, Peralta, Divers, Guo and Mychaleckyj2012) using the ‘–unrelated’ option. In brief, related individuals (estimated kinship coefficient <0.088) were clustered into families. Within each connected group, individuals were ranked according to the count of unrelated family members, corresponding to an estimated kinship coefficient <0.022. A set of unrelated individuals was then made by selecting the individuals with the largest count of unrelated individuals within the respective family group. Additional unrelated individuals were obtained by taking the individuals with the next most unrelated family members, only if that individual was not related to any of the previously selected unrelated individuals. The final selection contained no pairs of individuals with a first- or second-degree relationship, reducing the sample size to 7921 subjects. Following quality control, the number of samples was reduced to 7782.
SNP Quality Control and 1000G Alignment
All autosomal SNPs that passed quality control and filtering were analyzed. PLINK was used to perform quality control. A selection of highly performing markers (N = 564,020) was used for subsequent quality control and analyses. Specifically, SNPs were removed if they were not in the 1000G reference panel (phase 3 version 5) or if they were palindromic SNPs with an allele frequency of 0.40–0.60. Polymorphic SNPs with more than two alleles were also excluded. SNP marker names were adjusted for congruity with 1000G, and strand flip issues were resolved. SNPs were removed if their call rate was less than 95% and if they differed significantly from Hardy–Weinberg equilibrium (p value < 10−5).
Principal Component Analysis
PCA was performed with smartpca of the EIGENSOFT package (Price et al., Reference Price, Patterson, Plenge, Weinblatt, Shadick and Reich2006) with its default parameter settings. PCA was used to compute 10 PCs for the populations under study. Initial ancestry outliers were determined by merging each independent dataset with 1000G data to project ethnicity with smartpca. Ancestry outliers, based on being non-European ancestry, were visually identified and subsequently removed.
Cleaned and 1000G aligned data for each population were filtered to retain SNPs having a MAF > 0.05, linkage disequilibrium (LD) pruned and filtered to exclude confounding SNPs in long-range LD, as previously described (Abdellaoui et al., Reference Abdellaoui, Hottenga, de Knijff, Nivard, Xiao, Scheet and Boomsma2013; Price et al., Reference Price, Weale, Patterson, Myers, Need, Shianna and Reich2008). Filtering and exclusion of long-range LD regions reduced the number of autosomal SNPs from 564,020 to 109,702 SNPs. This number of SNPs was used for comparisons between samples genotyped on GSA, namely those from the Australian, Midwestern American, Dutch and Nigerian cohorts.
We also calculated whether there were statistically significant pairwise differences between the Australian, Dutch and Midwestern American populations and representative European populations from the HGDP using smartpca. For each pair of populations, ANOVA statistics along each eigenvector were summed across all 10 eigenvectors.
HGDP Data Management and Projection
To establish genetic similarity on a global scale, PCs of the Australian, Dutch, Midwestern American and Nigerian populations were projected onto samples obtained from the HGDP (Cann et al., Reference Cann, de Toma, Cazes, Legrand, Morel, Piouffre and Cavalli-Sforza2002; Rosenberg, Reference Rosenberg2006). The HGDP data comprise genotypes (660,918 SNPs) from 1043 fully consenting individuals representing 54 global populations from Sub-Saharan Africa, North Africa, Europe, the Middle East, Central and South Asia, East Asia, Oceania and the Americas and provide a representative sampling of worldwide genetic variation (available at https://www.hagsc.org/hgdp/files.html).
Raw genetic data from the HGDP (sample call rate >98.5%) were reformatted for PLINK using command line tools. Markers with greater than 5% missingness were removed. Following the same procedures as previously described, unrelated individuals were identified in the HGDP dataset and retained using the program KING. Removal of related individuals reduced the sample size from 1043 to 857. To be consistent with GSA, HGDP data were converted from Build 36.1 coordinates to Build 37/hg19 using University of California, Santa Cruz (UCSC’s) batch coordinate conversion tool, liftOver (Haeussler et al., Reference Haeussler, Zweig, Tyner, Speir, Rosenbloom, Raney and Kent2019; Kent et al., Reference Kent, Sugnet, Furey, Roskin, Pringle, Zahler and Haussler2002). Overlapping markers between HGDP and GSA (prior to MAF filter, LD pruning and exclusion of long-range LD) were identified in the variant information files (.map) using R (R Core Team, 2018). Of the 133,833 common markers between the datasets, there were 21,667 multi-allelic variants due to strand inconsistencies. Strand flips were resolved and data from the HGDP were merged with cleaned and filtered GSA data using PLINK. The merged set was filtered to remove markers with a MAF < 0.05, pruned for LD and excluded SNPs in long-range LD. Quality control and filtering reduced the final number of markers to 54,820.
Ten PCs were calculated using smartpca within EIGENSOFT with default parameters. All HGDP populations were specified as reference populations for the PC projection.
Case-Control GWA Study
We performed case-control GWA study (GWAS) between the Midwestern American, Australian and Dutch populations to gain insight into the degree of genetic relatedness between them. To avoid false positives, we excluded variants with a MAF < 0.10 in the quality-controlled and filtered data on unrelated individuals. Simple association testing was done in PLINK with the ‘--assoc’ command. Two GWASs were performed, both with the Midwestern American population defined as cases and with Dutch and Australian samples serving as controls. Manhattan plots and quantile–quantile (QQ) plots were created to visualize regions of the genome that appeared statistically significant.
Calculation of FST Estimates
To quantify measures of structure in populations, we estimated F ST values between the Midwest American, Australian, Dutch and Nigerian cohorts. Weir and Cockerham (Reference Weir and Cockerham1984) and Hudson et al. (Reference Hudson, Slatkin and Maddison1992) estimators were calculated using two different software programs: popstats (Skoglund et al., Reference Skoglund, Mallick, Bortolini, Chennagiri, Hunemeier, Petzl-Erler and Reich2015) and scikit-allel (Miles Reference Miles and Harding2018), implemented in Python.
Results
Validation of the GSA
Imputation quality metrics, quantified by R 2 values, are presented in Table 3. For all 1000G imputed autosomal SNPs, including those present in African and Asian populations, the median R 2 values for the GSA are 0.02 for MAF > 0.000–0.001, 0.69 for MAF > 0.001–0.01, 0.97 for MAF > 0.01–0.05 and 0.99 for MAF > 0.05. For the selection of autosomal SNPs that were present in both the GoNL and 1000G reference data, indicative of true genetic variants in the Dutch population, the results demonstrate improved imputation quality compared to all SNPs present in 1000G. The median R 2 values of the SNPs in the GoNL and 1000G reference set are 0.04 for MAF > 0.000–0.001, 0.80 for MAF > 0.001–0.01, 0.97 for MAF > 0.01–0.05 and 0.99 for MAF > 0.05. Here, the improved imputation quality, captured by both median and mean scores, is mainly the result of the exclusion of a large number of rare SNPs (i.e., SNPs in African and Asian populations — captured by the full 1000G set), which are likely absent from the Dutch population.
Table 3. Imputation quality metrics per minor allele frequency bin for the GSA

GSA = Global Screening Array; Chr = chromosome; MAF = minor allele frequency; N SNPs = number of SNPs; SD = standard deviation; GoNL = Genome of the Netherlands.
a Denotes full 1000G imputation with Asian/African/other SNPs not present in the Dutch population.
b Denotes overlapping SNPs between GoNL and 1000G. All monomorphic SNPs were excluded, thus only polymorphic SNPs were selected for each comparison.
Concordance of the genotyped GoNL SNPs that were reimputed with a 1000G imputation reference panel was high for most SNPs in the genome, as can be seen in Table 4. In the imputed data, of the 12,074,470 polymorphic variants with a MAF > 0, up to 62.2% can be reimputed with very high quality. At lower levels of quality (below 80% concordant), 1.95% of the genome is not well covered.
Table 4. Genotype concordance metrics for GSA-mimicked, genotyped GoNL SNPs that were reimputed with 1000G reference panel

Note: Total number of 1000G SNPs that were reimputed, polymorphic and present in GoNL = 12,074,470.
GSA = Global Screening Array; GoNL = Genome of the Netherlands; N SNPs = number of SNPs.
Principal Component Analysis
We performed fine-scale PCA of unrelated subjects from the Australian, Dutch and Midwestern American populations to investigate the degree of genetic relatedness of these populations independent of other global populations. The PCA utilized 109,702 autosomal SNPs after stringent quality control, filtering, pruning and exclusion of long-range LD regions. As seen in Figure 1, results of the PCA suggest that the Midwest American, Australian and Dutch populations are not genetically distinct from one another since the clusters moderately overlap. The Midwest American cluster partially superimposes both Australian and Dutch clusters, which themselves also show a small degree of overlap. Visualization of PCs from the PCA on the Australian, Dutch and Midwestern Americans demonstrates commonality of population clusters, thereby suggesting a high degree of genetic similarity between these populations.
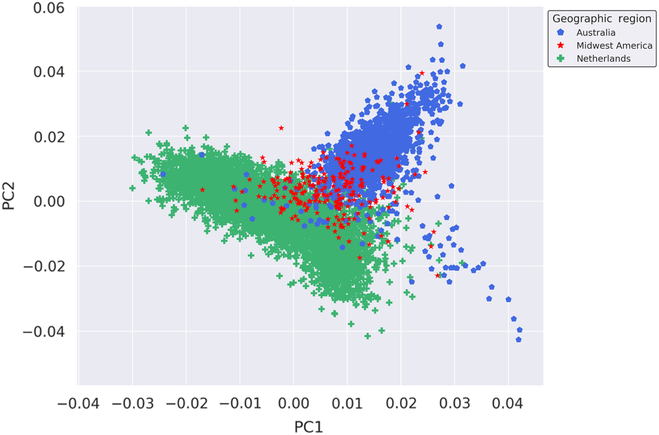
Fig. 1. Genetic ancestry of Midwestern American, Australian and Dutch subjects. Shown are the results from PCA using autosomal genotyped SNPs after quality control, filtering, pruning and exclusion of long-range LD (109,702 markers). Ancestry outliers were removed prior to performing PCA. PC1 and PC2 represent the first and second PCs and account for 18.864% and 11.919% of the variation, respectively.
Provided the unique opportunity to genotype Nigerian mothers of twins on the GSA, a PCA was performed with the inclusion of these globally distinct samples to serve as a genetic contrast group to the populations under study. Thus, to enhance the investigation of the genetic similarity of the Australian, Dutch and Midwestern American populations on a broader scale, we performed a PCA on all samples genotyped on GSA at AIHG, including those from Nigeria. The results of the PCA are depicted in Figure 2. Inclusion of a geographically and genetically distant population resulted in distinct separation of European-ancestry-based populations and the Nigerian cohort, indicative of population stratification and genetic dissimilarities.
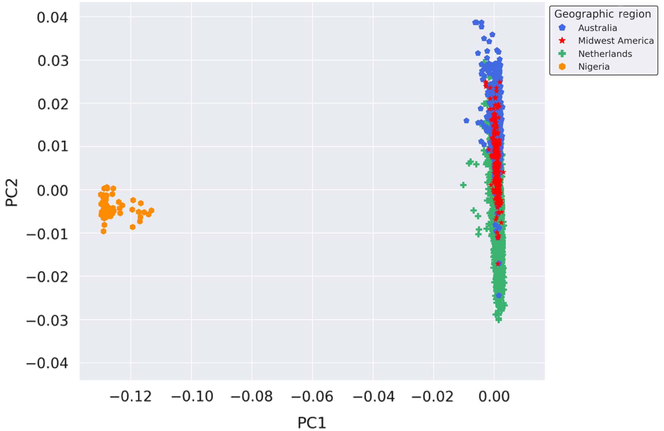
Fig. 2. Genetic ancestry of Midwestern American, Australian, Dutch and Nigerian subjects. Shown are the results from the PCA using all autosomal genotyped SNPs after quality control, filtering, pruning and exclusion of long-range LD (109,702 markers). Ancestry outliers were removed prior to performing PCA. PC1 and PC2 represent the first and second PCs and account for 67.765% and 6.568% of the variation, respectively.
Projection of PCs from all samples genotyped on GSA onto those from the HGDP allowed for visualization of populations on a globally diverse scale. Results of the PCA using the HGDP as reference populations showed clear layering of the Australian, Dutch and Midwestern American populations on the representative European HGDP cohort (Figure 3). The HGDP European population is comprised of samples collected from France, Italy, Italy-Bergamo, Orkney Islands, Russia and Russia-Caucasus. At the global level, the Australian, Dutch and Midwestern American samples showed strong distinction from African and Asian populations. Alternatively, the PCs of the cross-ethnic comparison demonstrated strong overlap between the Nigerian samples and the representative African population from HGDP. The HGDP African population was made up of samples obtained from Angola, Botswana, Central African Republic, Congo, Kenya, Lesotho, Namibia, Nigeria, Senegal, South Africa and Sudan. The results suggest that global genetic diversity can be observed by plotting PCs, and that the Australian, Dutch and Midwestern American populations show nearest genetic relatedness to European populations.

Fig. 3. Projection of PCs for Midwestern American, Australian, Dutch and Nigerian subjects onto HGDP populations. Shown are the results from the PCA using autosomal genotyped SNPs that were in common with HGDP after quality control, filtering and exclusion of long-range LD (54,820 markers). Ancestry outliers were removed prior to performing the PCA. PC1 and PC2 represent the first and second PCs and account for 38.048% and 28.811% of the variation, respectively.
In order to provide a quantitative estimate of relationships between populations in a pairwise fashion, we used smartpca to sum ANOVA statistics across all eigenvectors (parameter default of 10 eigenvectors). The results of the pairwise comparisons of the Australian, Dutch and Midwestern Americans are shown in Table 5. Statistically significant differences were observed for each pairwise comparison, suggesting the existence of population stratification.
Table 5. Statistical significance of differences between populations

Note: For each pair of populations, ANOVA statistics along each eigenvector were summed across eigenvectors. Degrees of freedom is equal to 10, the default number of eigenvectors.
To put in context the genetic differences between the Australian, Dutch and Midwestern Americans, we tested for significant differences between them and the samples obtained from Nigeria, as well as all HGDP populations, including representative European populations (Supplementary Files 1 and 2). All comparisons between the Australian, Dutch, and Midwestern American and HGDP European populations were statistically significant, with the comparison between Australian and Orkney Islands populations being least significant. More generally, for each cohort, the statistical comparison with the Orkney Islands resulted in the least significant difference.
Case-Control GWAS
We performed two case-control GWAS between Midwestern American (cases) and Australian (controls) and Dutch (controls) populations using only common variants. A MAF filter (MAF > 0.10) was employed to avoid false positives due to minor allele frequencies. The GWAS between Midwestern American (227 ‘cases’) and Australian (1354 ‘controls’) utilized 228,166 variants after MAF filtering. Results of the case-control GWAS between the two populations are visualized in a Manhattan plot (Figure 4(C)). Four chromosomal regions exhibited genome-wide significant differences (p < 5 × 10⁻⁸). The dbSNP ID numbers for the significant SNPs are rs6420020 (chromosome 5, p = 1.571 × 10⁻¹⁵), rs10817415 (chromosome 9, p = 3.832 × 10⁻¹⁵), rs11599284 (chromosome 10, p = 5.387 × 10⁻¹⁴) and rs78611721 (chromosome 20, p = 2.164 × 10⁻¹⁴). The frequency of these SNPs was much greater in Australians than in American individuals. The QQ-plot (Figure 4(D)) of genome-wide p values showed modest deviation from the null hypothesis of no association. The overall GWAS genomic control statistic (λ) was 1.153, indicating slight inflation due to population structure, driven by a small number of polygenic variants, between the Midwestern American and Australian populations.

Fig. 4. Results of the case-control GWAS between Midwestern American (cases), Australian (controls) and Dutch (controls) populations. (A) Manhattan plot of the case-control GWAS of Midwestern Americans (227 cases) and Dutch (6139 controls) using 228,025 variants after MAF > 0.10 filter. (B) QQ-plot of observed versus expected p values of the association results between Midwestern American and Dutch populations (λ = 1.159). (C) Manhattan plot of the case-control GWAS of Midwestern Americans (227 cases) and Australians (1581 controls) using 228,166 variants after MAF > 0.10 filter. (D) QQ-plot of observed versus expected p values of the association results between Midwestern American and Australian populations (λ = 1.153). Shown in each Manhattan plot is a blue line depicting a suggestive level of statistical significance (p = 1 × 10⁻⁵). In panel (C), the red line represents a genome-wide level of statistical significance (p = 5 × 10⁻⁸). The rs numbers point to the chromosomal region that reached the genome-wide significance level. Variants with a MAF < 0.10 were excluded. All related individuals and ancestry outliers were removed prior to performing the associations.
The second case-control GWAS was performed between Midwestern American (227 ‘cases’) and Dutch (6139 ‘controls’) using 228,025 common variants after MAF > 0.10 filtering. The results of the case-control GWAS between the two populations are presented in the Manhattan plot in Figure 4(A). No statistically significant variants exceeded the genome-wide significance threshold (p < 5 × 10⁻⁸). The QQ-plot (Figure 4(B)) shows slight genomic inflation across the entire range of p values. The GWAS genomic control statistic (λ) was 1.159, again indicating slight inflation due to population structure differences between the Midwestern American and Dutch populations.
FST Estimates
F ST values were calculated as a measure of genetic differentiation between populations. We generated F ST values using two approaches, namely Weir and Cockerham (Reference Weir and Cockerham1984) and Hudson et al. (Reference Hudson, Slatkin and Maddison1992) estimators. As demonstrated by Bhatia et al. (Reference Bhatia, Patterson, Sankararaman and Price2013), the Weir and Cockerham estimator is dependent on the ratio of sample sizes comprising each population. Therefore, an alternative approach is to use the Hudson estimator, which can be implemented as a strategy independent of sample sizes, even when F ST is not uniform across populations. The result produced by the Hudson estimator is a simple average of the population-specific estimators originally defined by Weir and Hill (Reference Weir and Hill2002). Ultimately, the Hudson estimator was recommended by Bhatia et al. (2013) or estimating F ST for pairs of populations with unequal sample sizes.
The F ST estimates from both the Weir and Cockerham and Hudson estimators are shown in Table 6 and are relatively close to previously reported estimates from the HapMap consortium (International HapMap 3 Consortium et al., Reference Altshuler, Gibbs, Peltonen, Altshuler, Gibbs and McEwen2010) and GoNL project (see Supplementary Table 5 in Genome of the Netherlands Consortium, 2014). Regardless of the estimator, smaller F ST estimates are observed between the Australian, Dutch and Midwestern American populations than between each population compared to the Nigerian cohort. Consistent with the work of Bhatia et al. (Reference Bhatia, Patterson, Sankararaman and Price2013), it is important to note that the choice of the estimator made an impact on the resulting F ST estimate.
Table 6. F ST between Midwestern American, Dutch, Australian, and Nigerian populations

Note: The choice of the F ST estimator impacts the resulting estimate. The number of SNPs used for each comparison was 564,020.
Sample sizes: Midwestern American 238; Netherlands 6139; Australian 1448; and Nigerian sample 62.
a FST as estimated by popstats software. Block size for the jackknife estimator was default 5 Mb.
b FST as estimated by scikit-allel Python package. Block size for the jackknife estimator was 56,402 (equivalent to the number of total variants divided by 10).
Discussion
To gain insight into the routine practice of aggregating genomic datasets from twin registers from around the world, we investigated interpopulation genetic variation with genome-wide data generated on GSA from the Australian, Dutch and Midwestern American populations. Here, we report on the inception and initial validation of a custom-designed Illumina GSA and its implementation in studying population genetic variation. Through quantitative measures and visualization of PCs, results of work presented here suggest a high level of genetic similarity between the Australian, Dutch and Midwestern American populations, albeit with small, yet statistically significant differences existing between them.
The custom-designed GSA provides a genotyping platform initially optimized for imputation containing a core imputation backbone supplemented with additional fine-mapping content to bolster imputation quality and genome-wide coverage. Also featured on the GSA are custom-selected markers specific to phenotypes of interest, notably for fertility and twinning.
With the use of the GoNL reference set and a selection or markers mimicking the GSA, we demonstrated that we can reimpute genotypes with a high degree of confidence. Exceptions are made for rare alleles (MAF < 0.0001), which are never well imputed (Zheng et al., Reference Zheng, Rong, Liu, Han, Zhang, Richards and Wang2015). A limitation to the validation of the GSA is that we utilized the sequences of only 249 samples; therefore, the imputation and presence of alleles with a MAF < 0.01 was likely less than ideal. However, by comparing the validation results of the Illumina GSA to other commercially available genotyping platforms the imputation quality of the GSA is well in line with other genotyping products (refer to Tables 1 and 2 in Ehli et al., Reference Ehli, Abdellaoui, Fedko, Grieser, Nohzadeh-Malakshah, Willemsen and Hottenga2017). Additionally, the method of testing the coverage using two reference datasets to check concordance between genotyped and reimputed SNPs utilizes SNPs in union with both reference panels. Thus, we inherently assume that SNPs specific to a population — for example, those SNPs only appearing in GoNL — are covered and imputed in such a manner. Nevertheless, the GSA has been instrumental in generating high-quality genotype data from cohorts around the world for use in population genetic studies of complex traits.
PCs often show remarkable correlation with geography, a manifestation of decreasing genetic similarity with increasing geographic distance. Thus, in an effort to elucidate the degree of genetic resemblance between the Australian, Dutch and Midwestern American populations, we performed PCA and visualized PCs. Visualization of PCs for the three populations under study shows a high degree of overlap between PCs 1 and 2. The similarity observed between Midwestern American and Dutch populations is consistent with estimates of 4.1 million Americans (1.28% of the US population in 2017) claiming total or partial Dutch heritage (Data Access and Dissemination Systems, 2017). In large part, the majority of inhabitants of Midwest America have ancestral origins rooted in Northwestern Europe as a result of common migratory routes. Lending additional support to the Midwestern American and Dutch similarity is the fact that the majority of the Dutch Americans reside in Michigan, California, Montana, Minnesota, New York, Wisconsin, Idaho, Utah, Iowa, Ohio, West Virginia and Pennsylvania. Together, it is apparent that there is strong Dutch influence and saturation in the Midwestern region, which is reflected in the genetic profiles of these populations.
Broad-scale comparison to diverse populations from around the world, such as those represented by the HGDP, further portrayed similarity between the Australian, Dutch and Midwestern Americans and with European populations more generally. The close resemblance of Australian and European populations is consistent with prior empirical results (Stankovich et al., Reference Stankovich, Cox, Tan, Montgomery, Huxtable, Rubio and Foote2006) and the fact that immigrants from Northern Europe colonized Australia (mainly from Britain and Ireland) and America. Incorporation of genotype data from a globally distinct population (i.e., Nigerian samples genotyped on GSA) facilitated the projection of the PCs onto the HGDP and recapitulated worldwide genetic diversity.
Quantitative measures of population similarity, as measured by summed ANOVA statistics over eigenvectors, revealed small yet statistically significant differences between the Australian, Dutch and Midwestern American populations. Additional comparisons of each population to individual HGDP European cohorts further demonstrated significant differences suggestive of population stratification. Likewise, patterns of F ST estimations were consistent with the geographical clustering observed in PCA and with previous F ST estimates of global population genetic differentiation. Altogether, it is likely that the observed population genetic dissimilarities are due to systematic allele frequency differences resulting from migration, adaptation, drift and selection.
In general, large GWAS efforts aimed at discerning the genetic contributions to complex traits typically rely on meta-analyses of multiple cohorts of relatively homogeneous populations. Thus, to assess the level of homogeneity between Midwestern American, Australian and Dutch cohorts, we performed case-control association testing between populations. Case-control GWAS of Midwestern American and Australian populations yielded results to suggest that only small genetic differences exist between the populations under study. We hesitate to interpret the few differences observed between the Australian and Midwestern American populations, although we note that it is possible that the genome-wide significant SNPs (rs6420020, rs10817415, rs78611721 and rs11599284) could be implicated in the dizygotic twinning phenotype given that the genotyped Australian group consisted of MODZT. Between Australian and Midwestern American populations, genomic inflation appeared to be primarily driven by a small number of highly polymorphic SNPs, while the remainder of the genome appears comparable. In a similar fashion, the results of the GWAS of Midwestern American and Dutch populations suggested moderate genetic differences between the two populations without genome-wide significant loci.
Twin families are major contributors of phenotype and genotype data to collaborative research initiatives. Twins are often motivated to take part because of information on their zygosity (Odintsova et al., Reference Odintsova, Willemsen, Dolan, Hottenga, Martin, Slagboom and Boomsma2018). The results from the work presented here are encouraging for ongoing collaborative projects, including the genetics of twinning. Collaborative efforts of the Australian, Netherlands and other twin registers have contributed to many landmark genetic studies, including the identification of two genetic variants associated with dizygotic twinning (Mbarek et al., Reference Mbarek, Steinberg, Nyholt, Gordon, Miller, McRae and Boomsma2016). Participation of twin cohorts and their families from geographically distinct regions such as Nigeria will undoubtedly help facilitate the elucidation of additional genetic variants underlying complex traits, including dizygotic twining, due to the large regional differences in twinning rates (Hall, Reference Hall2003; Hoekstra et al., Reference Hoekstra, Zhao, Lambalk, Willemsen, Martin, Boomsma and Montgomery2008; Smits & Monden, Reference Smits and Monden2011).
Supplementary material
To view supplementary material for this article, please visit https://doi.org/10.1017/thg.2019.41.
Acknowledgments
We would like to acknowledge and thank the individuals and scientists who participated in the Genome of the Netherlands project and the Human Genome Diversity Project. We would also like to extend our gratitude to all of the enrolled participants of the twin registers represented in this study.
Financial support
The Avera Twin Register is supported by Avera Health, Avera McKennan Hospital and Avera Institute for Human Genetics. The collaboration between the Netherlands and the Avera Twin Register arose through NIHM Grant: 1RC2MH089995-01: Genomics of Developmental Trajectories in Twins.
Conflict of interest
The authors declare no conflict of interest.
Ethical standards
All participants provided informed consent. This study was conducted under Institutional Review Board approval at all study sites. Netherlands Twin Register (Dutch cohort): The study was approved by the Central Ethics Committee on Research Involving Human Subjects of the VU University Medical Centre, Amsterdam, an Institutional Review Board certified by the US Office of Human Research Protections (IRB number IRB00002991 under Federal-wide Assurance — FWA00017598; IRB/institute codes, NTR 03-180). Avera Twin Register (Midwestern American cohort): The study was approved by the Avera Institutional Review Board and the Avera Department of Human Subject’s protection.
Australia: The project was approved by the Queensland Institute of Medical Research Human Research Ethics Committee.


