


Obesity is a worldwide epidemic with a high prevalence in both developed and developing countries, causing a global disease burden and socioeconomic challenges (Rohde et al., Reference Rohde, Keller, la Cour Poulsen, Bluher, Kovacs and Bottcher2019). Obesity contributes to multiple chronic disease states, such as type 2 diabetes (Bragg et al., Reference Bragg, Tang, Guo, Iona, Du, Holmes, Bian, Kartsonaki, Chen, Yang, Sun, Dong, Chen, Collins, Peto, Li and Chen2018), nonalcoholic steatohepatitis (Pang et al., Reference Pang, Kartsonaki, Turnbull, Guo, Chen, Clarke, Bian, Bragg, Millwood, Yang, Huang, Yang, Zhang, Chen, Li, Holmes and Chen2019), coronary artery disease (Global Burden of Metabolic Risk Factors for Chronic Diseases Collaboration et al., Reference Lu, Hajifathalian, Ezzati, Woodward, Rimm and Danaei2014), cancer (Parr et al., Reference Parr, Batty, Lam, Barzi, Fang, Ho, Jee, Ansary-Moghaddam, Jamrozik, Ueshima, Woodward and Huxley2010), and even causes death (Flegal et al., Reference Flegal, Graubard, Williamson and Gail2007). Serum lipids, such as total cholesterol (TC), triglycerides (TG), high-density lipoprotein cholesterol (HDL-C) and low-density lipoprotein cholesterol (LDL-C) can reflect metabolic processes. Dyslipidemia, a characteristic of metabolic syndrome (MetS), is also a risk factor for insulin resistance, type 2 diabetes and cardiovascular disease (Alshehry et al., Reference Alshehry, Mundra, Barlow, Mellett, Wong, McConville, Simes, Tonkin, Sullivan, Barnes, Nestel, Kingwell, Marre, Neal, Poulter, Rodgers, Williams, Zoungas, Hillis and Meikle2016; Cadby et al., Reference Cadby, Melton, McCarthy, Giles, Mellett, Huynh, Hung, Beilby, Dubé, Watts, Blangero, Meikle and Moses2020; Rankinen et al., Reference Rankinen, Sarzynski, Ghosh and Bouchard2015).
Consistent conclusions on the association between obesity and serum lipid levels have been drawn. Obesity-related phenotypes such as body mass index (BMI) are positively correlated with TC, TG and LDL-C levels, but negatively associated with HDL-C levels. However, most of these studies only used Pearson correlation or multiple stepwise regression methods (Abbasi et al., Reference Abbasi, Blasey and Reaven2013; Tao et al., Reference Tao, Li, Xiao, Cen, Zhang, Zhuo, Zhou, Chen, Li, Liao, Folsom, Stamler, Warnick and Williams1992; Zhu et al., Reference Zhu, Heymsfield, Toyoshima, Wang, Pietrobelli and Heshka2005), and only a few have constructed a genetic model or performed variance decomposition utilizing familial or twin samples to assess the correlation between the two phenotypes (Cadby et al., Reference Cadby, Melton, McCarthy, Almeida, Williams-Blangero, Curran, VandeBerg, Hui, Beilby, Musk, James, Hung, Blangero and Moses2018; Pang et al., Reference Pang, Zhang, Li, Duan, Hjelmborg, Kruse, Kyvik, Christensen and Tan2010; Tang et al., Reference Tang, Hong, Province, Rich, Hopkins, Arnett, Pankow, Miller and Eckfeldt2006). Monozygotic twins (MZ) are considered 100% genetically similar, whereas dizygotic twins (DZ) share an average of 50% genetic materials. The heritability of a phenotype can be evaluated by constructing a structural equation model (SEM) using twin samples, and the correlation between two phenotypes and the proportion of genetic and environmental contributions can be assessed by applying bivariate SEM (Liao et al., Reference Liao, Gao, Cao, Lv, Yu, Wang, Zhou, Pang, Cong, Wang, Wu and Li2015).
Since obesity and serum lipid levels are correlated and even genetically related, many studies have explored genes or single-nucleotide polymorphisms (SNPs) that are related to both phenotypes simultaneously to identify their common underlying biological pathway. Genomewide association studies (GWAS) have recognized numerous variants in recent years. The simplest method for identifying pleiotropic variants is to find the overlap between the two phenotype GWAS results. Alternatively, candidate SNPs or genes that are significantly associated with one trait can be tested for their relationship with another. For example, the FTO gene has been widely confirmed to be related to obesity, and researchers have explored whether SNPs in this gene are related to serum lipids, with inconsistent conclusions (Al-Attar et al., Reference Al-Attar, Pollex, Ban, Young, Bjerregaard, Anand, Yusuf, Zinman, Harris, Hanley, Connelly, Huff and Hegele2008; Gao et al., Reference Gao, Wu, Zhang, Zhao, Cheng and Mi2018; Kring et al., Reference Kring, Holst, Zimmermann, Jess, Berentzen, Toubro, Hansen, Astrup, Pedersen and Sorensen2008). Other studies constructed genetic risk score based on significant SNPs of one phenotype in GWAS studies to test for association with another phenotype, or conducted Mendelian randomization analysis (Emdin et al., Reference Emdin, Khera, Natarajan, Klarin, Zekavat, Hsiao and Kathiresan2017; Kim et al., Reference Kim, Hwang, Kim, Moon, Han and Kim2016; Lotta et al., Reference Lotta, Wittemans, Zuber, Stewart, Sharp, Luan, Day, Li, Bowker, Cai, De Lucia Rolfe, Khaw, Perry, O’Rahilly, Scott, Savage, Burgess, Wareham and Langenberg2018). However, these methods mentioned above are likely to have conservative results because they have low detection power and may neglect some true associations (Solovieff et al., Reference Solovieff, Cotsapas, Lee, Purcell and Smoller2013).
Cross-phenotype (CP) associations indicate that certain genetic variants are related to multiple phenotypes, which is linked to pleiotropy in complex diseases (Solovieff et al., Reference Solovieff, Cotsapas, Lee, Purcell and Smoller2013). The cross-phenotype association (CPASSOC) method is a meta-analysis that incorporates results from the summary statistics of several phenotypes from one or from various studies. This approach has higher statistical power than single-trait analysis and can be used to describe population structure and relatedness (Zhu et al., Reference Zhu, Feng, Tayo, Liang, Young, Franceschini, Smith, Yanek, Sun, Edwards, Chen, Nalls, Fox, Sale, Bottinger, Rotimi, Liu, McKnight and Redline2015). SNPs associated with obesity and serum lipid levels can be explored using this program.
This study aimed to: (1) calculate the heritability of BMI, TC, TG, HDL-C and LDL-C and assess the correlation between BMI and the four serum lipid phenotypes; (2) identify genetic variants jointly associated with BMI and lipid levels; and (3) explore biological pathways related to BMI and lipid metabolism.
Materials and Methods
Study Sample
All participants were recruited from the Chinese National Twin Registry (CNTR), the first established, largest population-based twin registry in China. The CNTR has enrolled 61,566 twin pairs from 11 regions since 2001 (Gao et al., Reference Gao, Cao, Lv, Yu, Wu, Wang, Meng, Wang, Wang, Pang, Yu, Wang, Wu, Dong, Wu, Jiang, Wang, Liu, Deng and Li2019). Details of this twin registry have been previously reported (Gao et al., Reference Gao, Cao, Lv, Yu, Wu, Wang, Meng, Wang, Wang, Pang, Yu, Wang, Wu, Dong, Wu, Jiang, Wang, Liu, Deng and Li2019; Li et al., Reference Li, Gao, Yu, Lv, Cao, Zhan, Wang, Wu and Hu2013). The data for this study was based on follow-up surveys in Shandong, Jiangsu, Zhejiang, Sichuan and Heilongjiang provinces in 2013 and 2017−2018, and contains questionnaire response information, anthropometric assessments and fasting blood biochemical tests.
In the construction of the SEM in this study, participants who were aged over 18 and willing to cooperate with physical examination and blood collection were included, and those who were pregnant or being treated with weight- or lipid-lowering medicine were excluded. Only twins reared together were included in the study. If any one of the twin pairs was excluded, the other one was also excluded. Zygosity was determined based on age and gender, and whether strangers were confused about the appearance of twins during the baseline investigation, with an accuracy of 86.98% (Wang et al., Reference Wang, Gao, Yu, Cao, Lv, Wang, Pang, Cong, Wang, Wu and Li2015). SEM analysis was conducted on data from the 1197 twin pairs who remained (475 MZ male pairs, 252 MZ female pairs, 207 DZ male pairs, 79 DZ female pairs, 184 DZ opposite-sex pairs); 805 people had genetic information from either genotyping or whole-genome sequencing.
All participants provided written informed consent, and the Biomedical Ethics Committee at Peking University approved this study (IRB00001052-13022/14021).
Measurements
Height and weight were measured using a portable stadiometer and digital balance (Body Composition Analyzer/Scale, TANITA, Tokyo, Japan; Liao et al., Reference Liao, Gao, Cao, Lv, Yu, Wang, Zhou, Pang, Cong, Wang, Wu and Li2015). If repeated measurements were available, the average of this phenotype was calculated. BMI was defined as weight (kg)/height2 (m2).
Covariates, including age, gender, smoking, alcohol consumption and physical activity were obtained from questionnaires. Smoking status and alcohol consumption were divided into three categories (never, former, and current). Physical activity was calculated based on the participants’ responses to the time spent on work, transportation, daily life and rest time. The metabolic equivalent task (MET) value was calculated, and the results were coded into three categories (low, medium, high; Ainsworth et al., Reference Ainsworth, Haskell, Whitt, Irwin, Swartz, Strath, O’Brien, Bassett, Schmitz, Emplaincourt, Jacobs and Leon2000; Fan et al., Reference Fan, Lv and He2014).
The collection, storage and testing of blood samples have been described previously (Liao et al., Reference Liao, Gao, Cao, Lv, Yu, Wang, Zhou, Pang, Cong, Wang, Wu and Li2015). DNA was extracted for genotyping or sequencing.
Genotyping
Genomic DNA was extracted from the whole peripheral blood using BioTeke whole blood DNA extraction Kit. DNA quantification and quality were measured by electrophoresis and UV spectrophotometer. Genotyping was performed using the Human Omni ZhongHua-8 BeadChip (Illumina Inc, San Diego, USA). DNA genotyping was performed on 480 twins, including 125 MZ twin pairs, 112 DZ twin pairs and 6 unrelated individuals. Duplicated samples (n = 1) and samples with SNP call rate <95% (n = 16) were excluded. There were 867,807 SNPs in autosomes initially. We excluded single SNPs based on the following criteria: SNP genotype missingness rate > 5% (n = 7651), minor allele frequency (MAF) < 0.05 (n = 160,312), Hardy-Weinberg equilibrium (HWE) significance < 10−6 (n = 185). Finally, the genetic data of 457 subjects and 697,297 SNPs were imputed with reference to 1000 Genomes (Phase 3) using IMPUTE2 (Howie et al., Reference Howie, Donnelly and Marchini2009). Imputed SNPs were examined based on the following criteria: if MAF > 3%, imputation INFO should be > 0.3; or if 1% < MAF ≤ 3%, INFO should be > 0.6; or if 0.5% < MAF ≤ 1%, INFO should be > 0.8; or if 0.1% < MAF ≤ 0.5%, INFO should be > 0.9. Finally, 9,395,080 SNPs passed quality control.
Sequencing
After random interruption, end repair and PCR, the DNA extracted from the whole peripheral blood became sequencing raw reads. After data filtering, data quality control, mapping to reference, marking duplicates, indel realignment and base recalibration, the raw reads were transformed into variant SNPs. The whole sequencing procedures were performed by BGI Genomics Co., Ltd, China with qualified control.
Statistical Analysis
Structural equation modeling
For classic SEM in a twin study, phenotypic variation can be divided into additive genetic effects (A), dominance genetic effects (D), shared environmental effects (C) and nonshared environmental effects (E). The proportion of variance of A and D within the overall variation is defined as heritability. Sex-specific differences in genetic effects can be examined by including DZ opposite-sex twins, with different parameters for males and females, as well as by specifying the correlation between their genetic effects (r g ;Orstavik et al., Reference Orstavik, Kendler, Czajkowski, Tambs and Reichborn-Kjennerud2007). r g is freely estimated when fitting the model that accounts for qualitative and quantitative genetic differences, which means that genes that influence a phenotype differ between males and females. Then, r g was set to 1 to fit the quantitative model, which means that the same genes influence the trait, while their effect varies in magnitude. The no-sex-difference model means that r g is equal to 1 and the parameters for different genders are also identical. As the effects of C and D cannot be concurrently assessed in twins reared together, the ACE model and ADE model were fitted separately, and the one with a lower Bayesian Information Criterion (BIC) value was chosen as the best model (Mather et al., Reference Mather, Blom, Bergstrom and Svedberg2016). Then nested models that dropped the genetic (A or D) and environmental (C) components were fitted and the performances of the ACE/ADE model and its nested models were compared. A nested model was defined as the best-fit model if the LRT p value was >.05, and the Akaike’s information criterion (AIC) was smaller than that of the ACE/ADE model.
Similar to univariate SEM, bivariate SEM can be applied to assess the variances of A, C, D and E between two phenotypes using Cholesky decomposition (Figure 1, sex-differences are not shown). A bivariate SEM was fitted based on the results of the univariate SEM. We reported phenotypic correlation (rp) and proportion of genetic and environmental contributions to the phenotypic correlation for BMI and lipid phenotypes. rp means the correlation coefficient of two phenotypes, and proportions of genetic correlation means the proportion of shared genetic factors contributing to phenotypic correlations. In the SEM analysis, raw data of BMI were used and logarithmic transformation of serum lipids was performed, and models were adjusted for age. The SEM was fitted with OpenMx package (version 2.18.1) in R (version 4.0.2).
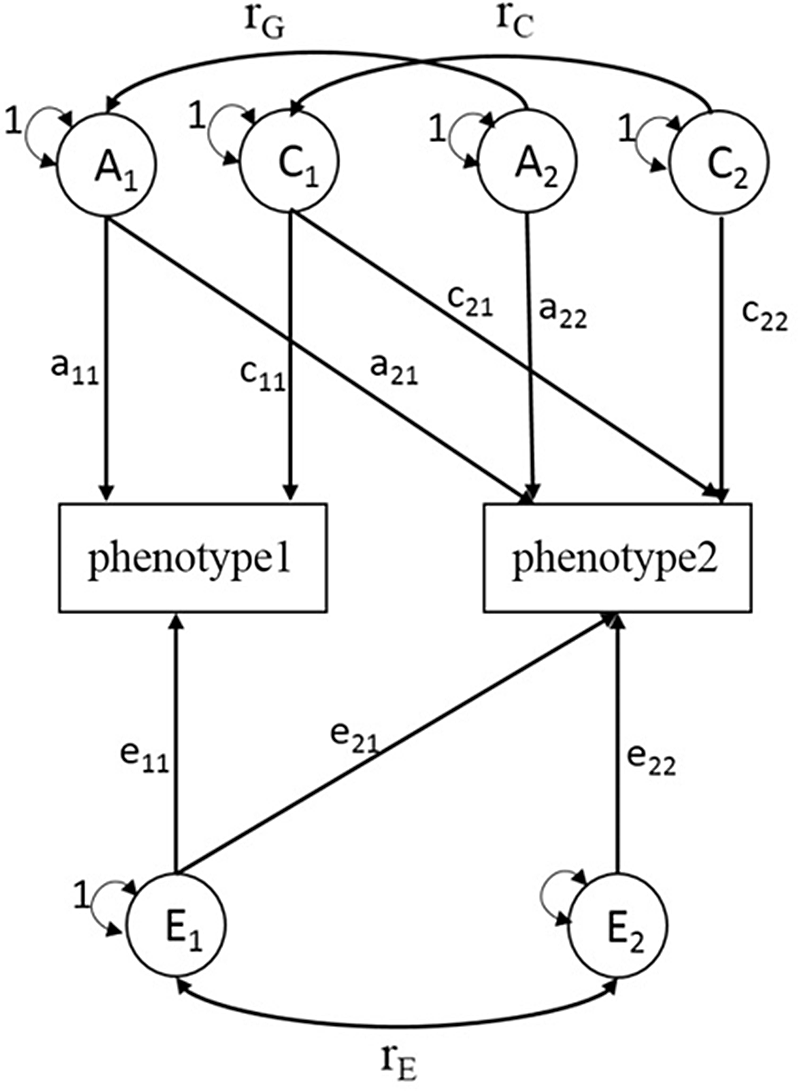
Fig. 1. Choleskey decomposition of bivariate structural equation model (ACE model). A1, A2 = additive genetic variances; C1, C2 = shared environmental variances; E1, E2 = nonshared environmental variances; a11, a22 = additive genetic path coefficients; c11, c22 = shared environmental path coefficients; e11, e22 = nonshared environmental path coefficients; a21, c21, e21 = specific additive genetic path coefficient, specific shared environmental path coefficient, specific nonshared environmental path coefficient influence on phenotype1 and phenotype2 simultaneously; r G = correlation between genetic factors; r C = correlation between shared environmental factors; r E = correlation between nonshared environmental factors.
GWAS
GWAS analysis of BMI, TC, TG, HDL-C, LDL-C were conducted for 457 participants (2 individuals treated with lipid-lowering medicine were excluded) using the genomewide efficient mixed-model association (GEMMA, version 0.98, Linux) program, which uses linear mixed models to explain kinship among samples, population stratification and other confounding factors in genetic association tests (Zhou & Stephens, Reference Zhou and Stephens2012). Logarithmic transformation of serum lipids data was performed to meet the normal distribution, and the models were adjusted for age, age square, sex and the first 10 principal components (PCs). CPASSOC analysis based on univariate GWAS results can identify SNPs that influence BMI and lipid traits simultaneously (Zhu et al., Reference Zhu, Feng, Tayo, Liang, Young, Franceschini, Smith, Yanek, Sun, Edwards, Chen, Nalls, Fox, Sale, Bottinger, Rotimi, Liu, McKnight and Redline2015). This analysis was conducted assuming heterogeneity is present or not present, because the effect size and direction of a SNP may be different between two phenotypes. The results of CPASSOC were further compared with the results of bivariate GWAS performed by GEMMA (Zhou & Stephens, Reference Zhou and Stephens2014). Genomewide significance was set at p < 5E-8, but p < 1E-5 was adopted as a suggestive significance level owing to the limited sample size in this analysis (Li et al., Reference Li, Cao, Zhu, Fang, Chen, Wang, Zhao, Guo, Ding, Guan, Zhang, Guo, Fei and Wang2019; Ran et al., Reference Ran, Pei, Liu, Zhang, Han, Hai, Tian, Lin, Yang, Guo, Shen, Thethi, Zhu and Deng2013). The CPASSOC analysis (version 1.0.1) were performed in R (version 4.0.2). SNPs with suggestive significance were selected for the validation stage, which involved subjects with sequencing data. If a certain SNP was not in the validation data, another SNP in linkage disequilibrium (r 2 > .6) was selected. Validation model was adjusted for age, sex and region. p < .05 was set as significance level. Both of the two stages used an additive genetic model.
Enrichment Analysis
Significant SNPs in the GWAS analysis were mapped to the loci or the nearest gene on the chromosomes. Enrichment analysis of GO pathways was conducted using Gorilla (http://cbl-gorilla.cs.technion.ac.il/) (Eden et al., Reference Eden, Navon, Steinfeld, Lipson and Yakhini2009). Pathways with a p value < .001 were considered significant biological pathways.
Results
Structural Equation Modeling
The basic epidemiological characteristics of all 2394 individuals, including 727 MZ twin pairs and 470 DZ twin pairs in the SEM analysis, are described in Table 1. The analysis involved 1548 men and 846 women aged 49.6 and 46.6, respectively. More than half of men were current smokers and drinkers, while the corresponding percentages of women were relatively lower. TC and LDL-C levels were comparable between genders. Men had higher BMI and TG level, while lower HDL-C level than women did.
Table 1. Epidemiological characteristics of 2394 Chinese twins for SEM analysis

Note: SEM, structural equation modeling; MZ, monozygotic; BMI, body mass index; TC, total cholesterol; TG, triglyceride; HDL-C, high density lipoprotein cholesterol; LDL-C, low density lipoprotein cholesterol. p values were corrected for the correlation between co-twins using multinomial logistic regression for categorical variables and random-effects models for continuous variables.
The univariate and bivariate SEM model selection procedures are shown in Supplementary Table S1 and S2 respectively. Univariate SEM results showed that BMI and the four lipid phenotypes were all affected by genetic factors. The ACE model was better than ADE for all traits except for LDL-C, and there were qualitative sex differences in the variation of BMI, and quantitative sex differences in the variation of TG, HDL-C and LDL-C (Supplementary Table S1). For example, the heritability of BMI was 71% (95% CI [.66, .75]) in males but only 39% (95% CI [.15, .71]) in females. The shared environmental factors had a greater impact on the variation of BMI in females (34%, 95% CI [.4, .56]) than males (0%). Similar results were also obtained for HDL-C level. However, sex differences seemed to be smaller in the variation of TC, TG and LDL-C, of which the heritability was 50−70% (Supplementary Table S3).
The results of the bivariate SEM are shown in Table 2, and there were genetic correlations between BMI and the four serum lipids in both genders. For example, the correlation coefficient between BMI and serum TC was 0.16 (95% CI [.11, .21]) and 0.17 (95% CI [.10, .25]) for males and females respectively. Genetic effects accounted for 76% of male and 65% of female phenotypic correlations between BMI and TC. The genetic contribution that affected the covariation of BMI and the four serum lipids accounted for more than 60%, exceeding the environmental contribution.
Table 2. Results of best bivariate structural equation model for BMI-lipid levels
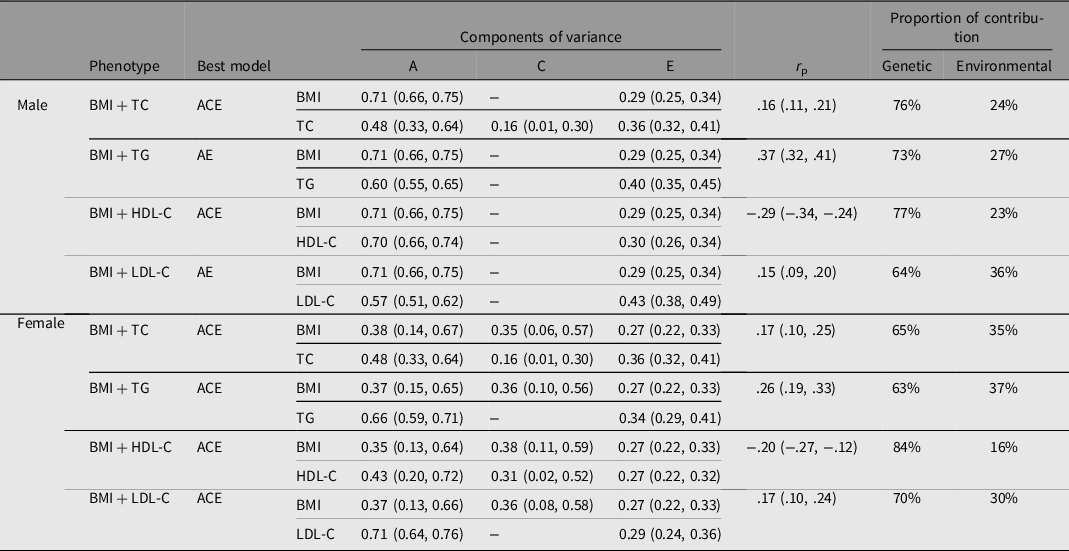
Note: BMI, body mass index; TC, total cholesterol; TG, triglyceride; HDL-C, high density lipoprotein cholesterol; LDL-C, low density lipoprotein cholesterol; A, additive genetic effect; C, shared environmental effect; E, nonshared environmental effect; r p = phenotypic correlation coefficient.
GWAS
The study sample with genotype data consisted of 302 men and 155 women whose epidemiological characteristics are similar to those of participants eligible for SEM analysis (Supplementary Table 4). The paired subjects were randomly divided into two groups, considering the similarity of the genetic material between them. The remaining unpaired subjects were all included in group 1. Finally, there were 241 subjects in group 1 and 216 subjects in group 2. The results of the two groups were combined using METAL. We excluded SNPs with a missingness rate > 5% or minor allele frequency (MAF) < 0.05 after imputation due to the small sample size in each group. Finally, 5,191,111 and 5,144,874 SNPs were included in group 1 and group 2 analyses respectively.
The results of the two analysis strategies (CPASSOC assuming no heterogeneity and CPASSOC assuming heterogeneity) in the three groups (group 1, group 2 and combined) are shown in Supplementary Tables S5−S8. We only showed the SNP with the smallest p value nearest to one gene. The results performed by GEMMA bivariate linear mixed models were similar to CPASSOC (assuming heterogeneity), indicating the results were robust, so we did not show these results. The Manhattan plot of results of CPASSOC (assuming heterogeneity) are shown in Figure 2 and Supplementary Figures S1−S4. In total, we obtained 913 SNPs that might be associated with BMI and lipid traits simultaneously.

Fig. 2. Manhattan plots for bivariate GWAS results of BMI and lipid traits in the first stage (combined group, cross-phenotype association [CPASSOC], assuming heterogeneity).
Initially, there were 325 participants who had whole-genome sequencing data. We excluded individuals who had recently taken lipid- or weight-lowering medicine, and we randomly selected one individual from the paired twins to form a validation set, which comprised 289 individuals. 845 SNPs that were found or were in the linkage disequilibrium (r 2 > .6) with SNPs in the first stage were selected for validation. Validation results are shown in Supplementary Table S9, and only the SNP with the smallest P value nearest to one gene were reported. Finally, we identified 12, 18 16, 16, 18 genes that could be associated with BMI, TC, TG, HDL-C and LDL-C, and 7 genes (LOC105378740, LINC02506, CSMD1, MELK, FAM81A, ERAL1, MIR144) that could be associated with both BMI and lipid traits simultaneously, as shown in Table 3.
Table 3. Genes that could be associated with BMI and lipid traits in the bivariate GWAS results

Note: BMI, body mass index; TC, total cholesterol; TG, triglyceride; HDL-C, high density lipoprotein cholesterol; LDL-C, low density lipoprotein cholesterol. p1 are the p values of bivariate GWAS analysis for the BMI and the corresponding lipid trait. p2 are the p values for the validation stage. a p value was extracted from combined group assuming no heterogeneity. b p value was extracted from group1 assuming heterogeneity. c p value was extracted from group 2 assuming no heterogeneity. d p value was extracted from group1 assuming no heterogeneity.
By providing the seven genes above, the Go enrichment analysis performed by Gorilla obtained four biological pathways that are mainly involved with the MIR144 gene. These pathways regulate reverse cholesterol transport and high-density lipoprotein particle clearance, which is mainly involved in lipid homeostasis.
Since we found sex differences in the genetic effects in the variation of BMI and lipid traits in the SEM analysis, we conducted a bivariate GWAS stratified by gender. The MIR144 gene was also significant and enriched in biological pathways in males, but was not significant in females. Furthermore, no significant metabolic pathways were obtained in female participants.
Discussion
The results showed that BMI and the four serum lipid traits (TC, TG, HDL-C, and LDL-C) were influenced by genetic factors, and there seemed to be sex differences in some phenotypes. Phenotypic correlations were observed between BMI and lipid levels, in which genetic factors accounted for a moderate proportion. Based on a bivariate GWAS analysis, seven genes were found to be associated with the combination of BMI and lipids. The enrichment analysis revealed some biological pathways related to BMI and lipid metabolism.
Previous studies reported that estimated heritability of BMI ranged from .47−.90 (median .75) in twin studies and .24−.81 (median .46) in family studies (Elks et al., Reference Elks, den Hoed, Zhao, Sharp, Wareham, Loos and Ong2012) respectively. In our univariate SEM analysis, the heritability of BMI was found to be .71 (95% CI [.66, .75]) for males and .39 (95% CI [.15, .71]) for females. However, conclusions regarding whether heritability in BMI differed by sex were not consistent. The meta-regression conducted by Elks et al. (Reference Elks, den Hoed, Zhao, Sharp, Wareham, Loos and Ong2012) confirmed a null effect of sex, but some studies have even indicated that females had a higher heritability than males (Harris et al., Reference Harris, Tambs and Magnus1995; Herskind et al., Reference Herskind, McGue, Sorensen and Harvald1996; Schousboe et al., Reference Schousboe, Willemsen, Kyvik, Mortensen, Boomsma, Cornes, Davis, Fagnani, Hjelmborg, Kaprio, De Lange, Luciano, Martin, Pedersen, Pietiläinen, Rissanen, Saarni, Sørensen, Van Baal and Harris2003). The results of this study were similar to those of another study conducted in Chinese twins, which found that the heritability of BMI differs by area and sex. The highest was 67.8% in males of Tianjin and the lowest was 11.2% in females in Heilongjiang province (Zhou et al., Reference Zhou, Li, Lyu, Yu, Wang, Pang, Cong, Dong, Wu, Wang, Wu, Jiang, Wang, Wang, Gao and Cao2015). There were qualitative differences between genders, and this means that different genes affect BMI. Only phenotypes such as waist circumference (Randall et al., Reference Randall, Winkler, Kutalik, Berndt, Jackson, Monda, Kilpeläinen, Esko, Mägi, Li, Workalemahu, Feitosa, Croteau-Chonka, Day, Fall, Ferreira, Gustafsson, Locke, Mathieson and Heid2013), waist-to-hip ratio (Yang et al., Reference Yang, Bakshi, Zhu, Hemani, Vinkhuyzen, Nolte, van Vliet-Ostaptchouk, Snieder, Lifelines Cohort, Esko, Milani, Mägi, Metspalu, Hamsten, Magnusson, Pedersen, Ingelsson and Visscher2015), and BMI-adjusted waist-to-hip ratio (Winkler et al., Reference Winkler, Justice, Graff, Barata, Feitosa, Chu, Czajkowski, Esko, Fall, Kilpeläinen, Lu, Mägi, Mihailov, Pers, Rüeger, Teumer, Ehret, Ferreira, Heard-Costa and Loos2015) have been found to have gender heterogeneity in genetic factors, which may be explained by the differences in the proportion and distribution of body fat between men and women. Further efforts should be made to investigate whether the mechanisms that affect obesity differ by sex and area.
All four serum lipid traits were related to genetic factors, and their heritability was similar to that reported by previous studies (Chien et al., Reference Chien, Hsu, Chen, Chen, Su and Lee2007; Heller et al., Reference Heller, de Faire, Pedersen, Dahlen and McClearn1993; Lin et al., Reference Lin, Peyser, Kardia, Li, Liu, Chu, Lin and Li2014; Souren et al., Reference Souren, Paulussen, Loos, Gielen, Beunen, Fagard, Derom, Vlietinck and Zeegers2007; Weiss et al., Reference Weiss, Pan, Abney and Ober2006). In the bivariate SEM analysis, BMI was positively correlated with TC, TG and LDL-C, and negatively related to HDL-C, which was the same as the conclusions drawn from analyses performed on subjects from different races, genders and regions (Abbasi et al., Reference Abbasi, Blasey and Reaven2013; Cadby et al., Reference Cadby, Melton, McCarthy, Almeida, Williams-Blangero, Curran, VandeBerg, Hui, Beilby, Musk, James, Hung, Blangero and Moses2018; Mahaney et al., Reference Mahaney, Blangero, Comuzzie, VandeBerg, Stern and MacCluer1995; Pang et al., Reference Pang, Zhang, Li, Duan, Hjelmborg, Kruse, Kyvik, Christensen and Tan2010; Tang et al., Reference Tang, Hong, Province, Rich, Hopkins, Arnett, Pankow, Miller and Eckfeldt2006; Tao et al., Reference Tao, Li, Xiao, Cen, Zhang, Zhuo, Zhou, Chen, Li, Liao, Folsom, Stamler, Warnick and Williams1992; Zhu et al., Reference Zhu, Heymsfield, Toyoshima, Wang, Pietrobelli and Heshka2005). BMI was more strongly correlated with blood pressure, insulin and lipids in men than in women in an observational study (Fall et al., Reference Fall, Hagg, Ploner, Magi, Fischer, Draisma, Sarin, Benyamin, Ladenvall, Åkerlund, Kals, Esko, Nelson, Kaakinen, Huikari, Mangino, Meirhaeghe, Kristiansson and Nuotio2015). Lipid metabolomics studies also found that some lipids were associated with BMI in opposite directions across genders, and the strength of the correlation between some lipids and BMI differed significantly between males and females (Beyene et al., Reference Beyene, Olshansky, T. Smith, Giles, Huynh, Cinel, Mellett, Cadby, Hung, Hui, Beilby, Watts, Shaw, Moses, Magliano and Meikle2020). Mendelian randomization studies also indicated that the correlations between metabolites and BMI were higher in males than in females (Wurtz et al., Reference Wurtz, Wang, Kangas, Richmond, Skarp, Tiainen, Tynkkynen, Soininen, Havulinna, Kaakinen, Viikari, Savolainen, Kähönen, Lehtimäki, Männistö, Blankenberg, Zeller, Laitinen, Pouta and Ala-Korpela2014). This phenomenon-may partly be explained by gender differences in the distribution characteristics of BMI and blood lipids, as is indicated in our study. Fat is more likely to deposit in the abdomen in males, which is associated with a deleterious cardiometabolic pattern; for example, hypertension, dyslipidemia and insulin resistance (Fall et al., Reference Fall, Hagg, Ploner, Magi, Fischer, Draisma, Sarin, Benyamin, Ladenvall, Åkerlund, Kals, Esko, Nelson, Kaakinen, Huikari, Mangino, Meirhaeghe, Kristiansson and Nuotio2015; Schorr et al., Reference Schorr, Dichtel, Gerweck, Valera, Torriani, Miller and Bredella2018). The sex differences in the correlation between obesity and lipids needs to be further explored.
BMI and the four lipid traits were also genetically correlated in our study, and the proportions of genetic correlation of BMI and lipids were over 50%, indicating genetic effects played a more important role. This conclusion was consistent with some previous twin and family studies, which also indicated a genetic correlation between BMI and lipids. A Chinese twin study fitted models with some combinations of obesity phenotypes and lipids and found no statistically significant genetic correlation between BMI and HDL-C (Liao et al., Reference Liao, Gao, Cao, Lv, Yu, Wang, Zhou, Pang, Cong, Wang, Wu and Li2015), which might be explained by the small sample size (only 903 individuals) in that research. However, another Chinese twin study found that the correlation between BMI and lipid traits was mainly due to environmental factors, and it even showed that BMI is positively correlated with HDL-C (Pang et al., Reference Pang, Zhang, Li, Duan, Hjelmborg, Kruse, Kyvik, Christensen and Tan2010), which was contrary to the conclusions of other studies. This study fitted a complex multivariate SEM with six phenotypes, which may lead to unstable parameter estimates. Compared with that study, the bivariate model in our study can explain the correlation between phenotypes more clearly. Some lipids were found to be genetically correlated with obesity in metabolomics study (Cadby et al., Reference Cadby, Melton, McCarthy, Giles, Mellett, Huynh, Hung, Beilby, Dubé, Watts, Blangero, Meikle and Moses2020). SNPs associated with lipids were identified to be correlated with BMI and waist-hip-ratio (Willer et al., Reference Willer, Schmidt, Sengupta, Peloso, Gustafsson, Kanoni, Ganna, Chen, Buchkovich, Mora, Beckmann, Bragg-Gresham, Chang, Demirkan, Den Hertog, Do, Donnelly, Ehret and Esko2013). The genetic risk scores of BMI were associated with lipid traits and vice versa (He et al., Reference He, Cornelis, Franks, Zhang, Hu and Qi2010; Kim et al., Reference Kim, Hwang, Kim, Moon, Han and Kim2016). These studies suggested that BMI and lipids were genetically correlated, and it is of vital importance to find out the genetic background.
After conducting a bivariate GWAS analysis and validation stage, we identified seven genes (LOC105378740, LINC02506, CSMD1, MELK, FAM81A, ERAL1, MIR144) that could be associated with both BMI and lipid traits simultaneously. Enrichment analysis also revealed the essential role of the MIR144 gene in lipid metabolism. The transcription product of the MIR144 gene is microRNA-144 (miR-144). Studies have shown that miR-144 inhibits the expression of the ABCA1 (adenosine triphosphate binding cassette transporter A1) gene, reduces the level of HDL-C and regulates cholesterol metabolism, thereby accelerating the progression of atherosclerosis (de Aguiar Vallim et al., Reference de Aguiar Vallim, Tarling, Kim, Civelek, Baldan, Esau and Edwards2013; Ramirez et al., Reference Ramirez, Rotllan, Vlassov, Davalos, Li, Goedeke, Aranda, Cirera-Salinas, Araldi, Salerno, Wanschel, Zavadil, Castrillo, Kim, Suárez and Fernandez-Hernando2013). miR-144 accelerates plaque formation by promoting the production of pro-inflammatory cytokines (Hu et al., Reference Hu, Hu, Zhao, Li, Ma, Wu, Lu, Qiu, Sha, Wang, Gao, Zheng and Wang2014), so it may be closely related to coronary heart disease. Elevation of miR-144 can be observed in coronary heart disease patients, and ST-segment elevation myocardial infarction was significantly associated with elevated MIR144 expression (Chen et al., Reference Chen, Luo, Wei, Gong and Jin2018). In the F1-zebrafish model, overexpression of MIR144 led to lipid accumulation and further induced lipid metabolism disorder (Wang et al., Reference Wang, Zheng, Ma, Du, Chu, Gu, Dahlgren, Li and Wang2018). In mice models, miR-144 is one of the most up-regulated miRNAs in response to a high-fat diet (Guedes et al., Reference Guedes, Franca, Lino, Koyama, Moreira Ldo, Alexandre, Barreto-Chaves, Galante and Diniz2016). Meanwhile, miR-144 is a significant predictor of insulin resistance, and its expression is up-regulated in patients with type 2 diabetes (Yan et al., Reference Yan, Xiao, Zhang, Wang, Dong and Wu2021; Zhu & Leung, Reference Zhu and Leung2015). The MIR144 gene might be closely related to obesity-related metabolic disorders such as dyslipidemia, type 2 diabetes and other metabolic diseases.
The CSMD1 gene is a putative suppressor of head and neck squamous cell carcinoma in cancer research (Sun et al., Reference Sun, Uppaluri, Schmidt, Pashia, Quant, Sunwoo, Gollin and Scholnick2001). This gene was previously identified to be associated with obesity-related phenotypes (BMI; Zhu et al., Reference Zhu, Guo, Shi, Liu, Panganiban, Chung, O’Connor, Himes, Gazal, Hasegawa, Camargo, Qi, Moffatt, Hu, Lu, Cookson and Liang2020), BMI-adjusted waist (Christakoudi et al., Reference Christakoudi, Evangelou, Riboli and Tsilidis2021), BMI-adjusted waist-hip-ratio (Liu et al., Reference Liu, Monda, Taylor, Lange, Demerath, Palmas, Wojczynski, Ellis, Vitolins, Liu, Papanicolaou, Irvin, Xue, Griffin, Nalls, Adeyemo, Liu, Li, Ruiz-Narvaez, Chen and Fox2013), blood pressure (Hong et al., Reference Hong, Go, Jin, Lim, Lee, Han, Hwang, Lee, Park, Cho and Oh2010), glucose (Hebbar et al., Reference Hebbar, Abubaker, Abu-Farha, Alsmadi, Elkum, Alkayal, John, Channanath, Iqbal, Pitkaniemi, Tuomilehto, Sladek, Al-Mulla and Thanaraj2021), lipids (Hebbar et al., Reference Hebbar, Abubaker, Abu-Farha, Alsmadi, Elkum, Alkayal, John, Channanath, Iqbal, Pitkaniemi, Tuomilehto, Sladek, Al-Mulla and Thanaraj2021) and metabolic syndrome (Nock et al., Reference Nock, Wang, Thompson, Song, Baechle, Raska, Stein and Gray-McGuire2009), however, the mechanism is not yet clear. The FAM81A gene was previously found to be related to BMI-adjusted visceral adipose (Fox et al., Reference Fox, Liu, White, Feitosa, Smith, Heard-Costa, Lohman, Johnson, Foster, Greenawalt, Griffin, Ding, Newman, Tylavsky, Miljkovic, Kritchevsky and Borecki2012) and phosphatidylethanolamine measurement (Rhee et al., Reference Rhee, Ho, Chen, Shen, Cheng, Larson, Ghorbani, Shi, Helenius, O’Donnell, Souza, Deik, Pierce, Bullock, Walford, Vasan, Florez, Clish, Yeh and Gerszten2013) in GWAS analysis, which may be associated with obesity and lipid metabolism. The other four genes were not formally related to these phenotypes. Deletion of the ERAL1 gene resulted in mitochondrial dysfunction, growth retardation and apoptosis (Dennerlein et al., Reference Dennerlein, Rozanska, Wydro, Chrzanowska-Lightowlers and Lightowlers2010). The MELK gene is mainly involved in cell cycle regulation (Davezac et al., Reference Davezac, Baldin, Blot, Ducommun and Tassan2002), apoptosis, proliferation (Lin et al., Reference Lin, Park, Nishidate, Nakamura and Katagiri2007) and intracellular signal transduction (Gaudet et al., Reference Gaudet, Livstone, Lewis and Thomas2011). Both the LOC105378740 and LINC02506 genes are transcribed to long noncoding RNAs and their biological functions are currently unclear.
We also conducted a bivariate GWAS stratified by gender. The MIR144 gene was also significant in male subjects, but was not in female subjects. And in female participants, we did not obtain genes that were previously found to be associated with obesity or lipids, or significant biological pathways. On the one hand, it may be due to gender differences in the genetic factors affecting BMI and blood lipids; on the other hand, the sample size of the female subjects was too small (n = 155) to find true positive associations. So the gender differences in genes are still worthy of further exploration.
Compared to other research, this study offers deeper insight into the genetic association between obesity and blood lipids from both macro and micro perspectives using data from the Chinese Twin Registry. This study had several strengths. Sex differences could be explored by including opposite-sex twins in this analysis. A GWAS was conducted using a mixed linear model, which can effectively control the population stratification and relatedness. However, this study had some limitations. First, the study participants were not randomly selected from the twin population cohort. Therefore, the results of the SEM cannot be generalized. The heritability obtained for BMI and HDL-C in females was smaller than in a previous study. Whether sex differences play a role in the variation and covariation of obesity and lipid phenotypes requires further investigation. Second, the sample size may be too small and may result in high false-negative rates in GWAS analyses. We did not acquire any positive results at the significance level of 5E-8 even when we combined the two stage subjects. Furthermore, combining GWAS results of the two groups of twins who were genetically similar using the METAL program and performing enrichment analysis with these suggestive genes would introduce bias. Two bivariate analysis methods (CPASSOC and GEMMA) were used to ensure that the findings were robust, and the results of the first stage were externally validated. Cautions should be still exercised when extrapolating these findings to the general population. Third, the influence of X and Y chromosomes were not taken into consideration in gene analysis. Therefore, further replication stages and more extensive analyses are needed to confirm these findings, and we can pay attention to other obesity phenotypes and lipid metabolism components.
In this study, BMI was confirmed to be genetically correlated with serum lipid levels in a Chinese population. The genetic mechanism underlying this association is complex and involves multiple genes, and appears to differ slightly by sex. Obese patients may also have dyslipidemia; therefore, it is important to consider changes in metabolic status as well as sex differences during the process of clinical diagnosis and treatment. Given that there may be a shared genetic background between obesity and blood lipids, a larger cohort research is required to reveal the biological processes involved in obesity and lipid metabolism disorders to confirm molecular therapeutic targets and make plans for prevention and treatment.
Supplementary Material
To view supplementary material for this article, please visit https://doi.org/10.1017/thg.2022.39.
Acknowledgements
We appreciate the support from the participants and the Center for Disease Control and Prevention in Qingdao, Zhejiang, Jiangsu, Sichuan and Heilongjiang.
Author Contributions
Weihua Cao, Wenjing Gao and Liming Li designed this study. Jun Lv, Canqing Yu, Tao Huang, Dianjianyi Sun, Chunxiao Liao and Yuanjie Pang contributed to interpretation of the findings and drafting the article. Zengchang Pang, Liming Cong, Hua Wang, Xianping Wu, Yu Liu and Biqi Wang helped collect data and conducted data quality control. Ji Ke contributed to data analysis and wrote the manuscript. All the authors contributed toward revising the manuscript.
Financial Support
This study was based at the Chinese National Twin Registry (CNTR), and was supported by the National Nature Science Foundation of China (82073633, 81973126, 81573223), Special Fund for Health Scientific Research in the Public Welfare (201502006, 201002007) and Peking University Outstanding Discipline Construction Project of Epidemiology and Biostatistics. We appreciate the support from the participants and the Center for Disease Control and Prevention in Qingdao, Zhejiang, Jiangsu, Sichuan and Heilongjiang.
Conflict of Interest
The authors declare no conflict of interest.
Ethical Standards
This study was performed in line with the principles of the Declaration of Helsinki. Approval was granted by the Biomedical Ethics Committee at Peking University (IRB00001052-13022/14021).


