


Suicide is a major public health issue in many countries worldwide, with close to 800 000 people per annum taking their own lives globally.1 In the UK more than 6000 people die by suicide each year, with tens of thousands more attempting to take their own lives.2 Primary care physicians have an important potential role in preventing suicide as they are the most common type of healthcare contact for people who experience distress or mental health problems.Reference Haste, Charlton and Jenkins3 Most people who die by suicide have contact with a primary care physician shortly beforehandReference Luoma, Martin and Pearson4–Reference Andersen, Andersen, Rosholm and Gram6 with the percentage of people seeing their general practitioners (GPs) prior to death varying from 46 to 91%.Reference Luoma, Martin and Pearson4–Reference Windfuhr, While, Kapur, Ashcroft, Kontopantelis and Carr8 Furthermore, primary care physicians' failure to screen patients for depression may contribute to underdiagnosis and undertreatment, as well as failure to detect patients experiencing suicidal ideation. Therefore, improving physician recognition of depression and assessment of a person with suicidal thoughts or behaviour are integral components of suicide prevention.Reference Goldman, Nielsen and Champion9, Reference Hirschfeld, Keller, Panico, Arons, Barlow and Davidoff10 Focusing on initiatives to improve the quality of care in primary care can have a big impact on improving the recognition and management of chronic conditions such as depression and severe mental illness (SMI), and can improve the detection of suicidal ideation,Reference Mann, Apter, Bertolote, Beautrais, Currier and Haas11 especially when combined with coordinated care between GPs and mental health specialists across the healthcare system. However, the impact of primary care on population outcomes is limited by the wide variations that exist in the quality of care of providers.Reference Starfield, Shi and Macinko12 This has led policymakers to link quality of care to provider remuneration in an attempt to reduce variability and to improve quality across health systems.Reference Van Herck, De Smedt, Annemans, Remmen, Rosenthal and Sermeus13
The quality and outcomes framework (QOF), one of the most costly and comprehensive pay-for-performance schemes of its kind, was introduced in 2004 in the UK to reward high-quality primary care.Reference Roland14 The scheme linked up to 25% of GP income to performance on quality indicators across four domains: clinical, organisational, patient experience and additional services. Varying payments were awarded to practices mainly for the ongoing management of chronic conditions, including depression and SMI, with adjustments made for practice list size and disease prevalence. The scheme was periodically reviewed and quality indicators were modified or removed, while new indicators were occasionally introduced for existing or new conditions.Reference Roland and Campbell15 In the first 3 years of its implementation, the QOF yielded improved results for intermediate outcomes and incentivised processes of care but the rate of improvement was not sustained,Reference Campbell, Reeves, Kontopantelis, Sibbald and Roland16, Reference Kontopantelis, Reeves, Valderas, Campbell and Doran17 and performance in later years was no higher than levels projected from pre-intervention trends.Reference Campbell, Reeves, Kontopantelis, Sibbald and Roland16, Reference Kontopantelis, Reeves, Valderas, Campbell and Doran17 In terms of improved patient outcomes, the evidence is contradictory.Reference Harrison, Dusheiko, Sutton, Gravelle, Doran and Roland18–Reference Ryan, Krinsky, Kontopantelis and Doran20 For some conditions there is evidence of lower rates of emergency hospital admission,Reference Harrison, Dusheiko, Sutton, Gravelle, Doran and Roland18, Reference Roland21 and reductions in inequalities of delivery of careReference Doran, Fullwood, Kontopantelis and Reeves22 but there has been no clear improvement in mortality rates in the UK for physical conditions covered by the QOF.Reference Ryan, Krinsky, Kontopantelis and Doran20 Previous research has also found no association between practice-level performance on QOF indicators and all-cause mortality in the locality.Reference Kontopantelis, Springate, Ashworth, Webb, Buchan and Doran19
In terms of mental health, the QOF includes indicators for patients with SMI, requiring practices to monitor treatment, record an up-to-date care plan and to conduct an annual review incorporating physical checks and health promotion advice. For patients with SMI, the introduction of the QOF was associated with increases in the numbers of service interactions and the number of reported comorbidities.Reference Kontopantelis, Olier, Planner, Reeves, Ashcroft and Gask23 From 2006, the QOF also includes depression indicators requiring practices to assess severity using validated assessment instruments, or indicators requiring practices to review patients within a month of diagnosis and make a biopsychosocial assessment based on 16 ‘themes’ – with one of these being suicidal ideation. These SMI and depression indicators are used to manage the chronic nature of these conditions but also to identify individuals at risk. However, existing evidence on the effectiveness of QOF mental health indicators is limited.
Suicide is an important outcome measure for assessing the quality of mental health services. Effective suicide prevention strategies need to identify individual-level risk factors but also factors associated with the social environment in which an individual lives,Reference Diez Roux and Mair24 as recent evidence indicates marked spatial variability in suicide incidence in England.Reference Brock, Baker, Griffiths, Jackson, Fegan and Marshall25 It is suggested that area of residence can have an impact on levels of social support, but can also increase the likelihood of developing a mental illness, both of which increase suicide risk.Reference Middleton, Whitley, Frankel, Dorling, Sterne and Gunnell26 Ecological studies have shown that area-level effects such as deprivation and social fragmentation are associated with the geographical distribution of suicide.Reference Congdon27–Reference Rezaeian, Dunn, St Leger and Appleby29
Most studies investigating determinants of suicide have examined specialist mental health services and suicideReference While, Bickley, Roscoe, Windfuhr, Rahman and Shaw30 or suicide in local and/or regional settings.Reference Hegerl, Wittmann, Arensman, Van Audenhove, Bouleau and Van der Feltz-Cornelis31 However, no published studies to date have examined the relationship between performance on QOF mental health indicators and suicide. The purpose of this study was to examine for the first time the relationship between incentivisation of mental health management in primary care and suicide rates. To achieve this aim we applied spatial analysis techniques to assess the association between practice performance on the mental health domain of the QOF and suicide rates for the localities that the practices serve, while controlling for relevant small-area population characteristics. No ethical approval was needed as no patients were involved and all data were publicly available except for the Office for National Statistics (ONS) mortality data. The data used in this study are freely available and the authors are happy to share in an organised and cleaned final dataset.
Method
Data sources
Several data sources were accessed to extract information on numbers of suicides, population size estimates, rurality, social fragmentation, deprivation, quality of care, disease prevalence and spatial coordinates at the lower super output area (LSOA) level. LSOAs are small geographical areas containing approximately 1500 residents. From the ONS we obtained data on case counts for suicides and open verdictsReference Linsley, Schapira and Kelly32 per LSOA of residence by year of death, broken down by gender and 5-year age bands, for the period 1 January 2006 to 31 December 2014. Our population at risk was people aged 20 years or older as we wished to exclude children and adolescents from our analysis because of differences in the remit of mental health services and depression management provided to children, adolescents and adults.33 Classification of deaths for the study used the ICD-10 and included all deaths with a final underlying cause recorded as ‘intentional self-harm’, ‘injury/poisoning of undetermined intent and sequelae of intentional self-harm’ or ‘injury/poisoning of undetermined intent’, which follows conventional practice for government suicide statistics in the UK. We included both suicide and open verdicts in our outcome measure and we refer to this measure as suicides throughout the manuscript. Population counts by gender and age group, as well as information on ethnicity were obtained from the 2011 national Census, at the 2011 LSOA.
Area-level deprivation, as measured by the Index of Multiple Deprivation (IMD) 2007, was available for LSOAs as at 2011. The IMD measures relative levels of deprivation for all the 32 844 LSOAs in England on a continuous scale of deprivation where most of the indicators are based on 2005 statistics. Moreover, we obtained data on rural/urban classification and we constructed a measure of social fragmentation based on Congdon's index (derived from 2011 Census data on private renting, single-person households, single adults and population turnover). The index represents neighbourhood-level conditions that affect social resources such as social cohesion and social capital.Reference Congdon27 Data-sets on prevalence of SMI and depression, practice list size and practice-level mental health quality of care data were obtained from NHS Digital. As 80% of LSOAs do not contain a general practice we used spatial analysis techniques to estimate healthcare data at the LSOA level from the practice-level data (a detailed description of this methodology is provided in the supplementary Appendix available at https://doi.org/10.1192/bjp.2018.143).
The number of primary care practice ‘hubs’ (an LSOA with one or more practices) varied between 8372 in the third year of the QOF (2006–07) and 7778 in the final year (2014–15) including for each year over 99% of all patients registered with primary care in England.34 From 2006 to 2007 onwards, all relevant information was available; i.e. number of practices, total list size and prevalence rates for those over 18 years old in the two relevant QOF clinical domains: SMI and depression.
To better capture quality of care in the mental health domain, as measured by the QOF, we calculated population achievement,Reference Kontopantelis, Reeves, Valderas, Campbell and Doran17, Reference Kontopantelis, Springate, Ashworth, Webb, Buchan and Doran19 defined as
 $$PAmh = \sum N_i / \sum (Di + Ei)\comma$$
where Ni, Di and Ei denote the numerator, denominator and exceptions for QOF indicator i, respectively. Population achievement was calculated, separately within each financial year, across the full set of depression and SMI outcome and measurement QOF indicators in the mental health clinical domain. The complete list and descriptions of all depression and SMI indicators with information on the years they were active are provided in the supplementary Appendix.
Statistical analysis
We fitted a negative binomial model with standard errors clustered at the LSOA level for global between-area variability and/or local variability in neighbouring areas to derive and map age and gender adjusted area estimates of suicide. Negative binomial models report incidence rate ratios (IRR) and are suitable for analysing count data when there is presence of overdispersion, as was the case in our data.
We used one set of negative binomial regression models to investigate the relationship between mental health quality of care, as measured by the QOF, and suicide incidence over time. The dependent variable was annual number of suicides between 2006 and 2014, and we investigated the relationship with the mental health quality of care measure, in the same or up to a lag of 3 years. The same sets of covariates were used for all models. We also conducted several sensitivity analyses under different assumptions. There was an excess of zero-event counts in the study dataset; thus, more than 99% of data points (LSOAs by age group and gender, over time) did not include a single suicide. Therefore, we investigated how a zero-inflated negative binomial model fitted the data. This model may intuitively seem to provide a better fit to the data, but the standard negative binomial model is more appropriate from a theoretical perspective, as every population group is ‘at risk’ of experiencing suicide. As an additional sensitivity analysis, we aggregated suicide numbers and population estimates in four age groups (20–24, 25–49, 50–64, ≥65), according to ONS classification, to address any issues of collinearity between age groups. The economic recession of 2008 occurred in the middle of our study period; thus, to isolate the impact of the QOF on suicide risk from the effects of the economic recession, we ran a sensitivity analysis for the period 2009–2014. Furthermore, conventional practice in the UK is to include open verdicts when investigating and reporting suicide rates. However, to facilitate international comparison, we analysed open verdicts and definite suicides separately. Finally, we investigated the extent to which spatial autocorrelation was present in the data (i.e. level of suicide risk in one locality affecting risk in an adjacent locality) by calculating Moran's I, which is a measure of spatial autocorrelation.
Stata v14.1 was used for the principal data management and analyses. For both sets of analyses, we used the nbreg command with the exposure option followed by the IRR specification and we used clustered standard errors for our unit of analyses (i.e. 32 844 LSOAs) to take into account the correlation of observations within each LSOA.
Results
Figure 1 represents the variability in incidence of suicide across regions over the study period. The North East and North West regions had the highest overall suicide rates whereas the London region had the lowest overall suicide rates across the period of study. There were 38 511 recorded suicides in England during calendar years 2006 to 2014, inclusive. Figure 2 represents the spatial distribution of suicide over the whole time period (aggregated), at the clinical commissioning group level (CCG), a middle-level organisation structure of the National Health Service (NHS). Figure 3 represents the spatial variability of quality of care in the mental health domain across LSOAs at the census year i.e. 2011. Descriptive statistics on suicide numbers, population size estimates, number of practices, census information, deprivation, prevalence of depression and SMI and mental health quality of care across regions (strategic health authorities) for 2011 are reported in Table 1. The highest prevalence for depression and SMI was observed in the North East and London regions respectively, whereas the lowest prevalence for depression and SMI was found in the London and South central regions respectively.
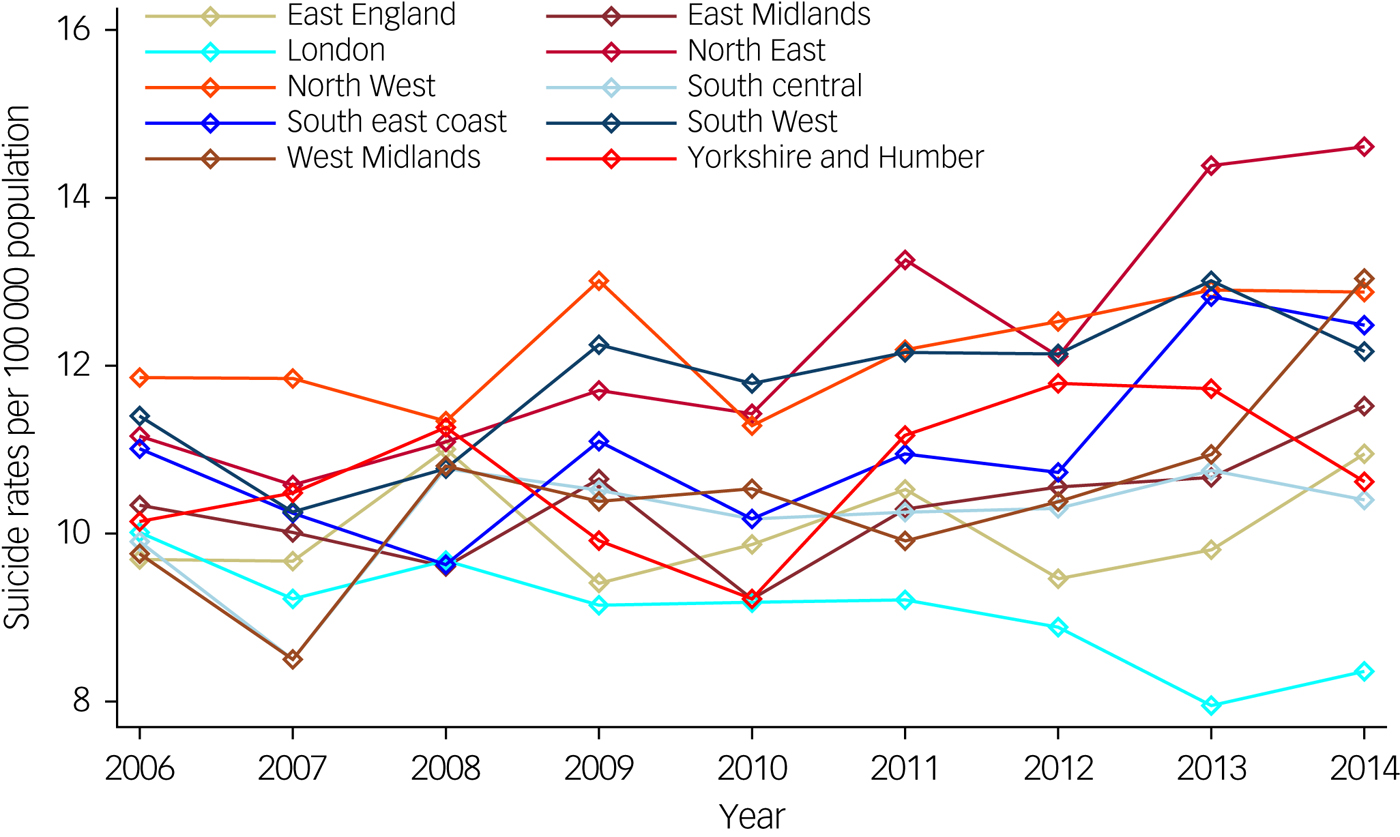
Fig. 1 Suicide rates, per 100 000 population, by English regions over time (2006–2014).
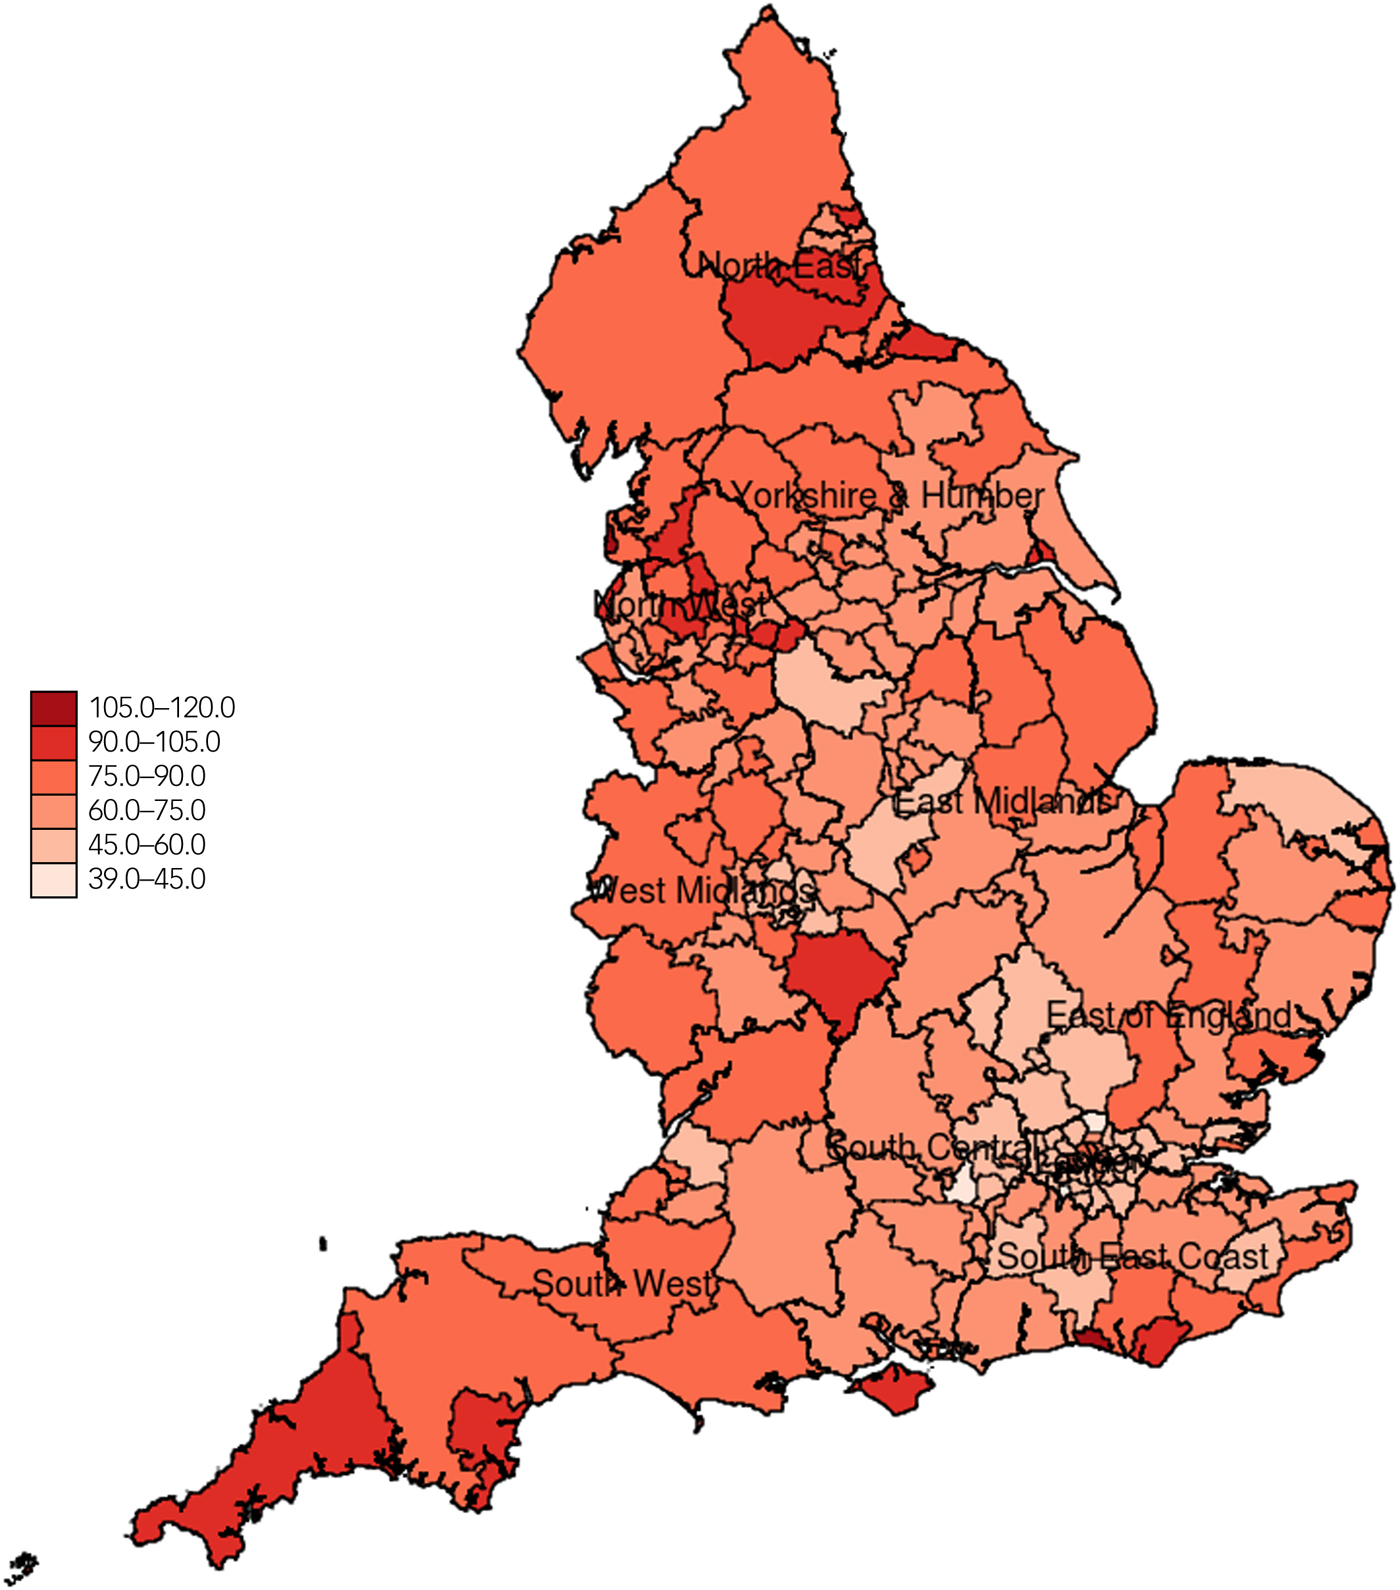
Fig. 2 Suicide rates per 100 000 population in England aggregated across all years (2006–2014) and all age groups at the clinical commissioning group level.
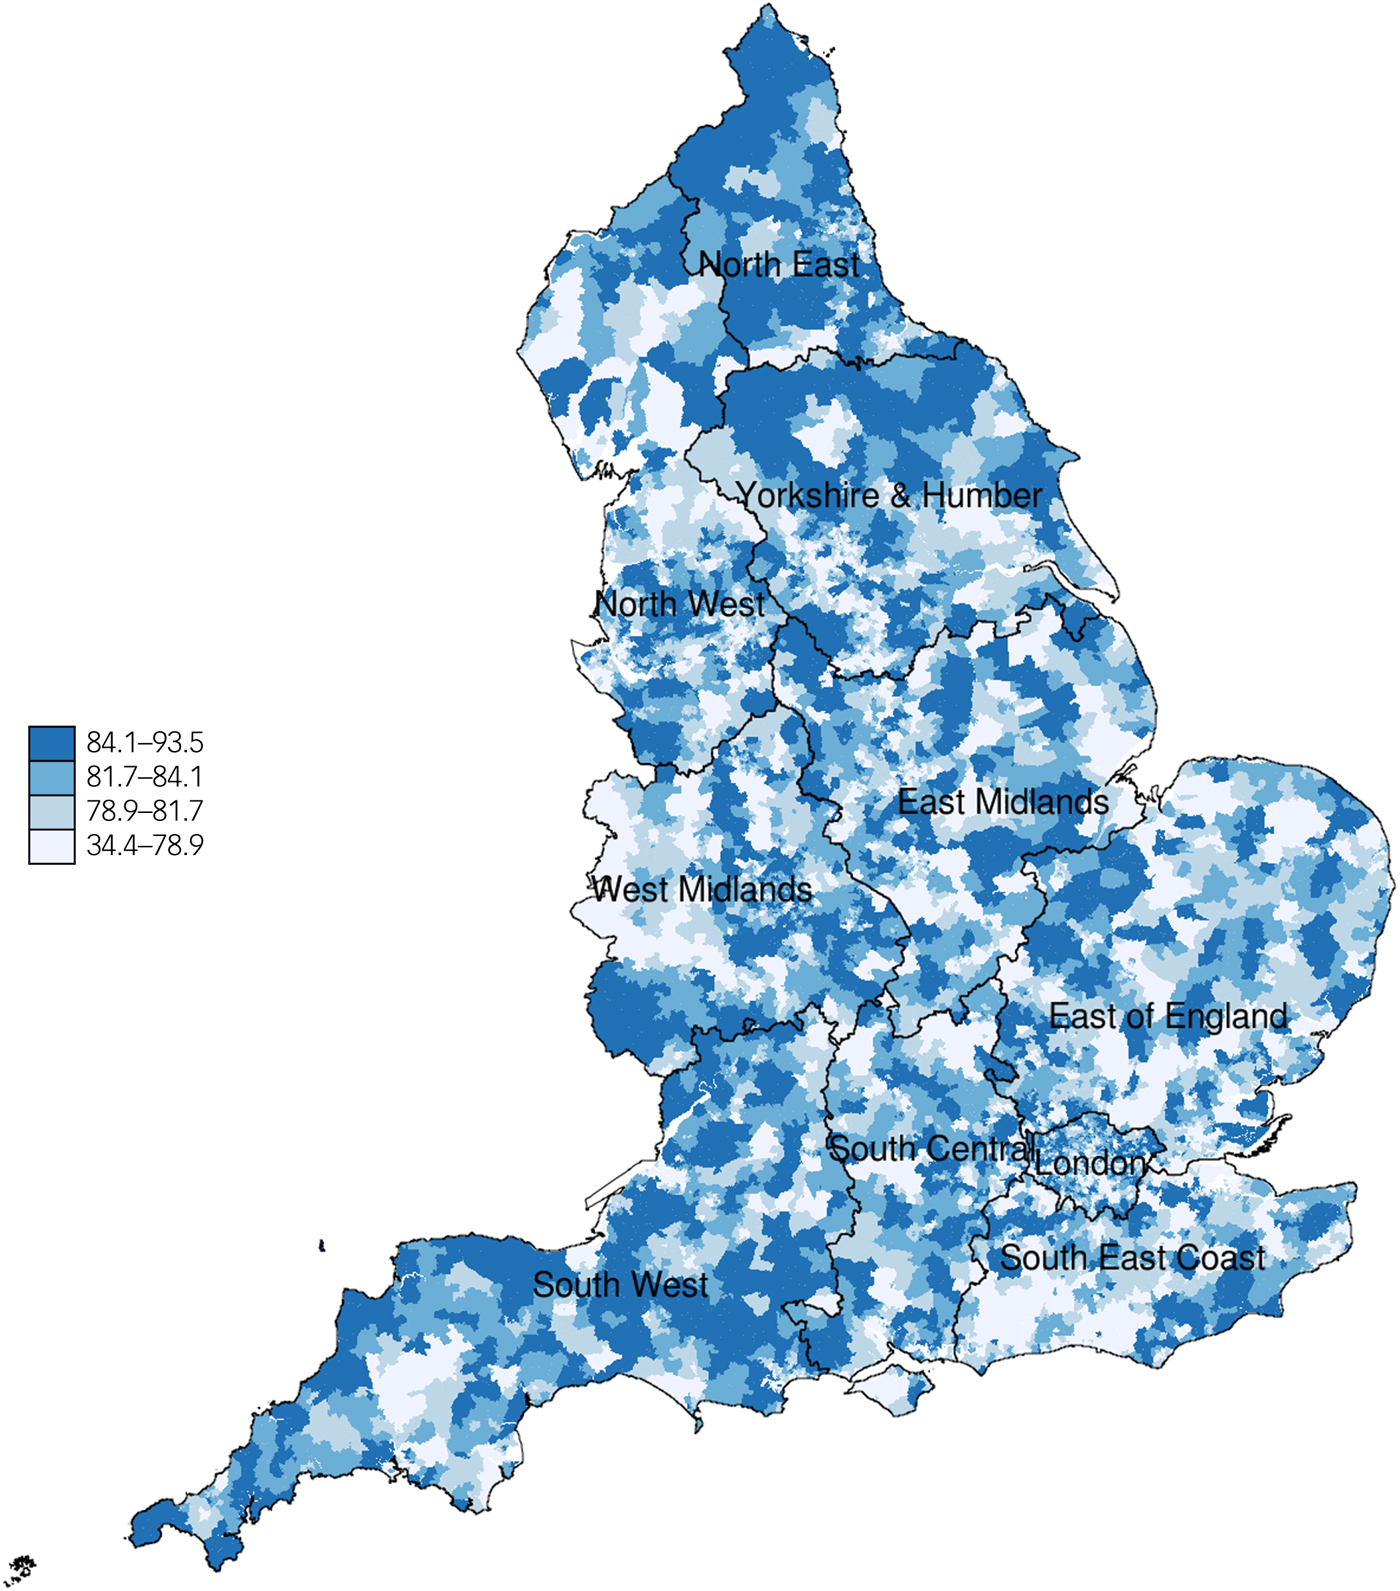
Fig. 3 Measure of mental health quality of primary care in England for specific mental health indicators at the 2011 lower super output areas (2011 Census year). A higher level of the measure in the key represents higher mental health quality of care in the locality.
Table 1 Area and population characteristics by strategic health authority
LSOA, lower super output area; P10, P25, P75, P90 are the respective percentiles for each variable.
a. Strategic health authorities were the highest geographical organisational level for NHS England during the study period. This structure was abolished in 2013.
b. Suicides and open verdicts in 2011.
c. Data available from the 2011 census.
d. Quality and outcomes framework (QOF) year 7 (2010–2011).
e. Mental health quality of care is measured as % achievement of the population in the relevant QOF indicators.
We found no association between mental health quality of care and suicide in our main model (IRR = 1.000, 95% CI 0.998–1.002). There was also no association after lagging the effects of mental health quality of care for up to 3 years. This finding was consistent in all sensitivity analyses, including the analysis limiting the study period to 2009–2014 (post-2008 recession). In the sensitivity analysis that investigated definite suicide deaths, results were similar (IRR = 1.000, 95% CI 0.998–1.002). All results from the sensitivity analyses are reported in the supplementary Appendix.
No evidence of heterogeneity in the association of interest was found, by health region or deprivation score. Median QOF mental health quality of care across regions varied between 80.4% (East Midlands) to 83.0% (North East). As expected, variability was much greater at the LSOA level, partly because of the smaller denominators. For example, in the first analysis year (2006–2007) performance varied from 12.9 to 99.2% (10th and 90th centiles were 71.3% and 91.3% respectively), in the middle year (2009–10) performance varied from 14.3 to 95.8% (10th and 90th centiles were 76.3% and 87.7%, respectively) and finally for the last year (2014–15) it varied from 28.3 to 94.2% (10th and 90th centiles were 68.6% and 82.1%, respectively).
Table 2 presents IRRs for the coefficients from the negative binomial regression models. Across all age groups, the highest risk for suicide was observed for the 40–44 group (1.876, 95% CI 1.785–1.972) while a bimodal distribution was observed with peaks in the mid years and those over 85 years (1.551, 95% CI 1.438–1.673) thus, indicating a non-linear relationship of suicide and age. Female gender (0.295, 95% CI 0.288–0.302) and social fragmentation (1.030, 95% CI 1.027–1.034) were also strong predictors of suicide across all models, followed by deprivation (1.013, 95% CI 1.012–1.014). Rurality (1.059, 95% CI 1.027–1.092) was also a strong predictor of suicide risk, where inhabitants in rural areas were found to be more likely to die by suicide.
Table 2 Regression Analysis set 1: effect of mental health quality and outcomes framework (QOF) quality of care on suicide over time (negative binomial model)a
SMI, severe mental illness.
a. 95% confidence intervals are in brackets; results are reported as incidence rate ratios (IRR) followed by P-values and standard errors in parentheses.
b. Mental health quality of care is measured as % achievement of the population in the relevant QOF indicators.
Discussion
Main findings and interpretation
After adjusting for key social and demographic characteristics, we found no association between primary care practice performance on incentivised mental health indicators and suicide rates in practice localities. Although depression and SMI are common among people who die by suicide, some people may not experience these symptoms and others may not be diagnosed by their GPs.Reference Mitchell, Vaze and Rao35 Not all people with mental illness see their GP in the year before death occursReference Luoma, Martin and Pearson4 and not all people with mental illness will be assessed or treated.Reference Pearson, Saini, Da Cruz, Miles, While and Swinson5 Nevertheless, GP-based efforts can have positive results in the reduction of suicide rates sometimes associated with an increase in antidepressant prescription.Reference Rutz, Vonknorring and Walinder36 One of the aims of incentivisation was to achieve better quality of care for people diagnosed with mental illnesses and, although suicide is rare, we might have expected to have observed small effects for a successful programme in that respect. For a dataset of this size, statistical significance is a secondary concern, as we should have been able to identify even a tiny effect – but there appeared to be none. Moreover, QOF mental health ‘quality of care’ scores do not inform as to care received in settings outside general practice. For example, 28% of people who die by suicide in the UK have had contact with mental health services in the previous 12 months;37 however, as this study focuses on aspects of mental healthcare in general practice we did not account for the important role of mental health and emergency services in preventing suicide. If local mental health services had been consistently beneficial and primary care services poor or vice versa, then the effect of the quality of primary care would be mitigated by the unknown effect of the quality of specialist mental healthcare in the same locality. Finally, even if high quality of mental health provision in primary care, as incentivised through the QOF, has a beneficial impact on patients overall this may not be apparent for important but relatively low frequency markers of population health such as death by suicide.
Our regression models have also indicated that area-level socioeconomic factors, such as social fragmentation and rurality, rather than variations in the quality of primary care, are more strongly associated with suicide risk. We identified a strong relationship between levels of deprivation and suicide for our study period. One additional percentage point in population deprivation is associated with a 1.3% (n = 52) increase in suicides nationally in 1 year. A change in IMD score from the 25th centile (9.57) to the median (17.07) would correspond to an 9.75% increase in suicide rates (n = 381). The extent of the relationship between deprivation and suicide is also highly consistent across the sensitivity analyses reported in the supplementary Appendix. Social fragmentation was a strong predictor of suicide, where one additional percentage point in social fragmentation is linked to 3.0% increase in suicide (n = 122) nationally in 1 year. These findings agree with previous evidence on the effects of deprivationReference Congdon27 and social fragmentationReference Congdon27, Reference Whitley, Gunnell, Dorling and Smith28 and also agree with previous evidence that showed that social fragmentation has a stronger association with suicide risk than deprivation.Reference Whitley, Gunnell, Dorling and Smith28
Additionally, we observed a moderate association between the prevalence of SMI and suicide across all models and all sensitivity analyses but small or no associations between prevalence of depression and risk of suicide. As this result may seem unusual we performed a univariate analysis for the associations between prevalence of SMI and depression with risk of suicide. The results from the univariate analysis indicate that prevalence of SMI has a strong effect on suicide (1.481, 95% CI 1.397–1.570) whereas prevalence of depression has a very small but statistically significant effect (1.005, 95% CI 1.003–1.008). The fact that unresolved depression register is weakly associated with suicide, despite the well-documented association between depression and suicide, may imply that the condition is not captured well in primary care. Misidentifications and missed cases in depression diagnosis are common in primary care.Reference Carey, Jones, Meadows, Sanson-Fisher, D'Este and Inder38 Moreover, it is suggested that GP's who work in socioeconomically deprived areas identify the ongoing management of depression as a burden and they may be reluctant to investigate psychosocial issues with their patients because of structural factors and workload.Reference Chew-Graham, Mullin, May, Hedley and Cole39
Strengths and limitations
This analysis was conducted at the population level and used a novel spatial estimation approach to assess and quantify the relationship between mental health quality of care and suicide rates for the whole primary care-registered population of England. This analysis allows for careful control of population characteristics at a low-level geographical area (LSOA), which is not possible with analyses at the general practice-level. We avoided standardising our outcome variable as standardised death by suicide ratios are imprecise at this low geographical (LSOA) level. Instead we adjusted our analysis for population structure by including all the relevant information on age and gender. This level of analysis was deemed to be optimal as aggregating data at higher geographical levels would introduce heterogeneity and confounding across small-area populations.
However, our study has a number of limitations. First, the possibility of ecological fallacy cannot be ruled out as the associations we observed at small-area level may not pertain to individual patients. Second, in essence we equated performance on the QOF mental health domain to quality of care for mental health, which is not necessarily the case. However, in the absence of other quantifiable metrics, this has become an accepted practice, although the QOF fails to capture other aspects of consultations that may be even more important.
Third, the IMD is by definition an aggregate measure of income, employment, health, education, crime and environmental deprivation in a locality. Thus, it is always collinear with measures of poor health and income, and these were necessarily excluded from our analysis. Fourth, we could not access population measures of ethnicity for all age groups and we included this variable as ‘% White’ at LSOA level. Fifth, we were unable to attribute practice performance to LSOAs for the first 2 years of the scheme (2004–05 and 2005–06), the period during which practices exhibited the largest improvements in performance,Reference Doran, Fullwood, Kontopantelis and Reeves22 because of data on mental health quality of care being unavailable. However, there was sufficient variation in quality of care at the LSOA level from 2006–07 to discern any association with suicide risk should it exist.
Sixth, any effects that the scheme might have had on suicide may have been delayed and the time window between mental health quality of care and suicide (i.e. 3-year lag model) could be too narrow. Nonetheless, analysis with longer lag periods is subject to methodological issues, while it seems clinically implausible that the indicators could have long-term preventive effects without short- or medium-term effects. Seventh, some degree of spatial autocorrelation was identified, but considering the very low value of the measure (Moran's I = 0.0049), we did not account for spatial autocorrelation in the model. Even if spatial clustering was present, we would expect it to be driven by socioeconomic factors we controlled for, and not by suicide cases in neighbouring areas, which would warrant the use of spatial regression techniques.
Eighth, multimorbidity and psychosocial risk factors for suicide (for example domestic abuse or substance misuse) may occur concomitantly with depression especially in deprived areas,Reference Elliott40 however, it is likely that these cases may not be captured adequately in the QOFReference Roland and Campbell15 and our measure of quality of mental healthcare as some of them will remain unrecorded. Ninth, recording of depression in English primary care has been described as being problematic, as some GPs prefer to record symptoms rather than formal psychiatric diagnostic labels,Reference Kendrick, Stuart, Newell, Geraghty and Moore41 but we believe this is unlikely to have affected the validity of our findings in relation to the primary research question. Finally, as death by suicide is used as an underlying indicator in the health and deprivation domain of the IMD, we used the IMD 2007 which was calculated from 2005 data on suicide deaths. Nevertheless, the various IMD versions have been documented to be highly correlated and thus the use of an old version of IMD should not have any implications for our findings.
Suicide prevention
Our study adds to a growing body of evidence on the potential impact of the QOF on patient outcomes, and is the first study to assess whether quality of primary care, measured as a proxy via metrics generated from a national incentive scheme, is linked with subsequent suicide risk at the population level. Our findings indicate that the scheme appears to have had no impact on suicide risk through the treatment and monitoring of depression and SMI, although population benefits in terms of improved quality of life and reductions in unnatural mortality risk may accrue in the longer term.
Suicide is a complex phenomenon and many factors may influence a person's decision to take their own life. In the absence of indicators related to suicidality and suicidal thoughts and acts, recognition of patients at risk of suicide depends entirely on the GP's ability to identify and interpret relevant signs. This may be extremely difficult without sufficient training as suicidal thoughts may be communicated differently across people at risk. This adds to concerns from GPs regarding the limited training that is provided to them regarding their role in preventing suicide.Reference Saini, Windfuhr, Pearson, Da Cruz, Miles and Cordingley42 Furthermore, the first few weeks following discharge from psychiatric in-patient care are characterised by increased suicide risk for patients37 and GPs stress the need to improve communication and information sharing between services, particularly in the cases of hospital discharge and transition between services.Reference Pearson, Saini, Da Cruz, Miles, While and Swinson5 It is vital to establish a collaborative model between GPs, mental health services, community care and hospitals, where improved communication and information sharing will be priorities. However, suicide prevention has never had a higher profile in the UK than at present. The Refreshed Suicide Prevention Strategy, the Health Select Committee Inquiry into Suicide Prevention and the NHS 5-year Forward Review provide a target of a 10% reduction in the national suicide rate. It is clear that effective suicide prevention requires a more concerted, multiagency approach, including better training in suicide prevention for primary care clinicians.
It is widely recognised that primary care has an important role to play in suicide prevention, but we found no association between practices' reported quality of care on mental health activities incentivised in the QOF and suicide rates in the local population. The QOF was a major national experiment, dwarfing in scale all previous attempts to incentivise high-quality care, but doubts on its impact and value mean that the UK is now retreating from using incentives in primary care, led by Scotland's decision to withdraw from the QOF in 2017. However, other countries continue to use incentives to improve population health, hoping to draw on the experiences of earlier schemes to develop more effective frameworks. If these attempts are to succeed, attention needs to be focused on those activities that contribute to improved patient outcomes, such as reductions in risk of dying prematurely from suicide, and those that will more accurately capture higher value care. More broadly, a better understanding is needed as to how resources can best be allocated to achieve higher quality of services that will lead to genuine improvements in population health outcomes.
Funding
This study is funded by the National Institute for Health Research School for Primary Care Research (NIHR SPCR), through C.G.'s PhD. This report is independent research by the National Institute for Health Research. L.M. acknowledges financial support from the MRC Skills Development Fellowship (MR/N015126/1). The views expressed in this publication are those of the authors and necessarily those of the NHS, the National Institute for Health Research, the Department of Health or the Medical Research Council.
Acknowledgements
We would like to thank the Office of National Statistics and NHS Digital (formerly the Health and Social Care Information Centre) for the wealth of information they have collected and systematically organised, which made this study possible.
Supplementary material
Supplementary material is available online at https://doi.org/10.1192/bjp.2018.143.


eLetters
No eLetters have been published for this article.