


Many of the clinical features of the syndrome of schizophrenia - in particular the negative signs and symptoms - can be explained as being due to dysfunction of the dorsolateral prefrontal cortex (Reference Goldman-RakicGoldman-Rakic, 1994; Reference WeinbergerWeinberger, 1988). Selemon et al (Reference Selemon, Rajkowska and Goldman-Rakic1995, Reference Selemon, Rajkowska and Goldman-Rakic1998) have reported that neuronal density is increased in this cortical area in schizophrenia and that the increase is specific to Brodmann areas (BA) 9 and 46 compared with BA 44 of Broca's area (Reference Selemon, Mrzljak and KleinmanSelemon et al, 2003). However, other studies, using different methods, have reported neuronal density in the dorsolateral prefrontal cortex to be unchanged (Reference Akbarian, Kim and PotkinAkbarian et al, 1995; Reference Cotter, Mackay and ChanaCotter et al, 2002) or reduced (Reference Benes, Davidson and BirdBenes et al, 1986); similarly, decreased neuronal size was reported in one subsequent study (Reference Pierri, Volk and AuhPierri et al, 2001), but not in another (Reference Cotter, Mackay and ChanaCotter et al, 2002). Here we investigated cell density, size and shape in the dorsolateral prefrontal cortex. We studied both sides of each brain, since all previous work had investigated a single (usually the left) hemisphere, and there is a body of anatomical evidence suggesting that schizophrenia is associated with a disturbance of cerebral asymmetry (Crow, Reference Crow1990, Reference Crow1997; Reference PettyPetty, 1999).
METHOD
Brains taken post-mortem from 10 people with schizophrenia and 10 comparison brains from individuals without mental illness were collected at three centres in the UK, as described by Highley et al (Reference Highley, Esiri and Cortina-Borja1998, Reference Highley, McDonald and Walker1999). The brains used in this study were selected from a larger series to include only individuals younger than 75 years at death, whose post-mortem interval was less than 72 h. Demographic details are summarised in Table 1. Diagnoses were made by T. J. Crow on review of the clinical notes to verify that there was clear evidence that the cases satisfied DSM-IV criteria for schizophrenia (American Psychiatric Association, 1994), and that the comparison group had no history of psychiatric or neurological disorder. All of the people with schizophrenia had been receiving long-term antipsychotic medication, seven had been given electroconvulsive therapy and three had received insulin coma treatment. Brains were fixed in 10% formalin by suspension from the basilar artery, and cut into 5 mm thick coronal slices. All brains were examined by a neuropathologist (M.M.E. or Dr B. McDonald, Department of Neurology, University of Oxford) to exclude macroscopic or microscopic neuropathology such as Alzheimer's disease (using the criteria of the Consortium to Establish a Registry for Alzheimer's Disease; Reference Mirra, Heyman and McKeelMirra et al, 1991), Parkinson's disease or stroke.
Table 1 Demographic details of sample
| Characteristics | Schizophrenia group | Control group |
|---|---|---|
| Weight of brain, g: mean (s.d.) | 1296 (151) | 1230 (154) |
| Weight of cerebrum, g: mean (s.d.) | 1051 (181) | 1068 (139) |
| Gender (male/female), n | 6/4 | 6/4 |
| Age at death, years: mean (s.d.) | 60 (14) | 60 (10) |
| Age at onset, years: mean (s.d.) | 28 (9) | |
| Duration of illness, years: mean (s.d.) | 31 (12) | |
| Post-mortem interval, h: mean (s.d.) | 36 (19) | 38 (17) |
| Time in formalin, months: mean (s.d.) | 89 (20) | 67 (12) 1 |
1. Significantly different: unpaired t=test P=0.006.
Blocks of tissue containing the superior and middle frontal gyri from the middle of both the right and left frontal lobes were embedded in 12% celloidin, sectioned at 60 mm and stained with cresyl violet. Shrinkage (assumed to be three-dimensionally uniform) associated with embedding in celloidin was estimated as follows: the cross-sectional area of the block was measured before and after embedding and staining; the volume of the block was inferred from these estimates of cross-sectional area: volume equals the square root of the area cubed, i.e. V=(√A)3. Shrinkage due to formalin fixation was not estimated.
Three sections per hemisphere per case (that is, three from the left and three from the right) were assessed. All sections were from the superior frontal gyrus exhibiting cytoarchitectural features of BA 9: that is, a thin layer 2, pyramidal cells in layer 3 gradually increasing in size with depth, bilaminar layer 5 and indistinct layer 6. Cell counts were made using an Olympus BX40 microscope and × 100 objective lens under oil. The microscope was connected to a video camera and the image displayed on a computer monitor. A guard was used, with guard depths at the top of the section set at a minimum of 10 μm. Cells were counted within an optically defined volume of tissue, based on the principle of the optical disector as described by Williams & Rakic (Reference Williams and Rakic1988), with a disector of 25 μm thickness. The dimensions of the ‘counting box’ were 39 μm × 31 μm × 25 μm, height being determined using a digital gauge (microcator) attached to the microscope stage. All neurons whose nucleoli were either completely within the counting box or intersecting the back, right or bottom of the box were counted. Neurons were not counted if their nucleoli touched the front, left or top of the box (for glia, the boundary of the cell was used to determine inclusion or exclusion in the counting box). Neurons with a triangular profile were considered to be pyramidal; all other neurons were classed as non-pyramidal. Neurons were distinguished from glia by the presence of Nissl substance and a clearly visible nucleolus. All cells (other than vessel-associated cells) were placed in one of the three categories: pyramidal, non-pyramidal or glial cells. Counting boxes were placed sequentially from the pial surface to the boundary between the grey and white matter, to give a single vertical probe extending through all six layers of the cortex. Five of these probes were positioned in areas exhibiting the cytoarchitectural features of BA 9 (Reference Rajkowska and Goldman-RakicRajkowska & Goldman-Rakic, 1995), where the plane of sectioning was perpendicular to the ‘grain’ of the cortical laminae and where there were no major tears or artefacts obscuring the cortex. Cell density was estimated in five probes in both the left and the right prefrontal cortex - i.e. ten probes per brain - to give an estimate of neuronal and glial density in each hemisphere overall and in each cortical lamina. This sampling protocol was chosen to mirror that of Selemon et al. An indication of the precision of the sampling protocol is given by the coefficient of error (CE), which was calculated in ten cases using the method of Braendgaard et al (Reference Braendgaard, Evans and Howard1990). A CE of less than 10% is considered acceptable. All estimates of neuronal density were performed masked to clinical details by one person (T.J.C.).
All estimates of neuronal density are reported after individual correction for shrinkage using the following formula: neuronal density = (average number of neurons per counting box/volume of the counting box) × (volume of block after embedding/volume of block prior to embedding).
Measurement of cell size and shape
Cell size and shape measurements were made masked to diagnosis using KS400.3 imaging software (Imaging Associates, Bicester, UK). Pyramidal neurons were sampled from layer 3 (easily identified from layers 2 and 4, having small pyramidal neurons at the top of layer 3, which ranged down to large pyramidal neurons at the bottom, and clearly distinct from the small circular interneurons of layer 4). Three sections were taken from each hemisphere of each brain. Pyramidal neurons were identified by their shape and the presence of a single, large apical dendrite extending vertically toward the pial surface. Three sweeps were made through layer 3 from each hemisphere, and pyramidal neurons were sampled systematically from the top to the bottom of layer 3. By focusing up and down through the section, we measured neurons only when they had a visible nucleolus, and this was the point at which the neurons had the greatest area. Measurements were made by manually tracing around the perimeter of the neuron, and cell area and shape (F circle, a function relating area to perimeter: 1 denoting a circle, 0 denoting a triangle; Reference Law and HarrisonLaw & Harrison, 2003) were calculated. An average of 120 (range 60-200) pyramidal neurons per brain were measured from each hemisphere.
Statistical analysis
A repeated-measures analysis of variance with side as the within-subject factor was performed to test for differences in overall neuronal and glial density and cortical thickness between the two groups. A P value of 0.05, two-tailed, was chosen as the threshold for statistical significance. This analysis was repeated separately for each cortical layer. For these post hoc analyses we used a Bonferroni correction of 6 to yield a significant P value of 0.0083, two-tailed. The possible confounding effects of duration in formalin, post-mortem interval, age at death, brain weight, age at onset and duration of illness were analysed using Pearson's correlation coefficient. Paired t-tests were used to compare cell sizes and shapes in layer 3 in right and left hemispheres.
RESULTS
Precision of the sampling protocol
The calculated coefficients of error for the estimates of pyramidal, non-pyramidal, neuronal (overall) and glial densities for this area of the cortex as a whole were all below 5%, indicating that this sampling protocol was sufficiently precise for these parameters. With the exception of layer 1, the CEs for the estimates of neuronal density (overall) for the individual cortical laminae were also less than 10% (range 2.3-9.5). It can be concluded that the precision of our estimates of neuronal density for layers 2 to 6 was adequate. The CEs calculated for the pyramidal neuronal density estimates were less than 10% only in layers 3, 5 and 6. The laminar analysis of non-pyramidal neuron and glial densities is not reported because the calculated CE for these parameters indicated that our sampling protocol did not estimate these parameters accurately, i.e. an insufficient number of non-pyramidal neurons and glia were counted per lamina (further information available from the author upon request).
Shrinkage
Embedding in celloidin resulted in variable shrinkage from brain to brain (pre- to post-embedding ratios 0.5 to 0.82), but the mean and scatter were closely similar in the two sample groups.
Neuronal density
The mean total neuronal density for the schizophrenia series was 35 000 (s.d.=6500) per mm3 on the left and 38 200 (s.d.=3600) per mm3 on the right; for the control series, the corresponding values were 41 500 (s.d.=8600) per mm3 and 36 200 (s.d.=5700) per mm3 respectively. In the control group brains total neuronal density was generally greater in the left hemisphere, the reverse pattern being observed in the schizophrenia brains (F=12.0, d.f.=1,18, P=0.003) (Fig. 1(a)). Overall total neuronal density - the average of left and right values - did not differ between the two series (F=0.78, d.f.=1,18, P=0.39) (Fig. 2(a)).
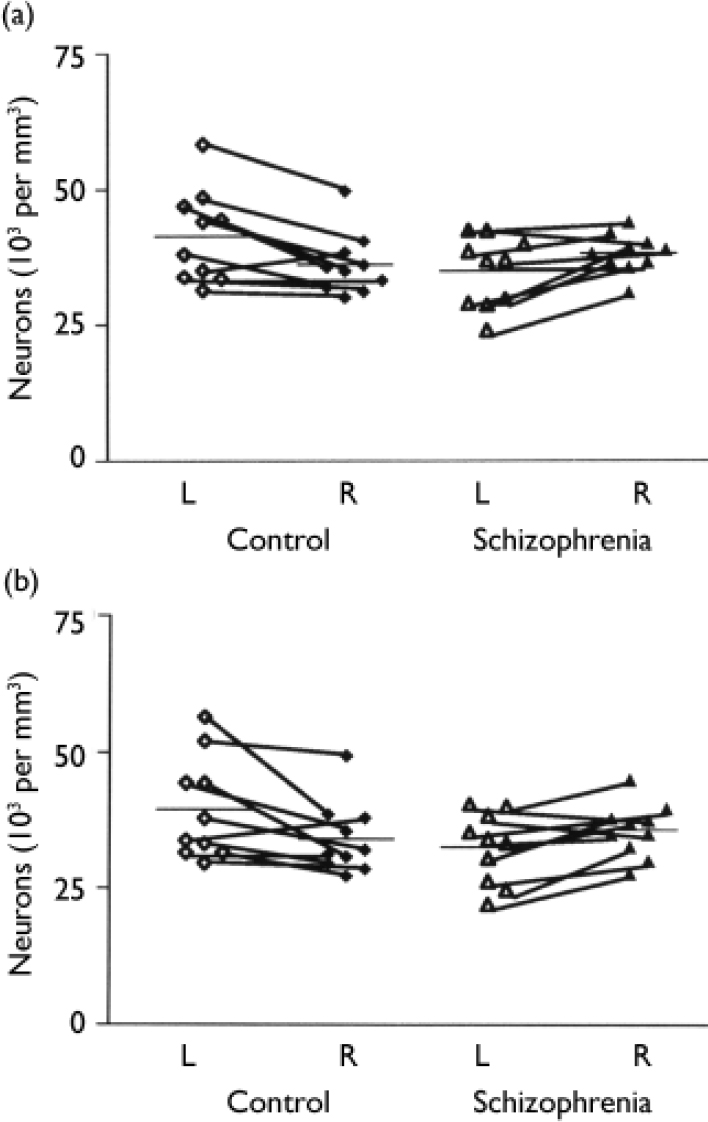
Fig. 1 (a) Overall neuronal density in left and right hemispheres of the schizophrenia and control group brains. (b) Neuronal cell density in layer 3 of the left and right hemispheres of the schizophrenia and control group brains.
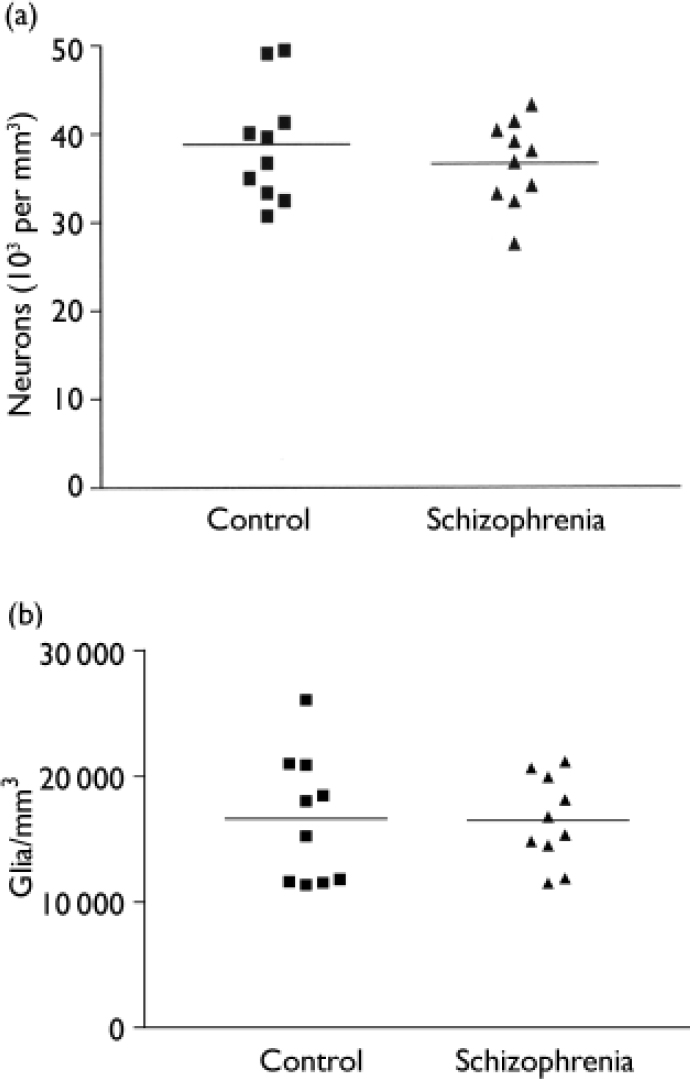
Fig. 2 Comparison of schizophrenia and control group brains. (a) Average neuronal density. (b) Glial density.
Table 2 gives the estimates for neuronal density for each cortical layer together with an analysis of the group and side comparisons. After Bonferroni correction, only layer 3 was significantly different in schizophrenia (see Fig. 1(b)), although there was a trend towards significance in layers 2 and 6. There was no correlation between neuronal density and age at death (r=0.228, d.f.=1.18, P=0.333), post-mortem interval (r=-0.299, d.f.=1,18, P=0.201) or time stored in formalin (r=-0.252, d.f.=1,18, P=0.285).
Table 2 Neuronal density
| Cortical | Density, neurons/mm3: mean (s.d.) | F 1 | d.f. | P 2 | ||||||
|---|---|---|---|---|---|---|---|---|---|---|
| layer | Schizophrenia | Comparison | ||||||||
| Left | Right | Left | Right | |||||||
| 1 | 15000 (5700) | 17000 (5300) | 19000 (5000) | 17000 (4500) | 4.54 | 1,18 | 0.047 | |||
| 2 | 67000 (12000) | 73000 (7900) | 78000 (18000) | 68000 (7600) | 7.57 | 1,18 | 0.013 | |||
| 3 | 33000 (6500) | 36000 (4900) | 40000 (9400) | 34000 (6600) | 12.9 | 1,18 | 0.002 3 | |||
| 4 | 54000 (15000) | 58000 (13000) | 62000 (14300) | 59000 (11300) | 1.049 | 1,18 | 0.319 | |||
| 5 | 34000 (6000) | 35000 (5300) | 40000 (10000) | 36000 (5700) | 2.184 | 1,18 | 0.157 | |||
| 6 | 30000 (6400) | 34000 (4600) | 34000 (8300) | 30000 (5800) | 6.23 | 1,18 | 0.022 | |||
1. F ratios represent the results of repeated-measures analysis of variance comparing the difference between right and left neuronal density between the schizophrenia and control brains.
2. Two-tailed (uncorrected).
3. Survives Bonferroni correction.
The mean pyramidal neuronal density for the schizophrenia group was 21 900 (s.d.=4000) per mm3 on the left and 25 600 (s.d.=3300) per mm3 on the right; for the comparison group the corresponding values were 24 700 (s.d.=5800) per mm3 and 23 100 (s.d.=3900) per mm3 respectively. Estimates of pyramidal neuronal density for each cortical layer and the results of statistical analysis are given in Table 3. Although there was a trend towards a significant effect in layers 3 and 6, the P values of 0.014 and 0.009 respectively were not significant after Bonferroni correction.
Table 3 Pyramidal neuronal density
| Cortical | Density, neurons/mm3: mean (s.d.) | F 1 | d.f. | P 2 | ||||||
|---|---|---|---|---|---|---|---|---|---|---|
| layer | Schizophrenia | Comparison | ||||||||
| Left | Right | Left | Right | |||||||
| 1 | 1180 (1690) | 1180 (823) | 814 (1230) | 713 (975) | 0.023 | 1,18 | 0.882 | |||
| 2 | 30500 (11000) | 38000 (11000) | 30100 (17000) | 27700 (14000) | 2.20 | 1,18 | 0.155 | |||
| 3 | 24200 (3600) | 26600 (3500) | 26800 (4400) | 24500 (4400) | 7.41 | 1,18 | 0.014 | |||
| 4 | 21900 (8900) | 30900 (11600) | 27700 (14000) | 27700 (9100) | 1.85 | 1,18 | 0.190 | |||
| 5 | 24700 (5800) | 26700 (5000) | 27200 (8100) | 27800 (4000) | 0.15 | 1,18 | 0.705 | |||
| 6 | 23600 (5600) | 27900 (4300) | 27300 (6100) | 25000 (3900) | 8.43 | 1,18 | 0.009 | |||
1. F ratios represent the results of repeated-measures analysis of variance comparing the difference between right and left pyramidal neuronal density between the schizophrenia and control brains. Analysis of the combined layers gives F=5.48, d.f.=1,18, P=0.031.
2. Two-tailed (uncorrected).
The mean density of non-pyramidal neurons in the schizophrenia group was 13 100 (s.d.=3700) per mm3 on the left and 12 600 (s.d.=2300) per mm3 on the right; for the comparison group the corresponding values were 16 800 (s.d.=6500) per mm3 and 13 100 (s.d.=3200) per mm3 respectively. These differences between groups and between sides were not significant.
Pyramidal cell size and shape
Table 4 gives the mean cross-sectional area of pyramidal neurons in cortical layer 3. Pyramidal neurons in layer 3 were larger on the left than the right in control brains (P < 0.008) but were equal in size on the two sides in the schizophrenia brains. Pyramidal cell size did not correlate with any of the demographic variables, although there was a trend towards a negative correlation with age at death (r=-0.432, d.f.=16, P=0.073). The index of pyramidal cell shape revealed an asymmetry in layer 3 (left > right), reflecting neurons being shorter and/or fatter in the left hemisphere in the comparison group, but with no asymmetry in the schizophrenia group.
Table 4 Cross-sectional area and shape of pyramidal neurons in cortical layer 3
| Schizophrenia | Comparison | |||||||||
|---|---|---|---|---|---|---|---|---|---|---|
| Left (n=9) | Right (n=9) | P | Left (n=10) | Right (n=9) | t (P) | |||||
| Pyramidal cell size, μm2: mean (s.d.) | 306 (33) | 300 (31) | 313 (37) | 294 (32) | ||||||
| Paired t-test | 0.64 | 3.485 (0.008) | ||||||||
| Pyramidal cell shape, mean (s.d.) | 0.66 (0.05) | 0.67 (0.06) | 0.64 (0.03) | 0.60 (0.05) | ||||||
| Paired t-test | NS | 3.27 (0.011) | ||||||||
Glial density
The overall glial density was 16 500 (s.d.=3460) per mm3 for the schizophrenia group and 16 600 (s.d.=5100) per mm3 for the comparison group. These values did not differ between the two groups (F=0.004, d.f.=1,18, P=0.950) (Fig. 2(b)). There was no correlation between glial density and age at death (r=-0.076, d.f.=1,18, P=0.749), post-mortem interval (r=0.002, d.f.=1,18, P=0.995) or time stored in formalin (r=-0.306, d.f.=1,18, P=0.189). Glial density correlated with overall neuronal density (r=0.52, d.f.=1,18, P=0.020) and pyramidal cell density (r=0.62, d.f.=1,18, P=0.004), but not with non-pyramidal cell density (r=0.22, d.f.=1,18, P=0.35).
Cortical thickness
Total cortical thickness did not differ between groups, nor did the proportion contributed by each cortical lamina (Table 5). Cortical thickness correlated inversely with overall neuronal density (r=-0.64, d.f.=18, P=0.002) and non-pyramidal neuronal density (r=-0.75, d.f.=18, P < 0.001), but not with pyramidal cell density (r=-0.28, d.f.=18, P=0.23) or glial density (r=-0.008, d.f.=18, P=0.973).
Table 5 Total cortical thickness and percentage contribution of each cortical layer to total thickness
| Schizophrenia | Comparison | F 1 | d.f. | P 2 | |||||
|---|---|---|---|---|---|---|---|---|---|
| Left | Right | Left | Right | ||||||
| Total cortical thickness, μm: mean (s.d.) | 2500 (290) | 2400 (320) | 2300 (270) | 2500 (250) | 1.75 | 1,18 | 0.203 | ||
| Contribution of each layer, %: mean (s.d.) | |||||||||
| Layer 1 | 12 (1.9) | 10 (1.7) | 11 (2.2) | 10 (1.4) | 0.72 | 1,18 | 0.41 | ||
| Layer 2 | 9.0 (2.1) | 8.4 (1.4) | 8.2 (1.4) | 7.3 (0.63) | 0.089 | 1,18 | 0.77 | ||
| Layer 3 | 41 (3.4) | 41 (4.2) | 40 (4.1) | 41 (3.9) | 0.050 | 1,18 | 0.83 | ||
| Layer 4 | 7.5 (1.6) | 7.9 (1.5) | 8.3 (0.87) | 7.5 (1.3) | 2.43 | 1,18 | 0.14 | ||
| Layer 5 | 15 (3.0) | 15 (2.2) | 16 (1.9) | 16 (1.9) | 0.15 | 1,18 | 0.70 | ||
| Layer 6 | 15 (3.4) | 17 (3.7) | 16 (3.8) | 18 (2.8) | 0.056 | 1,18 | 0.82 | ||
1. F ratios represent the results of repeated-measures analysis of variance comparing the difference between right and left cortical thickness (μm) between the schizophrenia and control brains.
2. Two-tailed, uncorrected.
DISCUSSION
In a series of ten brains from individuals with schizophrenia and ten comparison brains from individuals of similar age, we did not detect evidence of an overall increase in neuronal density in the prefrontal cortex in the disease group; instead, we found a decrease in neuronal density in the left hemisphere and an increase in density in the right hemisphere in comparison with controls, and that in these controls the density on the left was greater than that on the right. This finding can be interpreted as indicating either a left-sided reduction in neuronal density or a loss (or perhaps even a reversal) of cerebral asymmetry.
Our results contrast with those of Selemon et al, who found that in people with schizophrenia neuronal density was increased by 17% in left BA 9 (Selemon et al, Reference Selemon, Rajkowska and Goldman-Rakic1995, Reference Selemon, Rajkowska and Goldman-Rakic1998). We believe that methodological factors are unlikely to explain the differences between the findings, since both groups used similar methods: celloidin embedding and a nearly identical counting protocol. Furthermore, subtle differences in the delineation of anatomical areas are an improbable explanation, since Selemon et al found raised neuronal density in the area of cortex beside BA 9 (i.e. BA 46) and also in primary visual cortex, although in a subsequent study not in BA 44 (Reference Selemon, Mrzljak and KleinmanSelemon et al, 2003). Pakkenberg (Reference Pakkenberg1993) also found an increase in neuronal density in the frontal lobe considered as a single entity. It is possible that the differences between the findings in different studies relate to shrinkage; although shrinkage due to embedding varied markedly from case to case in our study, the mean shrinkage for each group was nearly identical.
A possible explanation for an increase in neuronal density is a reduction in the volume of grey matter observed in vivo in some magnetic resonance imaging studies of schizophrenia (Reference McCarley, Wible and FruminMcCarley et al, 1991). In our study and those of Selemon et al (Reference Selemon, Rajkowska and Goldman-Rakic1995, Reference Selemon, Rajkowska and Goldman-Rakic1998) cortical thickness correlated inversely with neuronal density. Cortical thickness was non-significantly reduced in the Selemon et al studies; in our study the cortex was not thinner and there was no evidence of a change that was selective to a particular cortical layer (see Table 5). Whether or not the changes observed in BA 9 by Selemon et al are attributable to a change in cortical width, this clearly cannot be the explanation for the decrease in density on the left side in our investigation. Our findings in the left hemisphere are similar to those of Benes et al (Reference Benes, Davidson and Bird1986), who noted a non-significant 27% reduction in neuron density in layer 3 - in addition to a significant reduction in neuronal density in layer 6 - of BA 10 of the prefrontal cortex in the brains of seven individuals with schizophrenia. (One of the strengths of the Benes et al study was that tissue shrinkage was minimised by cutting sections on a vibratome, thereby eliminating the need for paraffin embedding.) Cotter et al (Reference Cotter, Mackay and Chana2002) used a two-dimensional method to estimate neuronal density in BA 9 of the prefrontal cortex of the brains (hemisphere unspecified) of 15 people with schizophrenia and 15 normal controls. They found no evidence that neuronal density was altered in schizophrenia relative to controls.
We thus failed to confirm the hypothesis that schizophrenia is associated with an increase in neuronal density in the dorsolateral prefrontal cortex; instead, we found evidence of loss or reversal of asymmetry. We think it unlikely that a change that is differentially distributed between brain hemispheres is related to neuroleptic or other treatments that the patients might have received, and conclude therefore that it must in some way be related to the disease process. With other indices of morphological change in this brain series we have evidence of either a loss of asymmetry (e.g. in the pulvinar; Reference Highley, Walker and CrowHighley et al, 2003) or a reversal of asymmetry (e.g. in length measures over the dorsal surface of the cortex; Reference Highley, Esiri and Cortina-BorjaHighley et al, 1998) and of loss or reversal of asymmetry of the volume of the superior temporal gyrus (Reference Highley, McDonald and WalkerHighley et al, 1999) and the parahippocampal and fusiform gyri (Reference McDonald, Highley and WalkerMcDonald et al, 2000). The relative change in density of neurons in the two hemispheres (which survived Bonferroni correction) in layer 3 was paralleled by a loss of asymmetry of pyramidal cell size and shape. Thus the findings suggest an alternative to the pathophysiology proposed by Selemon et al - that the reduction in connectivity in schizophrenia is not generalised or specifically related to the dorsolateral prefrontal cortex (Reference Selemon, Mrzljak and KleinmanSelemon et al, 2003), but relates to the connections between the two hemispheres, or to differential changes within each hemisphere. Asymmetry of the Sylvian fissure was first reported by Eberstaller (Reference Eberstaller1884), and this and other asymmetries - for example of the planum temporale (Reference Geschwind and LevitskyGeschwind & Levitsky, 1968) - reflect a ‘torque’ or bias in the structure of the cerebral cortex across the anteroposterior axis from right frontal to left occipital (Reference Witelson, Kigar, Boller and GrafmanWitelson & Kigar, 1988). We assume that the torque is in some way related to the asymmetry in density of pyramidal and other cellular components of the cortex that we observe in BA 9 of dorsolateral prefrontal cortex. There is evidence, for example from the minicolumn structure of the planum, that these asymmetries distinguish the cerebral cortex of humans from that of other primates (Reference Buxhoeveden, Switala and LitakerBuxhoeveden et al, 2001). A number of macroscopic alterations of cerebral asymmetry have been reported in schizophrenia in imaging and post-mortem studies (Reference CrowCrow, 1990, Reference Crow1997; Reference PettyPetty, 1999; Reference Sommer, Ramsey and KhanSommer et al, 2001). Our study indicates that these have a correlate at the cellular level. If the primary change in psychosis is an anomaly of development of the relationship between the hemispheres, this is consistent with the concept that the disorder relates to those areas of the cerebral cortex (such as heteromodal association areas) that developed last in hominid evolution and go on developing late in ontogeny.
We note some previous evidence of neuronal size asymmetries in the literature. Hayes & Lewis (Reference Hayes and Lewis1995) reported that the large layer 3 pyramidal neurons that they identified in BA 45 of Broca's area were larger in the left hemisphere than in the right, as in the controls in the current study. By contrast, in the orbitofrontal cortex Cotter et al (Reference Cotter, Hudson and Landau2005) observed in individuals without mental illness asymmetry of cell size to the right. Interestingly, this asymmetry was reversed (cell size was smaller on the right than on the left) in both patients with bipolar disorder and major depression, but unchanged in patients with schizophrenia.
Clinical Implications and Limitations
CLINICAL IMPLICATIONS
-
▪ Previous reports of a uniform increase in neuronal density in dorsolateral prefrontal cortex in schizophrenia are not replicated.
-
▪ Subtle asymmetries of pyramidal cell density, size and shape in individuals without mental illness are reversed or lost in people with schizophrenia.
-
▪ The findings are consistent with the loss/reversal of cerebral asymmetry hypothesis of pathophysiology at the cellular level.
LIMITATIONS
-
▪ This is a relatively small study (10 v. 10 brains).
-
▪ Only one area (Brodmann area 9) of the dorsolateral prefrontal cortex has been assessed.
-
▪ Gender differences have not been investigated.
Acknowledgements
This work was supported by the Wellcome Trust and the UK Medical Research Council.


eLetters
No eLetters have been published for this article.