


The main guarantee of success of any educational system is the effective learning of basic reading, writing, and math skills. Unfortunately, not all students acquire an adequate performance in the early grades. Longitudinal studies carried out in transparent orthographies have demonstrated that there are numerous measures such as print knowledge, phonological awareness, and alphabetic knowledge that can predict reading disabilities (Bigozzi et al., Reference Bigozzi, Tarchi, Caudek and Pinto2016; Lyytinen et al., Reference Lyytinen, Erskine, Hämäläinen, Torppa and Ronimus2015). Likewise, by using number-magnitude mapping and symbolic numerical tasks (i.e., number line, symbolic comparison, and place-value understanding), it is possible to identify up to 79% of children with difficulties in mathematics (Wong & Chan, Reference Wong and Chan2019). These findings suggest the importance of evaluating and intervening early in these skills to prevent learning disabilities (LD) in reading and math.
According to the most recent report published by the Spanish Ministry of Education about specific educational supports for students with LD within the educational system, the psychoeducational assessment of possible difficulties to learn the basic skills (i.e., reading, writing, and math) is carried out by the end of second grade (Grañeras et al., Reference Grañeras, Lucio-Villegas, Díaz-Caneja, Gómez, de Andrés, Rodríguez, Cerveira, Gallego, Defior, Fernández-Zúñiga, Cuetos and Jiménez2012). Then, we must wait at least two years to verify that we are facing an instructional mismatch that might confirm an LD diagnosis.
Thereby, the detection and early intervention of LD have been included as a main priority in the Spanish educational legislation (Boletín Oficial del Estado, 2013). In the Canary Islands, a Spanish autonomous region located between three continents and composed of seven islands in the Atlantic Ocean, this priority is justified when we consider the average student achievement scores of the last decade. According to data from the Canary Statistical Institute (Instituto Canario de Estadística [ISTAC], 2017), 7.2% of 8-year-old students at the end of Grade 2 were eligible for early intervention to avoid grade repetition. To address this challenge, it is necessary to provide specialized training to teachers who help these students with these academic skills. Similarly, educational administrators at schools need to supervise students who may or may not be at risk.
We need to ask ourselves the following question: Could a Response to Intervention (RtI) framework be an alternative to improve the academic performance of these students? It has been suggested that an RtI approach is probably the best opportunity to improve education for all students in general, and in particular for those students at risk of experiencing LD (Tilly, Reference Tilly2006). Two RtI approaches for the prevention and intervention of academic and social problems have emerged: Standard-treatment protocols and problem-solving models (Lerner & Johns, Reference Lerner and Johns2012). In the present study, we followed a standard-treatment approach, which requires the use of the same empirically validated treatment for all children with similar problems in a given domain (Fuchs et al., Reference Fuchs, Mock, Morgan and Young2003). The advantage of this approach is a clear lack of ambiguity, which streamlines decision-making for school staff. With scripted protocols, everyone knows what to do; thus, treatment fidelity should be maximized (Fuchs et al., Reference Fuchs, Fuchs and Stecker2010). RtI model is organized into four essential components: (a) Multi-level preventive system, (b) universal screening, (c) progress monitoring, (d) and data-based decision making (National Center on Response to Intervention [NCRTI], 2010). The multi-level prevention system is organized in three levels or tiers (i.e., Tier 1, 2, and 3), with the quality and intensity of the intervention increasing along the tiers. Tier 2 intervention refers to additional instruction provided to students who are not meeting the grade-level standards (Fuchs & Vaughn, Reference Fuchs and Vaughn2012). Tier 2 intervention is explicit and systematic and occurs in small groups from 3 to 5 students (Gersten et al., Reference Gersten, Haymond, Newman-Gonchar, Dimino and Jayanthi2020). In a review of studies on the Tier 2 RtI implementation, Gersten et al. (Reference Gersten, Haymond, Newman-Gonchar, Dimino and Jayanthi2020) concluded that approximately 30 minutes of small group instruction per day (3-5 days per week) is highly effective for students who are struggling or having difficulties with learning to read. It has also been shown that this intervention, when is carried out from 3 to 5 days a week (Fuchs & Vaughn, Reference Fuchs and Vaughn2012), throughout 10 to 15 weeks of intervention, with a session duration of 20 to 40 minutes (Lembke et al., Reference Lembke, Hampton and Beyers2012; NCRTI, 2010) is also effective for students at risk for mathematics failure.
In this context, teachers require ongoing training to ensure that they know how to implement early identification and intervention successfully. What teachers know about the content they teach has been an important area of study in teacher cognition research (Loewenberg Ball et al., Reference Ball, Thames and Phelps2008). Shulman (Reference Shulman1987) divided the knowledge base of teaching into seven categories. One of these categories, content knowledge, includes knowledge of the subject and its organizing structures. Different studies have found that teachers’ knowledge has a direct impact on student performance (McCutchen et al., Reference McCutchen, Abbott, Green, Beretvas, Cox, Potter, Quiroga and Gray2002; Moats & Foorman, Reference Moats and Foorman2003). Therefore, successful implementation of RtI begins with ensuring the effectiveness of teacher professional development, and meetings directed toward principals, general education teachers, special education teachers, school psychologists, and school supervisors to be familiar with RtI requirements (Grosche & Volpe, Reference Grosche and Volpe2013).
Implementing RtI Tier 2 in the Spanish Language
Most of the studies on RtI reading intervention come from English-speaking countries. A systematic review of less extensive, Tier 2 type interventions at the early elementary level (kindergarten through 3rd grade) has been conducted demonstrating positive effects on both standardized and non-standardized measures of foundational reading skills, and standardized measures of language/comprehension (Wanzek et al., Reference Wanzek, Vaughn, Scammacca, Gatlin, Walker and Capin2016). Nevertheless, there are fewer studies in a monolingual Spanish-speaking population (Crespo et al., Reference Crespo, Jiménez, Rodríguez, Baker and Park2018; Jiménez et al., Reference Jiménez, Rodríguez, Crespo, González, Artiles and Alfonso2010). Jiménez et al. (Reference Jiménez, Rodríguez, Crespo, González, Artiles and Alfonso2010) conducted a pilot study examining the effectiveness of the Program for the Prevention of Specific Learning Difficulties in Reading ([PREDEA] by its acronym in Spanish) in grades K-2. The results revealed that the experimental group achieved higher scores than the control group in a phonological awareness task (i.e., isolating the first sound of the word), letter-sound knowledge, and oral reading fluency. However, the source of variation due to school was not taken into account in this study. In a second study, Crespo et al. (Reference Crespo, Jiménez, Rodríguez, Baker and Park2018) analyzed the effects of PREDEA by comparing the growth of students using the Hierarchical Linear Modeling (HLM), controlling the variability due to the subject (2nd level of the HLM) and school (3rd level of the HLM). The authors found significant differences between the experimental group and the control group in vocabulary tasks in kindergarten, and in phonological awareness tasks in kindergarten and 1st grade. However, they did not assess the fidelity of implementation. Consequently, none of the reading studies in Spanish above mentioned took into account many of the methodological features that need to be considered to validate the effectiveness of RtI Tier 2 intervention (e.g., teacher professional development, absence of standardized universal screening tools in the local population, monitoring of learning progress, comparison of the experimental and control groups in Tier 1 in terms of teaching practices in the school and family context, socioeconomic factors, fidelity of implementation).
Although there are few studies focused on Tier 2 math interventions in the early grades of primary school (i.e., 1st to 3rd grade), all of them also come from English-speaking countries. Most have pointed out the efficacy of Tier 2 interventions to improve the learning rate of students at-risk for math failure (e.g., Bryant, Bryant, Gersten, Scammacca, & Chavez, Reference Bryant, Bryant, Gersten, Scammacca, Funk, Winter, Shih and Pool2008; Bryant, Bryant, Gersten, Scammacca, Funk, et al., Reference Bryant, Bryant, Gersten, Scammacca and Chavez2008; Clarke et al., Reference Clarke, Doabler, Strand Cary, Kosty, Baker, Fien and Smolkowski2014; Dennis, Reference Dennis2015; Dennis et al., Reference Dennis, Bryant and Drogan2015; Doabler et al., Reference Doabler, Clarke, Kosty, Turtura, Firestone, Smolkowski, Jungjohann, Brafford, Nelson, Sutherland, Fien and Maddox2019; Fuchs et al., Reference Fuchs, Compton, Fuchs, Paulsen, Bryant and Hamlett2005; Strand Cary et al., Reference Strand Cary, Clarke, Doabler, Smolkowski, Fien and Baker2017). In addition, a meta-analysis revealed that most of the intervention programs carried out in RtI Tier 2 intervention focused on early basic math skills, finding a positive effect on the performance of students from first to third grade of primary education detected with difficulties in this area (Dennis et al., Reference Dennis, Sharp, Chovanes, Thomas, Burns, Custer and Park2016).
In sum, English studies seem to offer empirical support to less extensive, Tier 2 type interventions at the early elementary level. Although there are no Spanish studies on RtI Tier 2 math intervention, we have also taken into account the methodological features that need to be considered to validate the effectiveness of RtI Tier 2 intervention. Therefore, this study aims to explore the effectiveness of a Tier 2 RtI approach implemented by teachers in elementary school. For this purpose, a Tier 2 or secondary intervention was implemented by Spanish teachers in grades K-1 (Reading program) and 1-3 (Math program) within an RtI framework. In order to ensure that all teachers had the knowledge to carry out the students’ identification and intervention successfully, they were provided with a support system that included a web-based training program in reading (i.e., Letra program) or math (i.e., Primate program). Information about teachers’ reading or math practices, familiar socioeconomic status, and home literacy or numeracy environment was collected from participants in the experimental and control groups. Implementation fidelity was analyzed using direct observations and self-reports; interventions were implemented by in-service teachers, offering a greater ecological validity than interventions implemented by researchers or trained interventionists. To our knowledge, this is the first study conducted in a Spanish-speaking country implementing a RtI Tier 2 approach, overcoming methodological limitations of previous studies, to address the needs of children who are manifesting reading or math difficulties in the early grades. Accordingly, this study addresses the following research questions:
Research Question 1: Is the RtI Tier 2 intervention capable of causing differences in the growth rate of reading and math performance (grades K-1st, 1st-3rd, respectively) between Spanish at-risk students who have received the intervention and those who have not received it?
Research Question 2: Is the RtI Tier 2 intervention effective to reduce the risk of reading or math difficulties (grades K-1st, 1st-3rd, respectively) when is implemented by in-service teachers?
Method
Participants
Schools
A total of 125 state schools in the Canary Islands participated in the study: 62 schools in the experimental group (EG) for the Reading program, 48 EG schools for the Math program, and 15 control group (CG) for both programs. In order to guarantee that both groups were equivalent in terms of socioeconomic level, the selection and control was carried out by the educational administration itself through the Agencia Canaria de Calidad Universitaria y Evaluación Educativa ([Canarian Agency for University Quality and Educational Evaluation]) from Canarian Government.
Students
Figure 1 shows the overall sample study for both Reading and Math programs.

Figure 1. Description of the Study Sample for both Reading and Math Programs
At-risk Students. For the Reading program, students on the experimental group and the control group were identified as at-risk by using a composite score of the curriculum-based measurement (CBM) Indicadores de Progreso de Aprendizaje en Lectura (IPAL) ([Indicators of Basic Early Reading Skills] Jiménez & Gutiérrez, Reference Jiménez, Gutiérrez and Jimenez2019) in the fall and/or winter, calculated by averaging unweighted standardized subtest scores (percentile ≤ 25) and a specific cut-off score with sensitivity above .80. For the Math program, this same criterion was used for the CBM Indicadores de Progreso de Aprendizaje en Matemáticas (IPAM) ([Indicators of Basic Early Math Skills] Jiménez & de León, Reference Jiménez, de León and Jimenez2019), except that the percentile score was different (percentile ≤ 20). For both programs, only students in the experimental group identified as at-risk were considered eligible for Tier 2 intervention. In the Reading program, 225 at-risk kindergarteners (47% girls and 53% boys; November age M = 5.18, SD = 0.27) and 317 at-risk 1st graders (48% girls and 52% boys; November age M = 6.26; SD = 0.38) received the Tier 2 intervention, while 212 kindergarteners (52% girls and 48% boys; November age M = 5.24, SD = 0.29) and 194 1st graders (49% girls and 51% boys; November age M = 6.32; SD = 0.39) where detected at-risk in the control group. In the Math program, 250 (51% girls and 49% boys; November age M = 6.30, SD = 0.35), 189 (47% girls and 53% boys; November age M = 7.42, SD = 0.44), and 44 (57% girls and 43% boys; November age M = 8.50, SD = 0.40) at-risk students in 1st, 2nd, and 3rd grade, respectively, received the Tier 2 intervention, while 238 (53% girls and 47% boys; November age M = 6.33, SD = 0.33), 158 (49% girls and 51% boys; November age M = 7.36, SD = 0.36), 96 (54% girls and 46% boys; November age M = 8.56, SD = 0.46), where detected at-risk in the control group. Although both researcher assistants and teachers received the same instruction about how to administer the CBM to the students, some differences were observed in the risk prevalence rate between the experimental and control groups. These differences could be related to the experience in the administration of assessment tools.
Classroom Teachers
General classroom teachers for both programs voluntarily filled out a questionnaire about the teaching practices in reading or math that they carried out in their classrooms. For Reading program, a total of 114 tutors from the general classroom (i.e., Tier 1), 104 in the EG and 10 in the CG, filled out the questionnaire, while for Math program, a total of 126 teachers, 105 in the EG and 21 in the CG, volunteer to complete the questionnaire.
Teachers who Carried out the Intervention in Reading and Math Programs
For Reading program, a total of 62 in-service teachers participated in the study (91.6% female and 8.4% male). The intervention teachers mainly had the specialty of pedagogical updating (37.1%), therapeutic pedagogy (25.2%), classroom tutors (17.7%), and teachers that were members of the school management staff (6.5%). For Math program, 48 in-service intervention teachers participated in the current study (87.5% females, and 12.5% males). 39.6% had the specialty of pedagogical updating, 18.8% had the therapeutic pedagogy specialty, 25% were classroom tutors, 14.6% were members of the school management staff, and 2% were specialist teachers (i.e., music, physical education, or foreign language teachers). All teachers taught reading and math in Spanish. Most of the intervention teachers were part of the Red de Centros Innovadores para la Continuidad Escolar - Programa Infancia [Network of Centers for School Continuity- Childhood Program] that depends on the Department of Education of the Government of the Canary Islands, and their dedication was focused on participating in the program, receiving training and providing support to students inside or outside the classroom depending on the decision of each school. The rest of the intervention teachers could participate if they had the time required for the support sessions. Those children who received the intervention outside the classroom, once the session ended, they returned to the ordinary classroom to receive the core program.
Families
For the Reading program, a total of 1,386 families answered the questionnaire on early literacy practices at home. The EG included 1,176 families (kindergarten = 39.5%, 1st grade = 60.5%), while the CG included 210 families (kindergarten = 56.2%, 1st grade = 43.8%). For the Math program, a total of 2,115 families participated in this study by filling out a questionnaire on home numeracy practices. Both questionnaires are described below in the measures section. The EG included 1702 families (1st grade = 36.5%, 2nd grade = 37.4%, and 3rd grade = 26.1%), while the CG included 413 families (1st grade = 27.6%, 2nd grade = 36.8%, and 3rd grade = 35.6%). Regarding the socioeconomic aspects for Reading sample, the hypothesis testing contrast through Pearson’s test χ2 revealed that there were no significant differences between the groups in the father’s income χ2(4) = 3.75; p = .44, the mother’s income χ2(4) = 5.78; p = .22, or the father’s education level, χ2(6) = 7.20; p = .30. However, the analysis revealed differences between groups in the mother’s education level, χ2(6) = 13.51; p = .04. A frequency analysis was performed for each range in the category to find where the differences were. Both groups have a similar percentage of uneducated mothers, with primary studies, and higher degrees. The main differences were found in the school graduate and the diploma. Furthermore, non-differences were found between families’ incomes in the math sample, fathers, χ2(3) = 4.95, p = .176; mothers, χ2(3) = 2.92, p = .404, nor in the educational level, fathers, χ2(1) = 2.47, p = .116; mothers, χ2(1) = .86, p = .353.
Measurements
Student Reading Outcomes and Instruments
Reading Screening Measures. In order to detect the risk status of the students and compare the growth curves between the experimental group at-risk (EGR) and the control group at-risk (CGR), the three alternate forms of screening (i.e., fall, winter, spring) of the CBM Indicators of Basic Early Reading Skills (IPAL) were administered to kindergarten and 1st grade-students. In kindergarten, IPAL includes the following measures: Alphabetic knowledge, phonological awareness, concepts about print-questions, concepts about print-images, and riddles. In 1st grade, IPAL includes the following measures: Alphabetic knowledge, phonological awareness, concepts about print-questions, non-sense words fluency, maze sentences, and oral reading fluency. All these measures were individually administered to the students. The validity and reliability of the IPAL have been widely analyzed (Gutiérrez et al., Reference Gutiérrez, Jiménez, de León and Seoane2020; Gutiérrez et al., Reference Gutiérrez, Jiménez and de León2021). The composite score of the IPAL has shown significant and positive indexes of alternate-form reliability (kindergarten r = .66 to .78; 1st r = .87 to .91) concurrent (kindergarten r = .76; 1st r = .85) and predictive validity (kindergarten r = .57 to .75; 1st r = .71 to .80) (Gutiérrez et al., Reference Gutiérrez, Jiménez, de León and Seoane2020; Gutiérrez et al., Reference Gutiérrez, Jiménez and de León2021). ROC curve analysis revealed Areas Under the Curve (AUCs) from .83 to .97 in kindergarten and .97 to .98 in 1st grade (Gutiérrez et al., Reference Gutiérrez, Jiménez, de León and Seoane2020; Gutiérrez et al., Reference Gutiérrez, Jiménez and de León2021).
Student Math Outcomes and Instruments
Math Screening Measures. Students were administered the CBM Indicators of Basic Early Math Skills (IPAM) for 1st, 2nd, and 3rd grade. The IPAM includes three alternate forms (i.e., fall, winter, and spring) of five screening measures: Quantity discrimination (QD), multi-digit computation (MC), missing number (MN), single-digit computation (SC), and place value (PV). The validity and reliability of the IPAM have been widely analyzed (de León et al., Reference de León, Jiménez, García and Gutiérrez2021; de León, Jiménez, García et al., Reference de León, Jiménez, García, Gutiérrez and Gil2020; de León, Jiménez, & Hernández-Cabrera, Reference de León, Jiménez and Hernández-Cabrera2020). The IPAM has shown adecuate indexes of alternate-form reliability (1st r = .77 to .80; 2nd r = .71 to .82; 3rd r = .86 to .90) concurrent (1st r = .69; 2nd r = .71; 3rd r = .56) and predictive validity (1st r = .61 to .64; 2nd r = .59 to .69; 3rd r = .46 to .51) (de León et al., Reference de León, Jiménez, García and Gutiérrez2021; de León, Jiménez, García et al., Reference de León, Jiménez and Hernández-Cabrera2020). Confirmatory Factor Analysis were performed to explore the IPAM construct validity, showing adequate fit indexes: χ2, p > .05; TLI ≥ .95; CFI ≥ .95; RMSA ≤ .06; SRMS ≤ .08 (de León, Jiménez, & Hernández-Cabrera, Reference de León, Jiménez and Hernández-Cabrera2020; Jiménez & de León, Reference Jiménez and de León2017a; Jiménez & de León, Reference Jiménez and de León2017b,). ROC curve analysis revealed Areas Under the Curve (AUCs) from .83 to .87 in 1st grade, .91 to .96 in 2nd grade, and .77 to .80 in 3rd grade (de León et al., Reference de León, Jiménez, García and Gutiérrez2021; de León, Jiménez, García et al., Reference de León, Jiménez and Hernández-Cabrera2020).
Home and Teacher’s Literacy Practices
Early Literacy Practices at Home Questionnaire. To control the influence of socioeconomic status and early home literacy practices, the questionnaire was designed considering the components of the Home Literacy Model (Sénéchal & LeFevre, Reference Sénéchal and LeFevre2002). The first part consisted of a survey of the parents’ educational and income levels. The second part of the questionnaire consisted of 18 items measuring the frequency of home literacy practices using a 4-point Likert scale (α = .78). These items were constructed by trying to evaluate four dimensions of the home literacy practices: Motivational, functional, recreational, and instructional. A Confirmatory Factor Analysis was conducted to analyze the construct validity of the questionnaire, and the fit of the data to the proposed two-level factor structure was confirmed, χ2 = 820.38, df = 131, p < .001, χ2/df = 6.25; CFI = .97, TLI = .97, RMSEA = .07, 90% CI [.06, .07], SRMR = .06. The reliability analysis revealed suitable indices for the second-order factor Early Literacy Practices at Home (ω = .87), and for each of the first-order factors (instructional, ω = .79; recreational, ω = .76; functional, ω = .80; and motivational, ω = .83). The ANOVA of a repeated measures factor and an intergroup factor (i.e., control and experimental) revealed that the interaction between both factors was not significant F(2, 95) = 1.36, p = .25, confirming that there were no differences between EG and CG in the early literacy practices at home.
Reading Teaching Practices Questionnaire (Jiménez, Reference Jiménez1986). This questionnaire contained information corresponding to different approaches to teaching reading that support bottom-up (e.g., phonics instruction) or top-down processes (e.g., whole language approach). It is made up of 17 items with a 3-point scale about the frequency with which teachers use different practices for teaching reading (α = .84). A Confirmatory Factor Analysis was conducted to analyze the construct validity of the Reading Teaching Practices Questionnaire. Goodness-of-fit-indices indicated an adequate fit for the questionnaire: χ2 = 132.9, df = 117, p = .001; χ2/df = 1.13; CFI = .94; TLI = .93; RMSEA = .03, SRMR = .07, 95% CI [.0, .06]. While the first factor represents the whole language instruction, the second factor represents the phonics instruction. The reliability analysis revealed suitable indices for each of the first-order factors (whole language, ω = .82; phonics, ω = .77). The ANOVA revealed that the interaction was not significant F(1, 112) = 3.12, p =.08, confirming that there were no differences between EG and CG in their reading teaching practices.
Home and Teacher’s Numeracy Practices
Home Numeracy Questionnaire (Peake, Reference Peake2015). The first part consisted of a survey of the parents’ educational and income levels. The second part of the questionnaire consisted of 30 items with a 4-points scale about the frequency with which they do formal and informal numeracy activities on their own or with their children (α = .85). A CFA was conducted to analyze the construct validity of the scale, and the goodness-of-fit-indices indicated an adequate fit for the proposed two-level factor structure: χ2 = 348.02, df = 166, p = .001; χ2/df = 2.09; CFI = .92; TLI = .91; RMSEA = .04, SRMR = .04, 95% CI [.03, .05]. The reliability analysis revealed suitable indices for the second-order factor Early Math Practices at Home (ω = .84), and for each of the first-order factors (recreational, ω = .63; student capacity, ω = .76; self-perception of parental figure, ω = .76; and familiar support, ω = .54). Similar results to those found in early literacy practices at home were also obtained for early numeracy practices at home because the interaction was not significant either F(2, 89) = 1.03, p = .37.
Math Teaching Practices Questionnaire (Jiménez, Reference Jiménez2020). This questionnaire includes ten scales: (1) Teachers’ activities to teach math (4 items, α = .79), (2) collaboration among teachers (8 items, α = .90), (3) importance of the basic contents (6 items, α = .84), (4) instructional strategies in numbers and their relationship (13 items, α = .93), (5) instructional strategies in addition and subtraction (8 items, α = .93), (6) instructional strategies in multiplication and division (8 items, α = .96), (7) instructional strategies in problem-solving (5 items, α = .87), (8) assessments (6 items, α = .87), (9) homework (6 items, α = .89), and (10) motivation (6 items, α = .80). All the scales are 5-point Likert scale. In the analysis of Math Teaching Practices Questionnaire, scales 4, 9, and 10 showed adequate model fit, with a significant χ2(p < .01), and model fit indices greater than .95 (i.e., CFI, TLI), the higher RMSEA index at .06, and the SRMR index less than .08. The rest of the scales showed an absolute fit of the model, when all the fit indices of the model were met, with χ2 not significant (p > .05), the fit indices of the model being above .95 (i.e., CFI, TLI), the RMSEA index less than .06, and the SRMR index less than .08. Similar results to those found in teaching practices in reading were obtained for teaching practices in math because the interaction was not significant either F(4, 76) = 1.59, p = .16.
Dimensions of Intervention
Support System
Web-based Training Program (WBT). One of the most important tools within the support system component to ensure fidelity is the training of teachers who will launch the implementation of the RtI model (Johnson et al., Reference Johnson, Mellard, Fuchs and McK-night2006). The principal aim is to give teachers the knowledge and strategies to effectively carry out the RtI model in their classrooms when teaching reading or math. For Reading program, teachers were enrolled in the Letra WBTFootnote 1 (Jiménez et al., Reference Jiménez, Rodríguez, González, O’Shanahan, Guzmán and Suárez2020). Letra includes three modules: theoretical, assessment, and intervention. The theoretical module includes information about the RtI model, reading LD prevention and intervention, and teaching strategies for phonemic awareness, alphabetic knowledge, vocabulary, fluency, and comprehension. The assessment module provides information about the use and administration of the IPAL (Jiménez et al., Reference Jiménez, Rodríguez, González, O’Shanahan, Guzmán and Suárez2020). Finally, the intervention module includes information on how to act within RtI Tier 2 using IAERI [Instructional Activities for Early Reading Improvement] (Jiménez, Rodríguez et al., Reference Jiménez, de León and Jimenez2019). For math program, teachers were enrolled in the online formative program Primate Footnote 2 (Jiménez, Reference Jiménez2020). Primate includes three modules: Theoretical, assessment, and intervention. The theoretical module includes seven tutorials: Math learning disabilities (MLD) and RtI model, basic principles of instruction in MLD, numbers, computation, and problem-solving. The assessment module provides information about the use and administration of the IPAM (Jiménez, Reference Jiménez2020). Finally, the intervention module includes information on how to act within RtI Tier 2 using IAEMI [Instructional Activities for Early Math Improvement] (Jiménez, Villarroel, et al., Reference Jiménez, Villarroel, Bisschop and Jiménez2019). In each of the theoretical training tutorials, teachers had to repeat the following steps: 1) Answer the previous knowledge questionnaires on that section (i.e., pretest); 2) see at least three times each theoretical tutorial; 3) answer the evaluation questionnaires of each tutorial (i.e., posttest).
For Letra WBT, the analyses revealed a significant effect, F(6, 56) = 95.71; p < .001, η2p = .91, of the intra-subject factor (i.e., pretest and posttest) on the set of dependent variables (i.e., RtI, phonemic awareness, alphabetic knowledge, vocabulary, fluency, and comprehension modules). For Primate WBT, results revealed a significant effect, F(7, 41) = 107.6, p < .001, η2p = .94 of the intra-subject factor (i.e., pretest and posttest) over the dependent variables (i.e., MLD and RtI model, basic principles of instruction in MLD, numbers, computation, and problem-solving).
Corrective Reading Program. The IAERI (Jiménez, Rodríguez et al., Reference Jiménez, Rodríguez, González, Crespo, O’Shanahan, Guzmán, Suárez and Jiménez2019) is included in the Letra WBT. It is a structured Tier 2 reading intervention designed based on the principles of systematic and explicit instruction and the use of modeling, scaffolding, and feedback (Gersten, Compton, et al., Reference Gersten, Beckmann, Clarke, Foegen, Marsh, Star and Witzel2009). It includes structured activities and materials based on the development of phonological awareness, alphabetic knowledge, vocabulary, fluency, and comprehension. The IAERI includes instructional activities presented as a worksheet that collects the necessary materials and the instructional sequence to carry it out:
1. Activity presentation (give to the student information about the content of the lesson before it beginning).
2. Modeling (provide the student examples of how to represent domain content).
3. Group guided practice (every child watches a teacher model how to solve the task. Students ask questions until they are able to understand. Then, the teacher turns over the task to the students).
4. Corrective feedback (students receive feedback aimed to improve their performance).
5. Individual guided practice (each student solves the task alone in their own sheet).
6. Corrective feedback (students receive feedback aimed to improve their performance).
7. Independent practice (each student solves the task alone in their worksheet).
8. Corrective feedback (students will receive feedback aimed to improve their performance).
The materials have been designed both for students and teachers to guide teachers’ instruction and guarantee that all teachers are conducting the same instructional methodology (see an example in Appendix A.1). Teachers were given a sheet to daily register students’ attendance, and components or activities worked out during the sessions. Kindergarten students received an average of 34.3 (SD = 17.2, minimum = 4, maximum = 75) intervention sessions; and 34.1 (SD = 16.3, minimum = 3, maximum = 73) intervention sessions in 1st grade. For both CBM and the instructional sequence proposed in the IAERI, teachers marked whether the screening process was completed through the Fidelity of the Assessment Scale, and also whether the lesson steps were completed after each lesson through the Fidelity of the Intervention Scale.
Corrective Math Program. The IAEMI (Jiménez, Villarroel, et al., Reference Jiménez, Villarroel, Bisschop and Jiménez2019) are included in the Primate WBT. It is composed of RtI Tier 2 intervention activities designed based on the principles of systematic and explicit instruction and the use of modeling, scaffolding, and feedback to help students at risk of achieving the skills needed for early success in math (Gersten, Beckmann, et al., Reference Gersten, Compton, Connor, Dimino, Santoro, Linan-Thompson and Tilly2009). IAEMI includes material based on the development of number mastery, numerical concepts and applications, computation, and problem-solving strategies. The materials have been designed both for students and teachers to guide teachers’ instruction and to guarantee that all teachers are conducting the same instructional methodology. Therefore, teachers have a worksheet with information about how to use each one of the student worksheets. IAEMI includes instructional activities that are presented as a worksheet that collects the necessary materials and the instructional sequence similar to that described for the reading intervention (see an example in Appendix A.2). The IAEMI materials are organized in the following components: counting, estimation, magnitude comparison (non-symbolic), number composition and decomposition, number identification, number reading and writing, number representation, number relationships, number comparison, single-digit computation, problem-solving, and multiplication. The IAEMI includes concrete manipulatives and visual and abstract representations, allowing students to move from a concrete understanding to a more abstract one. This material contains different difficulty levels and sufficient examples for each content and activity. Teachers were given a sheet to daily register students’ attendance, and components or activities worked out during the sessions. In 1st grade-students received an average of 41.28 (SD = 12.78, minimum = 13, maximum = 68) intervention sessions; 38.41 (SD = 12.80, minimum = 19, maximum = 73) in 2nd grade; and 38.48 (SD = 8.95, minimum = 16, maximum = 56) intervention sessions in 3rd grade. For both CBM and the instructional sequence proposed in the IAEMI program, teachers marked whether the screening process was completed through the fidelity of the assessment scale, and also whether the lesson steps were completed after each lesson through the fidelity of the intervention scale.
Implementation Fidelity
Two scales were used to analyze the fidelity of the implementation: Fidelity of the intervention scale and fidelity of the assessment scale. Both of them were designed in two modalities: Self-report and direct observation. The external observation scales contain the same items as the self-report scales but presented in third person. In addition, the external observers had a rubric that helped them to interpret the IPAL and IPAM and the IAERI and IAEMI external observation scales.
Fidelity of the Intervention Scale. This scale assesses the accuracy with which teachers follow the instructional sequence proposed in the IAERI and IAEMI (see an example of the self-report in Appendix A.3). It includes twelve items in a 5-point Likert-type scale (0 = none, 1 = little, 2 = some, 3 = most, 4 = all). Regarding the implementation of the reading instruction, both the self-report and the external observation scale showed adequate indices of internal consistency (α =. 94; α = .85, respectively). As for the ICC, the fidelity of the intervention scale showed a 94.65% of agreement, 95% CI [.91, .97] between two observers who made five observations together (i.e., 30% of the follow-up scores). Concerning the accuracy with which teachers followed the instructional sequence proposed for the IAEMI, both self-report (α = .92) and direct observation (α = .94), ICC = .84, 95% CI [.74, .91] modalities showed adequate indexes of reliability.
Fidelity of the Assessment Scale. This scale assesses the accuracy with which teachers follow the instruction of the administration of the IPAL and IPAM (see an example of the self-report in Appendix A.4). It includes twelve items for the IPAL and eleven items for the IPAM in a 5-point Likert-type scale (0 = none, 1 = little, 2 = some, 3 = most, 4 = all). In the Reading program, both the self-report and the external observation scale for the self-evaluation of the application of the IPAL tool showed adequate indices of internal consistency (α = .92; α = .84, respectively). Regarding the ICC of the global observation scale, there was an 84.22% agreement, 95% CI [.74, .90] between two observers who made five observations together per month for five months (i.e., 30% of the follow-up scores).
In the math program, direct observations were done at least once to every teacher (i.e., single observation), with 25% of the teachers being observed monthly. Both self-report (α = .93) and direct observation, calculated using all single observations and an average value calculated for each teacher monthly observed (α = .70), ICC = .85, 95% CI [.74, .91] showed adequate indexes of reliability at or above .70.
Overall, the total average score of fidelity revealed an adequate implementation of the Reading program (M = 3.27, SD = .41), with a fidelity of 82%, and the math program (M = 3.27, SD = .31), with a fidelity of 81.8%.
Procedure
A collaboration agreement was established between the Department of Education and Universities of the Canary Islands Government and the Universidad de La Laguna for the development of the “RtI (Response to Intervention) model for prevention and reading, writing and mathematics performance improvement program in early childhood education and primary education centers in the Autonomous Community of the Canary Islands” (Boletín Oficial de Canarias, 2017). Through this agreement, teachers from primary education schools in the Autonomous Community of the Canary Islands were offered the possibility to receive training in the RtI Model. All participants received a teacher certification provided by the Department of Education to qualify as reading or math specialists. Consequently, all procedures performed in the present study involving children, teachers, families, and school supervisors were in accordance with the ethical standards of the Department of Education from the Canary Government.
Once the participating schools distributed throughout the Autonomous Community of the Canary Islands were established (experimental condition), the Canarian Agency for University Quality and Educational Evaluation selected 15 control schools located in the capital islands (i.e., Gran Canaria and Tenerife) that were equivalent in SES to the experimental schools. Moreover, meetings were directed toward principals, general education teachers, counselors, and inspectors so that all were familiar with RtI requirements.
For the correct development of the study, a schedule was established for both Letra and Primate WBT, beginning the online training of teachers belonging to the experimental condition with a duration of 12 weeks (i.e., from September to November) to guarantee that they knew to implement a Tier 2 intervention program and to assess and identify students at-risk. Due to the Canary Islands are made up of seven islands,face-to-face training was carried out in the provincial capitals (i.e., Tenerife and Gran Canaria). Therefore, teachers from the other island needed to travel from their islands to the capital ones. Teachers received a total of four face-to-face sessions lasting four hours each. These face-to-face meetings were held to guarantee the proper administration of the IPAL and IPAM, and the implementation of the IAERI and IAEMI by the teachers. For this purpose, teachers followed the instructional methodology established for Tier 2. Likewise, teachers were provided with guidelines to carry out decision-making. The first meeting was held before the start of the theoretical training. Each of the subsequent meetings was held before the administration of Forms A, B, and C of IPAL and IPAM (i.e., fall, winter, and spring). During this period, the teachers received the constant support of three academic mentors from the Learning Disabilities, Psycholinguistic and Information and Communication Technologies (DEAP&NT) research group of the Universidad de La Laguna, using queries forums hosted on the Letra and Primate WBT and during face-to-face meetings. EG assessments were carried out by the intervention teachers who received the training in the Letra and Primate. Teachers and research assistants used the RtI websiteFootnote 3 to identify students’ risk status. They introduced the raw score obtained by the students in each IPAL and IPAM measures. The RtI website identifies with a red dot those students who are at-risk for reading or math difficulties, and with a yellow dot those who are at low-achievement. Furthermore, the website uses all the students’ scores throughout the year to create graphs that facilitate their progress monitoring. The teachers recorded the results obtained by the students in the RtI website and used the evaluation data to identify at-risk students, decide which students should join the intervention group, and for intervention decision-making (i.e., which components to focus on more intensely). It was indicated that the teachers should always choose those students at-risk to join the intervention group. Once at-risk students were identified, the teachers formed intervention groups made up of a minimum of three and a maximum of five students. The 17-week intervention was carried out from January to May, with a frequency of three to four sessions per week and a duration of 45 to 55 minutes per session.
For the evaluation of the control group, 19 graduated students in psychology or education were trained in the administration of the IPAL and IPAM and the insertion of CBM data on the RtI website in three four-hour sessions (one per quarter). Each examiner was assigned a school at the beginning of the course, so that some schools had two examiners, and others had one.
To guarantee the fidelity of the implementation, EGR teachers responded to monthly self-reports focused on the IPAL or IPAM administration and the IAERI or IAEMI implementation. Likewise, external observations were made from the administration of IPAL or IPAM, and the implementation of the IAERI or IAEMI. To do this, the teachers in the EGR were subdivided into two groups: Follow-up observations and single observations. The follow-up observations group was composed of 30% and 25% of the participating reading and math teachers, respectively. These teachers were assigned an observer at the beginning of the program, who made monthly observations of the administration of IPAL or IPAM, and the implementation of the IAERI or IAEMI. 75% of the teachers were part of the single observation group, and they were observed only once, both for the administration of the IPAL or IPAM, and for the implementation of the IAERI or IAEMI. When organizing the single observations, it was taken into account that the observations of the assessment and intervention were not carried out during the same month, as well as the distribution of the schools on the islands. 30% of the follow-up observations were carried out with two observers, with the aim of evaluating the reliability between judges. To carry out the external observations, 19 graduated students in psychology were trained in the administration of the IPAL or IPAM, the implementation of the IAERI or IAEMI in three four-hour sessions (one per quarter), and the use of the fidelity of the intervention scale and fidelity of the assessment scale.
To verify the absence of differences in the family environment and the instructional practices of the general classroom teachers, belonging both to the experimental and control group, the Home Numeracy and Early Literacy Practices at Home Questionnaires were delivered to the families of the participating students; a link was also sent to each general classroom teacher for complete the Reading Teaching Practices Questionnaire and Math Teaching Practices Questionnaire through the Google Surveys system.
Data Analysis
Hierarchical linear models (HLM) (Raudenbush & Bryk, Reference Raudenbush and Bryk2002) were conducted to analyze the growth paths of the EGR and the CGR. To compare the growth curves between the EGR and CGR group, a composite IPAL (C-IPAL) score and a composite IPAM (C-IPAM) score were calculated. Both C-IPAL and C-IPAM measures were calculated using the percent of maximum possible (POMP) method (Cohen et al., Reference Cohen, Cohen, Aiken and West1999), which makes each scale range from 0 (= minimal possible) to 100 (= maximum possible). The resulting POMP-transformed scores can be interpreted as percentages of the maximum possible score (Moeller, Reference Moeller2015). In order to build the HLMs, we followed a step-by-step procedure recommended by Peugh and Heck (Reference Peugh and Heck2017) to conduct three-level longitudinal analyzes. Both linear and quadratic models were explored (Peugh & Heck, Reference Peugh and Heck2017; Raudenbush & Bryk, Reference Raudenbush and Bryk2002). The likelihood-ratio test and deviance statistics were used to choose the HLM model with the best fit (Raudenbush & Bryk, Reference Raudenbush and Bryk2002). When collinearity (r < −.80, > .80) effect was found between the intercept and the time set as random effects, both in the student and the school levels, only the time remained as random effect (Barr et al., Reference Barr, Levy, Scheepers and Tily2013).
Results
The analysis of residuals revealed that all models meet the assumption of normality; therefore, no transformation was necessary. HLMs were performed using a dependent variable the composite C-IPAL score for K-1, and the composite C-IPAM score for 1-3 grades. In the conditioned models, the EGR group was used as a reference group (i.e., the intercept of the final model represents the value of the EGR group at the beginning of the school year) to be able to compare their growth with the CGR.
Reading Outcomes
Table 1 shows descriptive statistics for each reading measure. Results from the three-level longitudinal HLM for reading data following the step-by-step procedure are shown in Table 2. Figure 2 shows a graph with the growth in the C-IPAL measure of the different groups for K-1 grades.
Table 1. Descriptive Statistics of the IPAL POMP Scores across Academic Year from At-Risk Students as a Function of Grade and Group

Note. IPAL = Indicators of Basic Early Reading Skills; POMP = Percent of maximum possible; LSF = letter sound fluency; LNF = letter knowledge fluency; PA = phonological awareness; CPQ = concepts about print-questions; CPI = concepts about print-images; RID = riddles; NWF = non-sense words fluency; MS = maze sentences; ORF = oral reading fluency; C-IPAL = Composite score of IPAL.
Table 2. C-IPAL Unconditional and Conditional Growth Curves

Note. Model 0 = baseline model; Model 1 = unconditional growth curve model; Model 2 = conditional growth curve model with group as predictor; IPAL = indicators of early basic reading skills; ICC = intraclass correlation coefficient. aEstimate (SE). bVariance (SD). (-) the intercept is removed as random from the model because colinearity between intercept and slope. + = lineal model, 2 = quadratic model, ns.
p >.05. *p < .05. **p < .01. ***p < .001.

Figure 2. Growth Rate as a Function of Group and Grade in Reading Performance
The unconditional baseline model (i.e., model 0) showed that the ICC value due to the school was .16 for kindergarten, and .15 for 1st grade, pointing out the need for keeping the school level within the estimated models. Unconditioned growth models (i.e., model after including the time, but before adding the group) revealed that C-IPAL showed significant growth for both kindergarten and 1st grade-students (i.e., growth was > 0 at different moments of measurement). Conditional growth models revealed that, at the beginning of the school year (i.e., intercept), there were no significant differences in the C-IPAL score among CGR and EGR in kindergarten. However, the CGR started with a C-IPAL score higher than the EGR for 1st grade. Regarding the growth slopes, the interaction of the CGR and EGR slopes (i.e., Time * Group) was significant. In general, the EGR group showed significantly greater growth than the CGR group.
Math Outcomes
Table 3 shows descriptive statistics for each math measure. Results obtained after performing the HLM for math data following the step-by-step procedure are shown in Table 4. Figure 3 shows a graph with the growth in the C-IPAM measure of the different groups for 1-3 grades.
Table 3. Descriptive Statistics of the IPAM POMP Scores across Academic Year from At-Risk Students as a Function of Grade and Group

Note. IPAM = Indicadores de Progreso de Aprendizaje en Matemáticas [Indicators of Basic Early Math Skills]; POMP = percent of maximum possible; M = mean; SD = standard deviation; QD = quantity discrimination; MC = multi-digit computation; MN = missing number; SC = single-digit computation; PV = place value; C-IPAM = Composite score of IPAM.
Table 4. C-IPAM Unconditional and Conditional Growth Curves

Note. Model 0 = baseline model; Model 1 = unconditional growth curve model; Model 2= conditional growth curve model with group as predictor; IPAM = indicators of early basic math skills; ICC = intraclass correlation coefficient. aEstimate (SE). bVariance (SD). (-) the intercept is removed as random from the model because colinearity between intercept and slope. + = lineal model, 2 = quadratic model, ns.
p >.05. *p < .05. **p < .01. ***p < .001.

Figure 3. Growth Rate as a Function of Group and Grade in Math Performance
The unconditional baseline model (i.e., model 0) showed that the ICC value due to the school was .17 for 1st grade, .22 for 2nd grade, and .09 for 3rd grade, pointing out the need for keeping the school level within the estimated models. The unconditional growth model revealed that the C-IPAM score showed significant growth (i.e., the growth was > 0 at the different moments of measurement). Once the group variable was included in the model (i.e., conditioned growth model), the contrast of the model at the beginning of the school year revealed that, in comparison with the CGR, the performance in the intervention group was significantly lower in 1st and 2nd grades. However, there were no significant differences in the C-IPAM score among CGR and EGR for 3rd grade. Regarding the growth slope, the interaction of the CGR and EGR slopes (i.e., Time * Group) was significant for all grades. In general, the EGR group showed significantly greater growth than the CGR group.
At-Risk Reduction
Table 5 shows the changes in the risk status of students with and without Tier 2 intervention in reading and math.
Table 5. Changes in the Risk Status of Students with and without Tier 2 Intervention in Reading and Math

Note. CGR = control group at-risk; EGR = experimental group at-risk; Not-assessed = students who did not assist to the schools in the Spring screening. The at-risk intervention group was conformed by students included in fall and/or winter.
Reading
The number of students who left the at-risk situation in spring was analyzed in the EGR and CGR. In kindergarten, while 55.5% of the students who were part of the EGR left the at-risk situation at the end of the school year, only 25.4% of the CGR students left the at-risk situation, χ2(1) = 16.6, p < .001. In 1st grade, while 36.5% of the students who were part of the intervention group came out of the at-risk situation, similarly to kindergarten, 25.7% of the CGR students left the at-risk situation, but the differences were not significant χ2(1) = 3.01, p = .10.
Math
The number of students who left the at-risk situation in spring was analyzed in the EGR and CGR. In 1st grade, while 30.8% of students who were part of the EGR left the at-risk situation at the end of the school year, only 17.6% of the CGR students left the at-risk situation, χ2(1) = 6.46, p < .001. In 2st grade, while 14.8% of students who were part of the EGR left the at-risk situation at the end of the school year, only 3.1 % of the CGR students left the at-risk situation, χ2(1) = 10.1, p < .001. In 3st grade, while 20.4% of students who were part of the EGR left the at-risk situation at the end of the school year, only 3.1 % of the CGR students left the at-risk situation, χ2(1) = 7.42, p < .001.
Discussion
The main aim of this study was to examine the effectiveness of an intervention implemented by elementary school teachers in the context of RtI model. For this purpose, a Tier 2 or secondary intervention was implemented by Spanish K-3 grade primary school teachers within an RtI framework. We hypothesized that a Tier 2 intervention would be able to cause differences in the growth rate of reading and math performance, and to reduce the risk of reading or math difficulties. Both hypotheses were supported in the data. Overall, the findings from this study revealed that the intervention was effective. At the beginning of the intervention, the intercepts were significantly different between the EGR and the CGR (e.g., in reading, for 1st grade; in math, for 3rd grade), being the EGR below the CGR. Teachers and research assistants assessed students in the EGR and CGR, respectively. However, while the CGR maintained a similar percentage of students identified as at-risk, teachers from EGR could not intervene with all the at-risk students. Therefore, they choose those students who presented a higher risk status. This procedure resulted in the EGR having significantly lower means compared to the CGR at the beginning of the intervention, except for the grades and curricular areas mentioned above. Nevertheless, even with this difference, students at the EGR improved more than students at the CGR, implying that the EGR benefited significantly from the intervention program. Generally, the EGR improved significantly more than the CGR. In the next section, we will discuss the findings obtained in reading, and then we will do the same for math.
Reading
The implementation of the RtI Tier 2 model had a significant effect on the overall improvement in reading performance. These results are in line with previous studies that found significant changes once the intervention effects were analyzed on composite measures (Al Otaiba et al., Reference Al Otaiba, Connor, Folsom, Wanzek, Greulich, Schatschneider and Wagner2014; Baker et al., Reference Baker, Smolkowski, Chaparro, Smith and Fien2015; Gilbert et al., Reference Gilbert, Compton, Fuchs, Fuchs, Bouton, Barquero and Cho2013). Similarly to studies conducted in the English language, the concurrent instruction on the main components prescribed by the National Reading Panel (NRP), 2000, (i.e., phonemic awareness, phonics, reading fluency, vocabulary, and comprehension), as a set of instructional components, has proven to be effective for monolingual Spanish-speaking children at risk for reading difficulties. Within this context, direct instruction in small groups has proven beneficial for at-risk readers. In fact, previous studies found that Tier 2 direct instruction offered to small groups seems to be beneficial for students at-risk of reading failure (Agodini & Harris, Reference Agodini and Harris2010; Archer & Hughes, Reference Archer, Hughes, Archer and Hughes2011; Carnine et al., Reference Carnine, Silbert, Kame’enui and Hall2004; Kamps et al., Reference Kamps, Abbott, Greenwood, Wills, Veerkamp and Kaufman2008; Richards-Tutor et al., Reference Richards-Tutor, Baker, Gersten, Baker and Smith2016). Also, some research has shown that the small group size format is an important factor contributing to the success of reading interventions (Elbaum et al., Reference Elbaum, Vaughn, Hughes and Moody2000). The main reason is that reducing the number of students per group increases participation opportunities, and it also makes it easier for teachers to give students corrective feedback. Students received approximately 35 intervention sessions in each grade, and between two and three sessions per week coincident with what has been reported in the literature review. In a review of studies on the Tier 2 RtI implementation, Gersten et al. (Reference Gersten, Haymond, Newman-Gonchar, Dimino and Jayanthi2020) concluded that approximately 30 minutes of small group instruction per day (3-5 days per week) throughout 10 to 15 weeks of intervention, with a session duration of 20 to 40 minutes is highly effective for students who are struggling or having difficulties with learning to read. In sum, when intervening with students who have reading difficulties or are at risk of presenting them, systematic and controlled instruction following a structured program is more effective than less direct implementation approaches (Richards-Tutor et al., Reference Richards-Tutor, Baker, Gersten, Baker and Smith2016).
Math
RtI model has also proven to be useful to improve at-risk students performance in math (Bryant, Bryant, Gersten, Scammacca, & Chavez, Reference Bryant, Bryant, Gersten, Scammacca, Funk, Winter, Shih and Pool2008; Bryant, Bryant, Gersten, Scammacca, Funk, et al., Reference Bryant, Bryant, Gersten, Scammacca and Chavez2008; Clarke et al., Reference Clarke, Doabler, Strand Cary, Kosty, Baker, Fien and Smolkowski2014; Dennis, Reference Dennis2015; Dennis et al., Reference Dennis, Bryant and Drogan2015; Fuchs et al., Reference Fuchs, Compton, Fuchs, Paulsen, Bryant and Hamlett2005; Strand Cary et al., Reference Strand Cary, Clarke, Doabler, Smolkowski, Fien and Baker2017). In most of these studies the components included in the intervention have been mainly focused on number knowledge, number sequences, magnitude comparison, place value, number facts, computation with or without regrouping, concepts, and applications, and word problem-solving. In those interventions, groups ranged from 2 to 5 students; the sessions’ length ranged from 15 to 40 minutes, and the number of sessions from 35 to 92. Although for this study the number of intervention sessions was lower than in all the above-mentioned studies (i.e., 40 sessions approximately), the intervention sessions lasted longer than in those studies, ranging from 45 to 50 minutes, instead of the 20 to 40 minutes recommended by the NCRTI (2010). Sessions took longer than recommended because, in the Spanish curriculum, schools can choose to have sessions that can range from 45 to 55 minutes. Therefore, teachers adapted the general recommendations for implementing the RtI model to their school’s resources and class schedules. The Tier 2 intervention carried out in this study was based on number sense underlying skills, which have been mainly used in kindergarten (Clarke et al., Reference Clarke, Doabler, Smolkowski, Turtura, Kosty, Kurtz-Nelson, Fien and Baker2019; Doabler et al., Reference Doabler, Clarke, Kosty, Kurtz-Nelson, Fien, Smolkowski and Baker2016) and 1st grade (Bryant, Bryant, Gersten, Scammacca, Funk, et al., Reference Bryant, Bryant, Gersten, Scammacca and Chavez2008; Clarke et al., Reference Clarke, Doabler, Strand Cary, Kosty, Baker, Fien and Smolkowski2014; Doabler et al., Reference Doabler, Clarke, Kosty, Turtura, Firestone, Smolkowski, Jungjohann, Brafford, Nelson, Sutherland, Fien and Maddox2019; Strand Cary et al., Reference Strand Cary, Clarke, Doabler, Smolkowski, Fien and Baker2017). However, the results found in this study not only confirm the utility of Tier 2 intervention for Spanish 1st graders, but also support the importance of instruction based on number sense underlying skills in 2nd and 3rd grade to improve students’ math competence.
At-Risk Reduction
Another indicator we have used is the extent to which Tier 2 reduces the risk incidence of presenting reading and math difficulties in the early grades. Overall, the present findings indicate that the earlier the intervention, the greater the percentage of students who leave the situation of risk of LD in reading and math. This result coincides with previous studies (e.g., in reading, Gersten et al., Reference Gersten, Haymond, Newman-Gonchar, Dimino and Jayanthi2020; in math, Bryant et al., Reference Bryant, Bryant, Roberts, Vaughn, Pfannenstiel, Porterfield and Gersten2011). Overall, these results are attributable to the fact that the intervention was carried out with adequate fidelity and had a significant positive impact on all grades. In fact, at the beginning of the intervention, the minimum requirements necessary to accurately carry out the implementation of the model were established (i.e., materials contained specific instructions on their implementation, a training and implementation schedule was designed, necessary materials for the evaluation of the fidelity of the implementation were designed, external observers were trained to do so, etc.) (Century et al., Reference Century, Rudnick and Freeman2010; Johnson et al., Reference Johnson, Mellard, Fuchs and McK-night2006; Mellard & Johnson, Reference Mellard and Johnson2008; O’Donnell, Reference O’Donnell2008). Direct observations and self-reports indicated that most of the teachers carried out the implementation of the program with fidelity of around 82%. These findings indicate that, since there is a high degree of coincidence between teachers’ self-reports and external observers, the quality of the assessment and intervention was guaranteed.
In addition, the comparison between EGR and CGR was not influenced by the home or classroom environment. So, for instance, the results showed that within the Reading program there were no significant differences between the general classroom teachers of the EG and CG in the teaching practices of reading nor for the literacy practices within the family home. This same result was observed within the math program, where there were no significant differences for the home numeracy environment nor the core math instruction. Likewise, results indicated that intervention teachers benefited from the WBT (i.e., Letra and Primate). Hence, all of them had the knowledge to teach essential reading and math skills to at-risk students, use the CBM IPAL and IPAM, and implement the IAERI and IAEMI adequately. These results are consistent with previous studies that have found that in-service teachers benefit from these WBT (Jiménez & Gutiérrez, Reference Jiménez and Gutiérrez2017; Jiménez & O’Shanahan, Reference Jiménez and O’Shanahan2016; Jiménez et al., Reference Jiménez, O’Shanahan, González, Frugone and Barrientos2014).
A number of limitations should be considered when interpreting the results of this study. Firstly, no information could be collected about the type of instruction the control group at-risk was receiving as well as the lack of control over Tier 1 intervention in the experimental and control groups. We attempted to control Tier 1 instruction using a questionnaire about the frequency and type of teaching practices used in reading and math, which was provided to the general classroom teachers. However, it is generally not recommended to use self-reports as the sole means of assessing teaching practices (Berger, Reference Berger2010). In addition, instruction at Tier 1 should be aligned with the instruction received by students at Tier 2. This requires providing specialized training to teachers working in the general classroom and coordinating the different educational agents of the school. Although the findings presented here suggest that the IAERI and IAEMI materials may be useful instructional strategies as a Tier 2 component of an RtI approach to instruction, several studies recently suggest that the efficacy of these instructional strategies would be moderated by the instructional environment of the classroom (i.e., Tier 1), the children receiving the Tier 2 instruction, or both (Loningan & Phillips, Reference Lonigan and Phillips2009). Therefore, results should be cautiously interpreted, as we could not control if the instruction that general classrooms teachers claim to carry out in practice is actually what they are implementing in their classrooms. Consequently, it could be advisable that in future studies, both self-reports, and field observations were used in the Tier 1.
Another limitation was the lack of resources for the attention of all the students at-risk in the experimental group. This limitation was especially important in 1st and 2nd grades. Considering the over-identification of at-risk students in these grades, the teachers had to choose the students who showed a higher risk status, thus preventing comparability of the EGR with the CGR in its intercept for 1st and 2nd grade. Although HLM controls variability in the starting point of the students, we have seen that the initial performance also has an important effect on the slopes of growth of the students and, therefore, it is more difficult to isolate the effect of the intervention if the groups are not comparable at the beginning of the school year. In this sense, although as a group of students in the study showed a positive response to the intervention, without better control of the selection process it is difficult to determine if the selected group in this study represents a typical response to the intervention.
Finally, the present study did not include a follow-up evaluation to verify that the children who had left the risk situation continued in that situation. Therefore, we cannot ensure that the effects found of Tier 2 intervention are consistent over time in the present study. Future longitudinal research is necessary to asses the long-tem effects of the intervention.
To sum up, the results found in this study prove that the Tier 2 of the RtI model can be successfully implemented by Spanish teachers to improve reading and math performance of students at-risk in the early grades of primary school. One of the main contributions of this study is that the intervention was carried out by in-service teachers, increasing the generalizability of these results to other Spanish contexts. However, for this generalization to occur, educational policies must guarantee that teachers have an adequate support system to guide them during the implementation.
Appendix
Appendix A.1
Example of Teacher and Student’s Worksheet of the IAERI

Note. IAERI = Instructional Activities for Early Reading Improvement.
Appendix A.2
Example of Teacher and Student’s Worksheet of the IAEMI

Note. IAEMI = Instructional Activities for Early Math Improvement.
Appendix A.3
Fidelity of the Assessment Scale: Self-report
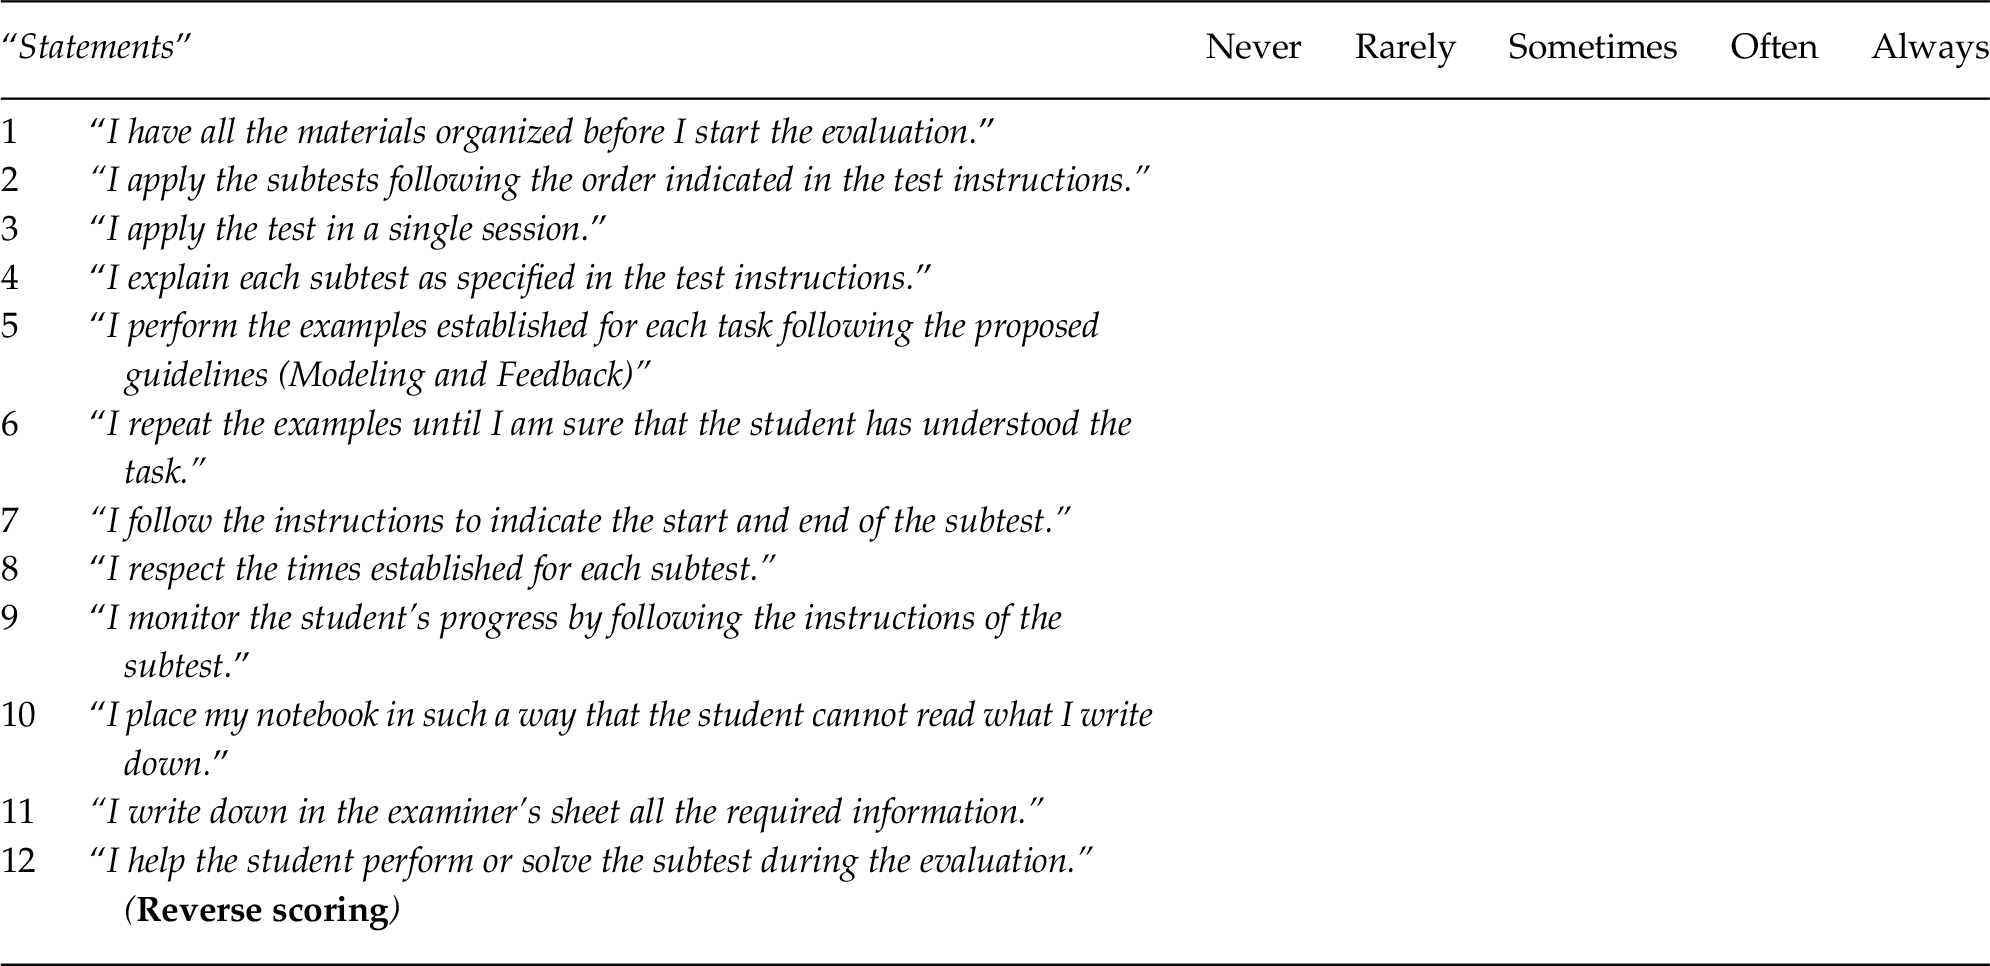
Note. The direct observation scale contains the same items but presented in third person.
Appendix A.4
Fidelity of the Intervention Scale: Self-report

Note. The direct observation scale contains the same items but presented in third person.


 Open access