


Introduction
The global market for organic agri-food products is large and expanding. As of 2018 the estimated value of this market was €96.7 billion (US$110.8 billion), and many countries continue to experience double-digit growth for organic agri-food products (Willer et al., Reference Willer, Schlatter, Trávníček, Kemper and Lernoud2020). Over 2.8 million producers serve this market,Footnote 1 and worldwide, 71.5 million hectares of land are under organic agricultural management practices (Willer et al., Reference Willer, Schlatter, Trávníček, Kemper and Lernoud2020).
The United States (U.S.) is the largest market for organic food and drinks. As of 2018, the U.S. market for organic food was valued at US$47.9 billion, and organic products other than food, such as pet food, fiber, flowers, dietary supplements and personal care products accounted for an additional $4.6 billion in sales (OTA, 2019). As domestic organic producers cannot satisfy this demand, organic agri-food products are increasingly imported for either resale as a raw, fresh product or for use as an ingredient in manufactured food products. Beyond aggregated estimates, however, relatively little is known about international markets for organic products. This is of concern to U.S. stakeholders. Through trade and organic equivalency agreements (OEAs), foreign organic firms are increasingly able to access the U.S. market. The resulting increase in both the variety and amount of organic food and ingredients, and continued growth in U.S. consumer demand for organic products, in turn, have consequences on the quantity, price and other U.S. market conditions.
This paper offers new insights about the current state and key trends of U.S. organic agri-food imports and exports. The objectives of this paper are threefold: (1) to describe U.S. policies relevant to the international trade of U.S. organic agri-food products; (2) to characterize the imports and exports of U.S. organic food products and (3) to assess the impact of the most comprehensive of these policies, Organic Equivalency Agreements, on U.S. organic agri-food imports and exports.
This paper begins with a brief introduction of international organic production and consumption, and provides an overview of organic standards and policies which affect the international trade of organic agri-food products. A review of the literature that has evaluated the impact of these policies is then presented. The remainder of the paper describes the data and methods used in this analysis, analyzes results and discusses key study findings and conclusions.
International organic production and consumption
There is a considerable geographic separation between the countries where most organic food is grown and produced and those where it is consumed. The majority of the world's organic agricultural land is in Oceania, which had 36 million hectares of certified land—accounting for 50% of global share—in 2018. Europe and Latin American respectively have 22% (15.6 million organic hectares) and 11% (8 million hectares), of global certified organic land (Willer et al., Reference Willer, Schlatter, Trávníček, Kemper and Lernoud2020).Footnote 2 In contrast, organic growers are concentrated in Asia (in particular, India), Africa (most notably Uganda, Ethiopia and Tanzania) and Europe (mainly in Italy, France and Spain) (Willer et al., Reference Willer, Schlatter, Trávníček, Kemper and Lernoud2020). Clouding our understanding of the organic food supply is that many producers in developing countries are small-scale farmers.Footnote 3 Retail sales and per capita consumption of organic food and beverages, however, are concentrated in North America and Europe which together account for 87% of global sales. The U.S. alone accounts for 42% of global demand, followed by Germany (11%) and France (Willer et al., Reference Willer, Schlatter, Trávníček, Kemper and Lernoud2020).
National and regional organic standards
The international trade of certified organic products can be a complicated process. There is no internationally agreed-upon organic standard. Rather, individual countries establish their own regulations concerning what production and processing practices may be considered organic, the type and nature of organic labeling on food products that is permitted, the process of organic product or firm certification, and certification industry oversight and auditing. As of 2018, 103 countries had some form of official organic production standards (Willer et al., Reference Willer, Schlatter, Trávníček, Kemper and Lernoud2020).
In some cases, the differences between regulations and industry oversight between countries can be substantive. Thus, a business looking to import an organic ingredient or food for direct sale to consumers cannot rely on the product meeting the organic standards in the country where it was grown or manufactured. Rather, it needs to ensure that the product is certified as satisfying the organic requirements of the country where it will ultimately be sold. The cost and challenges of obtaining certification services for a foreign standard, and the identification, segregation and traceability (identity preservation) of organic agri-food products throughout the supply chain, further complicate the international trade of these products.
In an effort to measure the extent of variance in organic requirements, Seufert et al. (Reference Seufert, Ramankutty and Mayerhofer2017) employ a scoring approach to assess how organic principles vary with organic regulations between countries. These authors found that while organic practices and regulations do not differ substantially between countries, there are important differences in allowed substances and prohibited inputs. In the case of crop production, for example, specific synthetic fertilizers or pesticides may be permitted. There is similar heterogeneity in the substances allowed and not allowed to be used in processed food production.
This lack of equivalence of organic standards across countries has long been recognized as a hindrance to market access and substantially increases transaction costs (e.g., Lohr, Reference Lohr1998). In an effort to reduce the complexity and cost of organic product trade, some areas are regionalizing their organic standards. Regional agreements are public or public–private partnerships within a geographic region that include at least two neighboring countries (Pekdemir, Reference Pekdemir2018). To date, such agreements have been established in the European Union (EU), East African Organic Products Standard (EAOPS), Central American Initiative, the Pacific Organic Standard (POS), the African Organisation for Standardisation (ARSO-ORAN) and Asia Regional Organic Standard (AROS). In analyzing these agreements, Pekdemir (Reference Pekdemir2018) found that regionalization contributes to normative coherence while allowing varying standards to accommodate differences local agricultural circumstances. Aside from the EU, however, other regional standards were found to fall short due to the lack of development and implementation of provisions related to labeling and certification, and because regional standards are largely not adopted as enforceable national regulations.
These regional standards are generally developed by incorporating provisions from one or more basic standards of organic production and processing. Most commonly, these regional standards are based on normative references. Key among these normative references are the Codex Alimentarius ‘Guidelines for the production, processing, labelling, and marketing or organically produced foods’ (CAC/GL 32), and the ‘Basic standards for organic production and processing’ developed by the International Federation of Organic Agriculture Movements (IFOAM). Importantly, however, in these agreements, compliance with national and regional regulations take precedence over the requirements of regional standards.
National standards are frequently based on the Codex and/or IFOAM reference documents. The International Federation of Organic Agriculture Movements (IFOAM) is a private organization representing over 779 affiliates in more than 110 countries (Willer et al., Reference Willer, Schlatter, Trávníček, Kemper and Lernoud2020). Member governments and private standard members agree to follow basic IFOAM principles in setting their organic standard requirements. Thus while most organic standards are now consistent in the prohibited and required activities for crop production and animal husbandry, they can still differ in specific details such as specific substances allowed (or not) as a production input. The process and extent of oversight of organic certification services also varies across countries.
Policies governing the international trade of organic agri-food products
As with many other countries, the U.S. is not party to any regional organic standards. However, to help facilitate imports and exports of organic products, the U.S. has developed a series of policies to enable the recognition and use of the U.S. organic standards in selected international markets. These policies include a series of Recognition Agreements, Export Agreements and Equivalency Agreements which are summarized in Table 1. Similar policies have also been adopted by many other countries engaged in the trade of organic agri-food products.
Table 1. Summary of U.S. international organic food policies
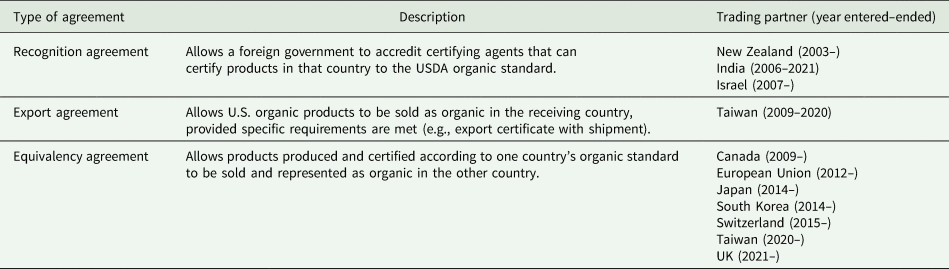
Notes: Adopted and updated from Boys and Hooker (Reference Boys and Hooker2015).
Taiwan transitioned from an export agreement to an equivalency agreement in May 2020. Other agreements are currently in force.
Of these, OEAs are the most important in their ability to facilitate international trade. These agreements allow U.S. organic products to be labeled and sold as organic in the partner countries. In exchange, these partner countries have the same access to the U.S. market. Since most countries have their own organic standards, each agreement has to be separately negotiated and varies by the products covered, allowances concerning specific compounds used during production (i.e., antibiotics, sodium nitrate), and administrative requirements.
By contrast, Export Agreements are not reciprocal. In the case of the U.S.–Taiwan agreement, Taiwan agreed to accept U.S.-certified products as organic without additional certification; Taiwanese products, however, could not be imported into the U.S. without being certified to the U.S. organic standard. Recognition Agreements allow foreign countries to oversee accreditation of agents who can certify that farms and processing facilities meet or exceed the USDA National Organic Program (NOP) regulations. Thus, while produced and certified abroad, these products can be labeled and sold as organic in the U.S. As such, recognition agreements would typically only be granted to countries where the NOP has confidence in the integrity of oversight of the domestic organic certification program.
Global efforts to negotiate new agreements continue. After Taiwan passed its Organic Agriculture Promotion Act in 2019, they enacted several new OEAs including U.S.–Taiwan agreement that was implemented in May 2020. Finally, due to Brexit, a new arrangement was established in January 2021 to recognize equivalence between the UK and U.S. organic standards.
Literature review
The existing peer-reviewed literature has empirically examined the trade of organic agri-food products. Lohr (Reference Lohr1998) proposes that lack of equivalence of organic standards across countries was one of the main sources which impede international market access of organic agri-food products. Seufert et al. (Reference Seufert, Ramankutty and Mayerhofer2017) employ a scoring approach to assess how organic principles vary with organic regulations in countries, and they find that substances that are allowed (or not) as inputs play a vital role. Pekdemir (Reference Pekdemir2018) describes the development of regional organic standards established in the EU, Africa, Central America, the Pacific and Asia, and concludes that inter-regional equivalence and multilateral agreements contribute to the reduction of regulatory complexity in organic regulation systems.
Focusing on the U.S. market, Oberholtzer et al. (Reference Oberholtzer, Dimitri and Jaenicke2013) examined the factors influencing the decision of certified organic handlers to import products. These authors found that, while many imports were of products not produced in the U.S. (e.g., tropical fruit, coffee), other imports competed directly with U.S. products. Firm size and social labels were found to affect handlers' import decisions while supply volatility and product prices were not. Focusing on U.S. imports of organic corn, wheat and soybeans, Kristiansen (Reference Kristiansen2014) found that as domestic prices of these crops increased relative to conventional substitutes, the volume of their imports also increased.
Most relevant to the current study are several studies by Jaenicke and Demko. In reports for the U.S.-based Organic Trade Association (OTA), Jaenicke and Demko (Reference Jaenicke and Demko2015a) and Demko et al. (Reference Demko, Dinterman, Marez and Jaenicke2017), have conducted detailed descriptive trade and trade growth analysis of tracked organic agri-food products imported and exported by the U.S. In a second report to the OTA, Jaenicke and Demko (Reference Jaenicke and Demko2015b) found that U.S. equivalence agreements with the EU, Canada, Japan and Taiwan had a positive impact on the trade of organic products between 2011 and 2014.Footnote 4 Overall, this report found these policies increased organic exports 58% relative to a case where the policies were not in place. However, the impacts of these policies were quite heterogeneous and varied from no impact on exports attributed to the U.S.–EU policy to a 455% increase in exports generated by the U.S.–Canada policy. On average, U.S. imports of tracked organic products were estimated to have increased by 110% due to these agreements. An additional study by Demko and Jaenicke (Reference Demko and Jaenicke2018) used a synthetic control method approach to examine the impact of the U.S.–EU OEA on U.S. exports. In considering 23 organic produce products, these authors found that this policy generated an average 9.1% increase in U.S. exports of tracked organic products each quarter between Q3 2012 and Q4 2014, or an average of $149,100 per quarter. This agreement was found to particularly benefit U.S. exports of fresh produce, roasted coffee and tomato sauce.
Tracking the international trade of organic agri-food products
While there are internationally accepted nomenclatures and systems for reporting international trade data,Footnote 5 these do not extend to include organic products. In general, the value of trade of products is reported to the United Nations Conference on Trade and Development (UNCTAD) and classified using a Harmonized System (HS), which is a standard numerical classification of traded products. The HS is administered by the World Customs Organization (WCO) and is used by national customs authorities in more than 200 countries to help gather data concerning international trade shipments, and to appropriately assess taxes and duties on traded products. The HS assigns specific 2-, 4- or 6-digit codes to categories of products; the larger number of digits used, the more specific the product category.Footnote 6 Countries are permitted to add additional digits to this classification scheme if they wish to track the trade of even more specific product categories. In the U.S. a 10-digit code is used to classify products for export. In this classification system, the first six digits are the HS code and the remaining four digits are determined and administered by the U.S. Census Bureau's Foreign Trade Division.Footnote 7 The U.S. International Trade Commission (USITC) administers the Harmonized Tariff Schedule (HTS), which serves as the classification system for imports. Here again, the HS system is used as the basis for the initial 6-digits of the classification system, and additional digits are added as needed to define product categories at the 8- or 10-digit level. In the U.S. the 10-digit product code is used to distinguish between a conventional and organic product of the same type (e.g., organic and not organic shelled almonds).
The design of this product classification system has important implications to evaluating international trade. As codes used to distinguish between conventional and organic products are set by individual countries, rather than through the internationally adopted HS classification, there is considerable variability in the extent to which countries track the trade of organic products. Collecting, compiling, cleaning and reporting trade data requires time and effort—and thus comes at a cost. Countries where the organic agri-food sector is not economically or politically important may decide not to go through the effort to separately track the trade of any organic products. Other countries may opt to track only products for which there is a strong rationale to do so, such as concerns of imports competing with domestic production or a wish to track international buying patterns of economically significant organic products.
In the case of the U.S., organizations can submit a request for new codes to be added. As described by Demko et al. (Reference Demko, Dinterman, Marez and Jaenicke2017), for an application for a new code to be considered, the value of trade for the requested product must be a minimum of $1 million annually, traded by a minimum of three importers and exporters, and trade data must be consistently publishable on a monthly basis. In response to pressure from industry groups, the USITC began tracking organic imports and exports separately from their conventional versions in 2011. Initially, the trade of 23 exported and 20 imported organic products were separately measured (Baldwin, Reference Baldwin2012). In the intervening years, additional products were added; since 2019, the trade of 44 exported and 56 imported organic products are now tracked. A majority of these are raw or intermediate products, rather than processed organic products. Lists of these imported and exported products are presented in Appendix Tables A1 and A2, respectively.
It is important to understand that the estimates of the values of organic imports and exports are only available for these tracked organic products. To be certain, the U.S. is trading much more than these official statistics indicate. Organic agri-food products that are not on these lists are, in fact, being traded but are not being recorded as such at the border. Instead, their value is combined with that of conventionally produced products. Thus, given the current approach to data collection, it is not possible to precisely know the value or full range of organic products being traded. This clearly has important implications for efforts to evaluate the impact of OEAs; using only measures of the tracked agri-food product trade will likely underestimate the true trade facilitation impacts of these agreements.
Research methodology
Data sources
As discussed in the previous section, product-disaggregated trade data provide the most complete picture of trade patterns and is a key input into our analysis. The majority of U.S. data for imports and exports of agriculture and food products (HS Chapters 02-24) was obtained at the HS-10 level from USITC DataWeb (USITC, 2015). Moreover, since the U.S. began separately tracking imports and exports of some organic products in 2011, data from 2011 to 2019 is examined in most of this analysis.
The exception to use of these data concerns the study of organic trade between the U.S. and Canada. As the U.S.–Canada OEA was implemented in 2009, in order to assess the impact of this agreement it is necessary to have organic trade data prior to this period. As the U.S. did not start tracking the trade of organic products until 2011, we instead relied on trade statistics from Canada who, in 2007, began tracking organic imports of 41 products.Footnote 8 As Canada's imports from the U.S. should be equal to U.S. exports to Canada, Canadian data can be used to substitute for (to mirror) U.S. export data to Canada.Footnote 9 Thus, as a novel feature of this analysis, HS-10 data describing Canada's imports from the U.S. (reflecting U.S. exports to Canada) were obtained from Statistics Canada for 2007–2019. This data is used in evaluating the impact of the U.S.–Canada OEA on U.S. exports.
Importantly however, Canada did not start tracking exports of its own organic products until 2017. Thus, as neither the U.S. nor Canada collected any data concerning U.S. organic imports from Canada (or Canada organic exports to the U.S.) prior to their OEA being implemented in 2009, it was not possible to evaluate the impact of this agreement on U.S. organic imports from Canada or Canadian organic exports to the U.S.
Product coverage and aggregation
To explicitly capture the impact of OEAs on organic trade, products (i) are defined at the highly disaggregated HS-10 level. Again, the products considered as organic are only those that are being formally tracked and have been assigned a unique HS code. This careful approach does, however, introduce several analytical challenges. The number of organic products being tracked is dwarfed by the total number of traded products at this level of disaggregation. Thus, if the full-set of traded non-organic products were included in the dataset, even if OEAs did facilitate trade among the small number of tracked organic products, the impact of this would likely not be statistically significant. Furthermore, in assessing the impact of an OEA on trade, it would not be fair to judge its performance based on the agreement not affecting trade for categories of products which are not tracked. For example, as the U.S. does not uniquely identify the imports or exports of any organic fish or crustaceans, it would not be accurate to claim that an OEA was not effective if it did not affect trade of these products.
A novel and careful approach is needed to conduct a fair assessment of the trade impacts of OEAs. Rather than to include all traded agri-food products (Chapters 02-24), this analysis instead includes only products in the HS-6 product categories, which include at least one tracked HS-10 organic product. These categories of products then reflect those for which there is at least some potential for a trading partner to trade organic or similar non-organic products. Importantly as well, in constructing the database, a dynamic coding approach was used to account for changes in the list of organic products identified and tracked by the USITC. As such, the HS-6 product categories, and thus the specific HS-10 products within them included in this analysis, vary over time to reflect changes list of tracked organic products.
This approach, of evaluating the impact on the trade of products which are not directly the focus of a policy but which may be affected by it, is a common practice. (E.g., see Grant and Boys, Reference Grant and Boys2012; Jagdambe and Kannan, Reference Jagdambe and Kannan2020.) While one would expect a policy focused on organic products to increase trade of organic products with agreement signatories (the intensive margin of trade), it potentially also can have positive or negative spill-over impacts on the trade of other products or trade with other nations (the extensive margin of trade). A significant benefit of many international trade agreements is that they facilitate coordination of administrative procedures between signatory countries and, in doing so, increase the efficiency and reduce the risk of moving goods between two counties (Grant and Boys, Reference Grant and Boys2012). By way of example, better defined and more transparent border procedures decrease the possibility that a company will ship products which have a possibility of being rejected by a given destination country. This may be the case for the OEAs—businesses may be more likely to engage in international markets with more assurance that their products will be recognized as organic, and will be able to command a price premium over conventional products, in destination markets. This would be reflected both as an improvement in trade for tracked organic products, as well as the even larger number of organic products which are not tracked and, as such, are instead included among not-organic products.
Methods
Regression analyses are used to assess the impacts of OEAs on U.S. trade of organic products (objective 3). The aggregate effects of OEAs on import and export flows are first assessed, followed by separate analyses of each U.S. OEA. To fully capture the effect of an OEA, it is necessary to include trade flows prior to the implementation of the agreement; as such, analyses generally cover the period 2011–2019. As the U.S.–Canada OEA was implemented in 2009, the previously described U.S. export trade data are used to evaluate this agreement over the period 2007–2019. However, as U.S. organic import data were not available until 2011 (after this agreement was signed), it was not possible to evaluate the impact of this OEA on U.S. imports from Canada. The U.S.–Taiwan OEA is also not included in this analysis as it has been only very recently signed (May 2020) and trade data for this period are not yet available.
The model used to assess the impact on trade of OEAs in aggregate is presented in Equation (1), while that presented in Equation (2) is used to evaluate trade impacts of each individual OEAs:


where X kjt denotes the logarithm of the U.S. annual exports (or imports) of product k from country j in year t. OEAt is a dummy variable indicating a given OEA is in effect in year t, and Organick is a dummy variable indicating if product k is an organic product. Yeart indicates the year given trade flow occurred and is included to capture time varying trends in the trade of these products. Country fixed effects are denoted by δ j and ɛkt is the error term.
Ideally, separate fixed effects for each sector k would also be included (see Baldwin and Taglioni, Reference Baldwin and Taglioni2007; Bacchetta et al., Reference Bacchetta, Beverelli, Cadot, Fugazza, Grether, Helble, Nicita and Piermartini2012). However, as this analysis makes use data which are highly disaggregated by products (HS-10), this approach would generate a very large number of results and would make interpretation difficult. Following the approach used by Shepherd and Wilson (Reference Shepherd and Wilson2013), we instead adopt a compromise strategy in which we implement product fixed effects for each six-digit HS product category, k. Product fixed effects are denoted by φK.
As the dependent variable is log-transformed, a linear change in an independent variable is associated with a multiplicative change in the dependent variable. More specifically, in this specification, a one-unit change in the value of an independent variable is associated with a $100 \times ( {e^{\hat{\beta }}-1} )$ percentage change in the dependent value.Footnote 10
Results and discussion
A descriptive overview of U.S. trade of organic agri-food products
Figure 1 presents the value of U.S. organic agri-food products which are imported and exported, and the share of total U.S. trade reflected by these products. In considering these trends, however, it is important to note that these values reflect only the products that can be uniquely identified through codes assigned by the USITC. As the number of products tracked has changed over time, some of the increase organic imports and exports reported in Figure 1 are likely to be due to an expansion of the number of tracked products rather than necessarily an increase in the value traded.
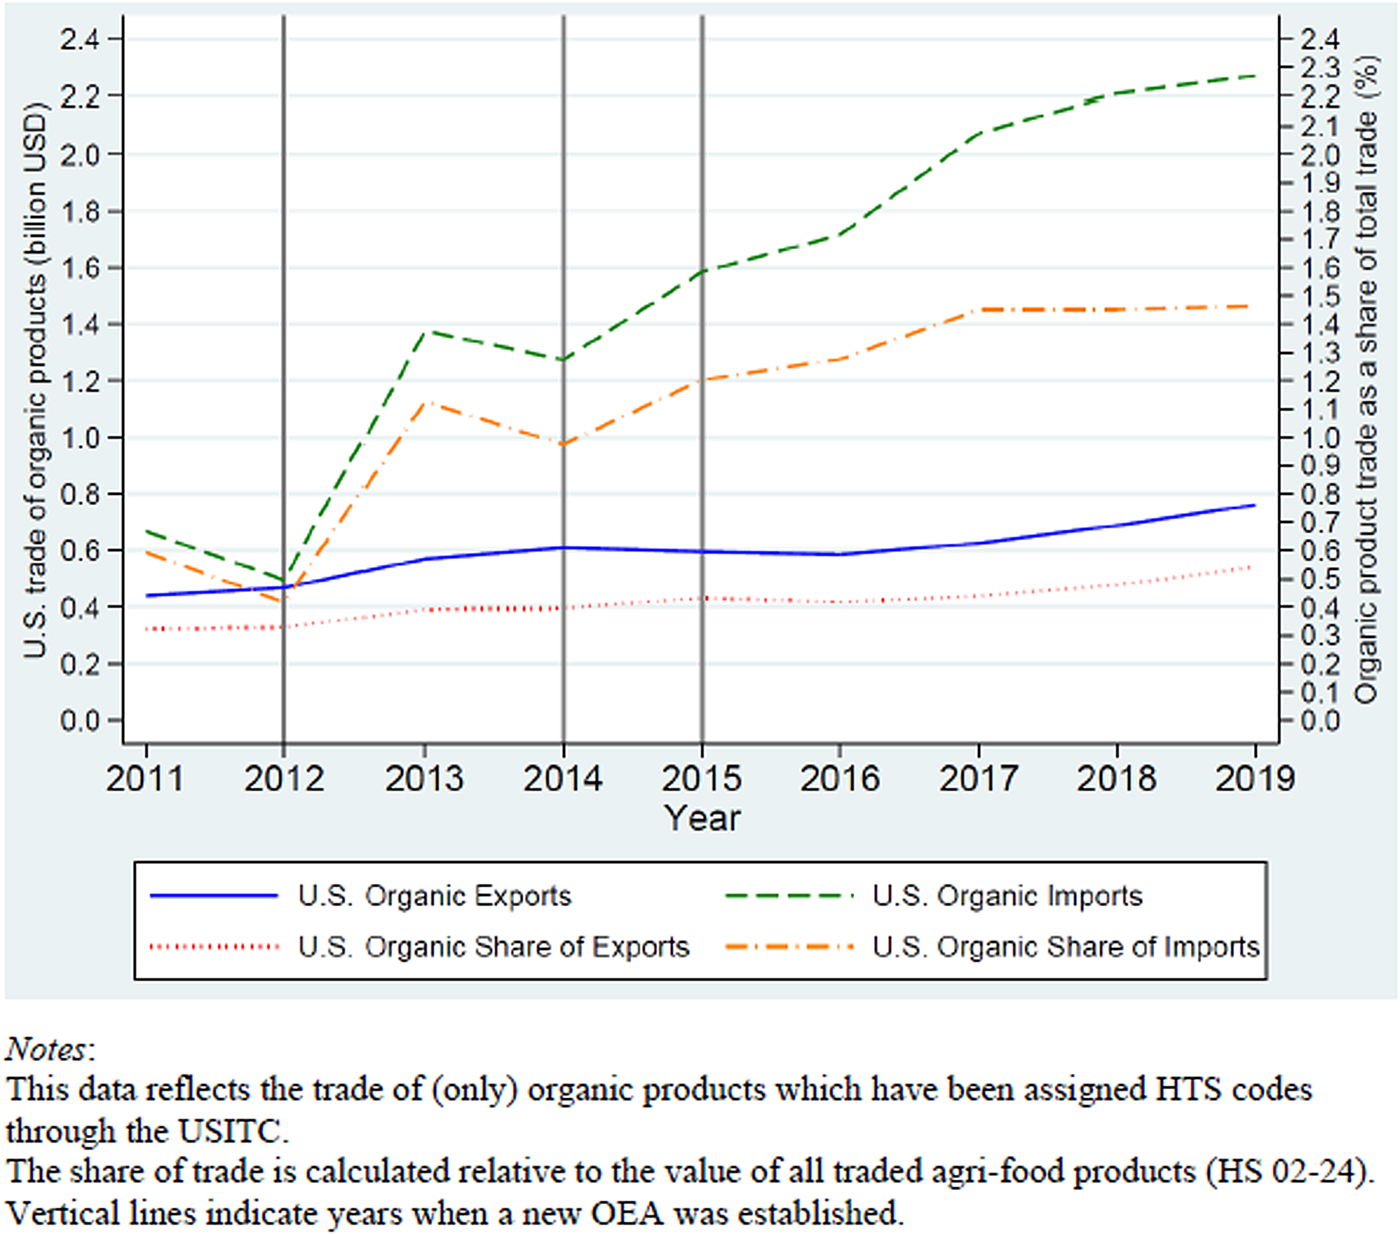
Fig. 1. Value and share of trade of U.S. organic agri-food products, 2011–2019.
Based on the data that are available, US$0.76 billion was exported into the U.S. in 2019, reflecting an increase of 72.7% since 2011. Organic agri-food exports, which comprised of 0.32% of total U.S. total agri-food exports in 2011, increased to 0.54% by 2019. These values are quite small relative to the value of organic imports. U.S. organic agri-food imports hit a record of US$2.27 billion in 2019, a threefold increase since 2011. The share of organic imports relative to the overall value of imported products has also seen a significant increase from 0.59 to 1.46% during this period.
In Figure 1, vertical lines identify dates where new OEAs were implemented. From this graphical evidence it appears that several U.S. OEAs have contributed to this general trend of increasing imports and exports. For example, in the year following the establishment of the U.S.–EU OEA in 2012, U.S. organic exports and imports increased by 6.8 and 176%, respectively. In the year after the U.S.–Japan OEA and U.S.–South Korea OEA was enacted (2014), the U.S. saw a 25.2% increase in organic imports while exports fell slightly (1.6% decrease). In considering only this short-term response on aggregate trade, it appears that the OEA signed with EU improved both U.S. organic food exports and imports, while agreements with Japan, South Korea and Switzerland encouraged more U.S. organic imports than organic exports. The composition of products traded with these countries, however, matters in interpreting these outcomes. If products typically traded with a country (e.g., Switzerland) are not among those that can be tracked, then the impact of these OEAs could be understated.
U.S. partners in the trade of organic agri-food products
The countries which are top destinations and sources of tracked organic agri-food exports and imports are presented in panels A and B of Figure 2, respectively. As there is annual variability in these trade flows, these figures depict the mean value of trade over the most recent 3 years (2017–2019) of available data. Among the tracked products, a large share is shipped to buyers in Canada (55.3%) and Mexico (24.0%). Due to the relative perishability of many of the tracked products, the geographic proximity of these markets, and policies which facilitate trade between these partners (NAFTA and, in the case of Canada, an OEA), this outcome is not surprising. Other significant destinations for U.S. exports include Japan (annual average of $39.6 million), South Korea ($28.4 million), Taiwan ($24.11 million) and the UK ($9.91 million); importantly, each of these markets had either on OEA or an export agreement in place during the period under consideration. The remaining top destination markets for U.S. organic exports, are the UAE, Hong Kong, Philippines and Guatemala, do not have any form of an organic trade agreement in place.

Fig. 2. Top U.S. trading partners of organic agri-food products, 2017–2019.
The primary suppliers of U.S. organic imports are presented in panel B of Figure 2. Mexico is the largest source of the tracked imports ($335.7 million; 22.2% of imports). The remaining imports are sourced primarily from South America (Peru, Brazil, Argentina, Colombia, Ecuador), Europe (Spain, Italy) and Canada. Each of these partners account for similar (7–12%) of U.S. organic imports. Among these, only the U.S.–EU and U.S.–Canada OEAs govern organic trade with these partners. It is important to note though, that these results may be partially an artifact of the specific products that the U.S. is tracking at its borders. A recent survey of U.S. organic food manufacturers, reported that Canada, Mexico and China were the most likely sources of organic ingredients (OTA, 2019).
U.S. imported and exported organic products
The top agri-food products which are exported by, and imported into, the U.S. are presented in Figure 3. Panels A and B present the top five raw and processed exported products. Apples, grapes, strawberries, spinach and other berries (blueberries, blackberries, etc.) are the most exported raw products, while top exported processed products include tomato sauces, vinegar and roasted coffee. It is important to emphasize that these are top tracked organic products; it is likely that there are other organic products that have noteworthy export values but cannot be separately identified from their conventionally produced equivalents.

Fig. 3. Top organic food products imported and exported by the U.S., 2017–2019.
Panels C and D of Figure 3 present the top organic products imported into the U.S. between 2017 and 2019. Among raw products, coffee (not roasted), bananas, soybeans, Hass avocados and blueberries are the top imports. Olive oil, cane or beet sugars, sparking wine, roasted coffee and red wine account for the majority of processed agri-food imports. Among these, the case of coffee is particularly interesting. The U.S. imports a large amount of organic unroasted decaffeinated Arabica coffee (average of $280.6 million annually). This coffee is roasted and then a portion of it re-exported ($19.91 million annually), making it one of most important U.S. organic exports.
Organic food trade—opportunities for U.S. producers
Trends in U.S. organic imports suggest areas of opportunity for U.S. producers who wish to expand their organic production. Due to increasing international and domestic consumption of organic products, demand for organic leafy greens, carrots, tomatoes and blueberries (among other products) is expected to continue. Alternatively, U.S. farmers could opt for a strategy of import substitution. Recognizing the availability of organic inputs and production challenges vary from place to place, some organic farmers could consider producing items that are important current imports. Although not all are among the top five organic imports, given U.S. production potential, wine, bell peppers and ginger could be considered among targeted products.
It is important to note, however, that, for perishable products, timing does matter. Marketing windows for produce are relatively short but offer an additional market opportunity to those who can provide a product outside of its standard availability. Additional market opportunities can also be identified through ingredient shortages. Bottlenecks have been identified in the supply of functionally equivalent organic ingredients (Van Camp et al., Reference Van Camp, Ie, Muwanika, Hooker and Vodovotz2010).
Furthermore, in the OTA's 2018 annual survey of organic manufactures, 52% indicated that they foresee having some product shortages but did not expect these to be worse than in previous years. An additional 11% did expect worsening ingredient shortages to the extent that they could hinder product development (OTA, 2019). Several specific foods, including coffee, berries, flax, wheat, soy, sugar, herbs and vanilla were identified as items needing to be more reliably or abundantly available (OTA, 2019).
The impact of OEAs on the trade of U.S. organic agri-food products
Table 2 reports the impact of OEAs on U.S. exports and imports of agri-food products. The aggregate effect of OEAs on U.S. imports and exports from the OEA partner countries of Canada, the EU, Japan, South Korea and Switzerland, are reported in columns 1a and 1b, respectively. These aggregate results, however, are likely to mask some important differences in the effectiveness of the individual agreements. In particular, as the bundle of organic goods tracked by the U.S. differs in their importance relative to the bundle of goods traded with each county, these results are likely to vary across agreements. As such, subsequent columns independently evaluate the trade impacts of the U.S.–Canada (column 2), U.S.–EU (column 3), U.S.–Japan (column 4), U.S.–South Korea (column 5) and U.S.–Switzerland (column 6) agreements. Where possible, the effect of OEAs on exports and imports are seperately evaluated.
Table 2. Impact of organic equivalency agreements on U.S. imports and exports of agri-food products
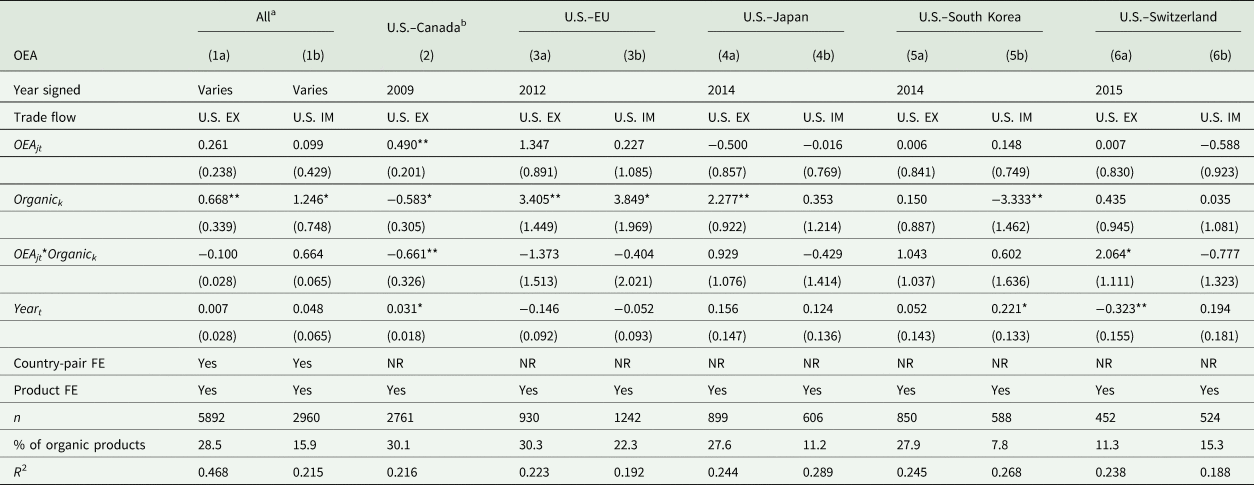
Notes: EX and IM refer to analysis of U.S. Exports and Imports with the OEA partner, respectively.
Standard errors are in parentheses. * (**, ***) denotes significance at the 10 (5, 1)% level.
Product FE reflect fixed effects for HS-6 categories. Country FE reflects fixed effects for each trading pair (i.e., U.S.–Canada).
NR indicates that that FE is ‘Not relevant’ given the model specification.
The period covered by analysis of the U.S.–Canada OEA is 2007–2019; for all other agreements 2011–2019.
a This analysis considers trade between the U.S. and each of the considered OEA partners—Canada, EU, Japan, South Korea and Switzerland.
b As data concerning U.S. organic imports from Canada is not available prior to implementation of this agreement, this flow is not analyzed.
In considering the aggregated impact of U.S. OEAs (OEA; column 1a, 1b), there is no evidence that, when considered together, these agreements had any impact on exports or imports of the agri-food products examined in this analysis. This result could be anticipated. The examined trade flows include both organic and non-organic products. Given the relatively small percent of traded organic products considered in the export and import flows (28.5 and 15.9%, respectively), a strong organic trade impact would have required for this result to be significant. In addition, these results imply that considered together, OEAs do not have a significant spill-over impact on the trade of the non-organic bundle of products (which includes some organic but not tracked) products.
The Organic results reveal that there is a positive and significant difference between trade of the average tracked organic product compared with that of the average non-organic product. Indeed, the mean value of exports for tracked organic products is 95% ((exp(0.668) − 1)*100) higher than the same value for non-organic products (the comparison group). In the case of imports, this difference is even more significant—results indicate that there is a 248% higher mean value of trade of organic compared to non-organic products. While these results are impressive, they need to be considered within the context of the trade data limitations. First, these higher trade values of organic products are relative to the bundle of all other highly disaggregated (HS-10) products included in this sample—which includes both non-organic food products and any organic products which are not tracked. Given this, a large difference in the trade of organic and non-organic products is not unexpected; the tracked organic products are important or there would not have been an incentive to track them in the first place. Second, the per-unit value of organic agri-food products is frequently higher than for conventional versions of the same items. This too many contribute to some of the reported difference in the value of trade between these bundles of goods.
Of particular relevance to this analysis are the results of the interaction term between the OEA and Organic variables. This term evaluates whether the OEAs had a positive impact on the exports (or imports) of tracked organic products. Overall, it was found that, when considered together, these agreements did not significantly affect the trade of tracked organic products. In addition, the time trend, captured by Year, was not statistically significant for either U.S. import or export flows indicating there is no trend across between 2007 and 2019 in the value of the considered traded products (organic and non-organic).
U.S.–Canada OEA
The U.S.–Canada OEA deserves specific consideration. Canada is the most significant trading partner of the U.S.—both in general and, as is depicted in Figure 2, for the tracked organic products. These countries already of have a deeply integrated boarder policies and a long history of successful trading agreements dating back to the Canada–U.S. Free Trade Agreement, which came into force in 1989. The U.S.–Canada OEA was the first of this type of agreement entered by the U.S. and was implemented in 2009.
At present OEAs appear to offer an important benefit to the value of U.S. exports to Canada. This OEA is found to have contributed to a 63% ((exp(0.490) − 1)*100) increase in the exports to Canada of the agri-food products (both organic and non-organic) considered in this analysis. In addition to this increase, the time trend captured by Year, indicates that there has been a significant increase in the value of trade over timeframe considered in this analysis (2007–2019). Perhaps unexpected though, are the results related to the exports of organic products (Organic), or the impact of this OEA to facilitate organic exports (OEA*Organic); in both cases these results are negative. The Organic finding indicates the change in value of tracked organic products has been less than that of the non-organic (including organic but not tracked) products over the examined period. Similarly, the interaction term finding indicates that the OEA did not affect (increase) the value of organic product trade more the change in the value of trade of non-organic products (the reference group) considered in this analysis.
While on the surface, this result is not encouraging, this finding does not necessarily indicate that there has been faltering trade of organic products between Canada and the U.S., or that the OEA has not been successful. OEAs have the potential to impact trade of all organic products—both for the those which are tracked, and those not tracked and included in the non-organic product bundle. Thus, should OEAs positively affect the trade of not-tracked more than tracked organic products, this can lead to a negative coefficient seen in this interaction term. This outcome is more likely in considering the export flows examined here for which far fewer products are tracked.
It is also worth noting that the period of this analysis includes the economic recovery from the Great Recession. While exports of tracked organic products did increase from US$0.20 to 0.28 billion (a 40% increase) in the decade following implementation of this OEA (2009–2019), exports of related non-organic agri-food products increased from US$2.96 to 3.88 billion (a 31.1% increase) during this same period. Thus while organic exports certainly experienced an economically significant increase following implementation of this agreement, this result was not statistically significant compared to the concurrent increase in exports of related products. This outcome is important and is generally consistent with findings of a recent survey conducted by the Organic Trade Association which found that close to 30% of surveyed U.S. organic agri-food businesses indicated that their exports to Canada increased since the implementation of this agreement (OTA, 2019).Footnote 11
Other U.S. OEAs
In many ways, results examining U.S. OEA agreements with the EU, Japan, South Korea and Switzerland are generally consistent with one another. These OEAs have not, themselves, impacted trade of the agri-food products. There is also little evidence of changes in the trade of these agri-food products across time. The exception to this is in the case of U.S. imports from South Korea, and exports to Switzerland, which experienced significant increases and decreases, respectively during the examined period.
These results differ, however, in outcomes related specifically to trade of the tracked organic products. In the case of both imports and exports from the EU, and U.S. imports to Japan, trades of the tracked organic exports are much larger, on average, than those of non-organic products. As the value of tracked products are typically economically significant, and as both the EU and Japan are among the largest U.S. organic agri-food trading partners, it is reasonable that average trade of tracked organic products would be significantly larger than that of non-organic products (the reference group). With the exception of imports from South Korea, there was not a significant difference between average value of trade of organic and non-organic products for other trade flows with Japan, Switzerland, exports to South Korea.
In the case of U.S. organic imports from South Korea, however, these results are negative and statistically significant, implying a lower value of imported organic products compared to non-organic (or organic but not tracked) products. This result is likely due to the specific bundle of organic goods the U.S. has opted to track; the products which South Korea is competitive in exporting to the U.S. are not likely to significantly overlap with the products the U.S. is tracking. As such, while South Korea may have notable exports to the U.S. these may not be reflected in the organic data—leading non-organic exports to be significantly larger than organic. Furthermore, the U.S. and South Korea signed a free trade agreement (KORUS FTA) in 2012. The benefits of this agreement on South Korea's exports to the U.S. may also contribute to this Organic result, and may be the reason for the positive time trend of U.S. imports from South Korea.
In evaluating the OEA agreements with the EU, Japan and South Korea results of the OEA*Organic interaction term indicate that, in general, these agreements do not facilitate a significant change in the trade of tracked organic agri-food products. In the case of the U.S.–Switzerland OEA, however, this agreement did generate a positive and significant increase in U.S. organic exports (column 6a). Indeed, this result indicates that this agreement has facilitated an average of a 688% higher value of organic compared to not-organic (or organic but not tracked) agri-food exports. This result is very large but must be considered in context. This result is not highly significant; it is significant at the P = 0.1 level. Furthermore, as there is not a substantial trade of the considered agri-food products between the U.S. and Switzerland, even a small increase in organic relative to non-organic product trade can generate substantial percent changes.
Conclusions
U.S. domestic demand for organic food is expected to continue growing at rates faster than the overall food market. As the seasonality of fresh produce and bottlenecks in ingredient availability limit domestic variety and product availability, international suppliers of organic agri-food products are likely to play an increasing role in satisfying domestic demand. At the same time, the often-significant margins that exist between prices for organic products and their conventional equivalents (Jaenicke and Carlson, Reference Jaenicke and Carlson2015) are not likely to decrease in the near future. Domestic production of organic agri-foods is also likely to continue to increase, and in instances where the U.S. has a comparative advantage, international markets are expected to continue to be important destinations for these products.
The international market for organic products is evolving. Additional countries, each with their own organic standards, are entering the global market. The potential negative impact of fragmented food standards on international trade is well documented (e.g., Wilson and Otsuki, Reference Wilson and Otsuki2001; Chen and Mattoo, Reference Chen and Mattoo2008). The potential success of ongoing efforts of the Codex Alimentarius Commission to encourage rapprochement of organic standards would be an important evolution of these standards that would greatly facilitate transactions between agribusinesses in different geographic markets. In addition, consistency in organic standards may bolster returns to exporting organic farmers and agribusinesses in countries that do not currently have trade agreements with nations where these products are in greatest demand. In the meantime, there is potential for countries to facilitate use and, indeed, trade of organic products through the formation of additional bilateral equivalency or other agreements. To this end, the U.S. has entered into seven OEAs, and several additional export and recognition agreements over the past two decades.
Comparing descriptive trends in U.S. organic product trade and trading partners offer some important insights into current and potential market opportunities. Apples, grapes and strawberries dominate U.S. exports, while unroasted coffee, bananas and olive oil are the most imported organic products. In the years during which the U.S. has measured organic product flows across its borders (since 2011), the values of both imports and exports of tracked products have consistently increased. A majority of these exports are destined for Canada and Mexico, while Mexico, Peru and Brazil are the primary suppliers of organic products to the U.S. To be clear, however, these traded product, partner and overall trends do not capture the full array of organic agri-food products being traded, but only those which are explicitly tracked by the U.S. Census Bureau's Foreign Trade Division, the USITC, or, in the case of U.S. exports to Canada, Statistics Canada.
A key question of this analysis is whether or not U.S. OEAs have, in any way, affected the country's imports and exports of agri-food products. At this point, the evidence concerning this is mixed and is not strong. At present OEAs appear to offer an important benefit to the value of U.S. exports to Canada. However, as results concerning the impact on organic compared to non-organic product trade are negative, and the time trend positive, it appears that this agreement offers benefits of the exports of not-tracked organic products and/or non-organic products more than tracked organic agri-foods. In contrast, in the case of the U.S.–Switzerland OEA, the agreement appears to have had a positive and significant impact on U.S. exports. Furthermore, this analysis finds no evidence that OEAs significantly increased (or in any way affected) the value of imports of the tracked organic products.
While this evidence is not strong, these results will be largely welcomed by the U.S. organic agri-business community. These findings indicate that the aggregate effect of each national agreement is at worst neutral and, at best, may either have a direct positive impact on U.S. organic exports or spillover benefits to other exported products. While firms who import organic ingredients may wish for a more effective policy tool, growers and agri-businesses that compete with organic imports will also be reassured by these findings.
These results, however, likely do not offer a complete assessment of the value of these agreements.
In the case of exports, assuming that in the short run there is a relatively inelastic supply of organic products, there is the potential that implementing an OEA with one nation might decrease the incentive and availability of organic products to be exported to other partners who have not entered such an agreement. Furthermore, equivalency agreements are primarily designed to enable products to be marketed as organic in the partner country without having to undergo an additional certification step. This reduces exporters' costs and, from the perspective of the U.S., helps expand the reach of the USDA's National Organic Program. In considering OEAs as a policy tool which may indirectly facilitate trade, evidence from the U.S.–Canada OEA indicates that this policy instrument offers promise. It is also worth re-emphasizing that the bundle of tracked organic foods is only a small subset of the variety of organic foods which are being traded; the relative trade of organic products almost certainly be higher if a more complete set of organic products was tracked. Given this, it is likely there may actually be a positive contribution of OEAs to organic product trade which is not possible to identify given the current data limitations. For both of these cases, a more comprehensive record across the array of organic products which the U.S. trades with its OEA partners is needed to holistically assess the trade facilitation potential of these agreements.
Appendix
Table A1. U.S. import organic 10-digit HS codes, descriptions and existing periods
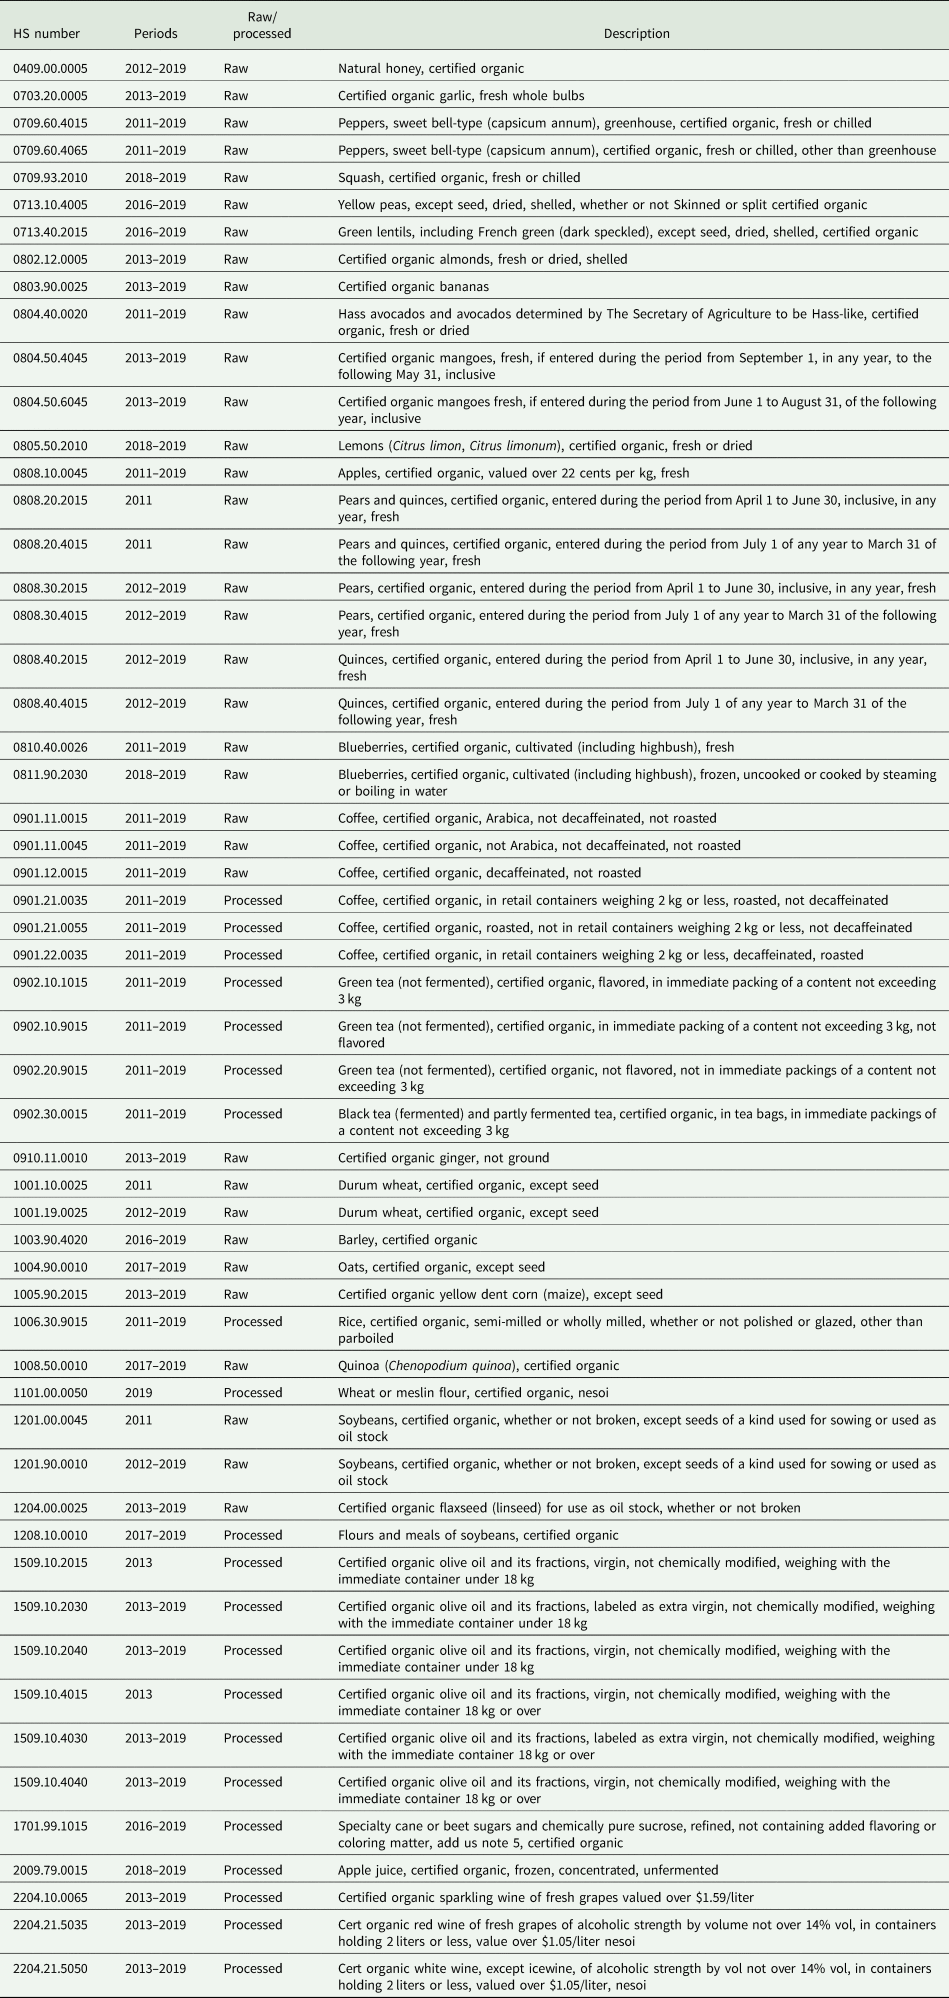
Table A2. U.S. export organic 10-digit HS codes, descriptions and existing periods


 Open access