


INTRODUCTION
The carbon isotopes of dissolved inorganic carbon (DIC) in water are useful indicators for oceanographic and hydrologic studies of carbon behavior. Radiocarbon (14C) concentrations are used as indicators of water residence time, the atmosphere–ocean carbon budget, ocean circulation, and anthropogenic or magmatic carbon supplies (Elliot et al. Reference Elliot, Andrews and Edmunds1999; Iwatsuki et al. Reference Iwatsuki, Xu, Mizutani, Hama, Saegusa and Nakano2001; Matsumoto Reference Matsumoto2007; Ostlund Reference Ostlund1987; Rose and Davisson Reference Rose and Davisson1996; Sikes et al. Reference Sikes, Samson, Guilderson and Howard2000; Takahashi et al. Reference Takahashi, Nakamura, Tsukamoto, Kazahaya, Handa and Hirota2013). International programs that focus on ocean water analyses, such as WOCE, GLODAP, and GEOTRACES (McNichol et al. Reference McNichol, Jones, Hutton, Gagnon and Key1994; Key Reference Key1996; Ge et al. Reference Ge, Wang, Zhang, Luo and Xue2016; Olsen et al. Reference Olsen, Key, van Heuven, Lauvset, Velo, Lin, Schirnick, Kozyr, Tanhua and Hoppema2016), provide experimental protocols for analyzing carbon isotopes to obtain highly accurate data. For CO2 extraction that is used to measure the 14C of DIC in water samples, the bubbling method (WOCE method) is the most widely used. An acidified seawater sample is bubbled with a carrier gas (usually N2) to ensure the CO2 is trapped until the DIC is completely stripped from the sample. Casacuberta et al. (Reference Casacuberta, Castrillejo, Wefing, Bollhalder and Wacker2020) reduced the vial size to 120 mL (60 mL of water) and developed an automated experimental system coupled with an automated graphitization equipment (AGE) system (Wacker et al. Reference Wacker, Němec and Bourquin2010) to realize high-density observations. Because a bubbling container with a fixed volume is used, the bubbling method is suitable for samples with relatively constant DIC concentrations, such as seawater. To carry out the bubbling method, a certain volume of water is needed. Therefore, the bubbling method is difficult to adapt for water samples with wide ranges of DIC concentrations, such as groundwater and hot spring water, from below 0.5 mmol·L−1 to over 100 mmol·L−1, especially high-DIC-concentration waters. To adapt such samples to the bubbling method, extra-treatments of changing to a large volume bubbling container or diluting water samples with carbon-free water are needed.
The headspace gas extraction method has been employed instead of water bubbling in several studies (Molnár et al. Reference Molnár, Hajdas, Janovics, Rinyu, Synal, Veres and Wacker2013; Gao et al. Reference Gao, Xu, Zhou, Pack, Griffin, Santos, Southon and Liu2014). This extraction method is commonly used for stable carbon isotope (δ13C) measurements (Atekwana and Krishnamurthy Reference Atekwana and Krishnamurthy1998; Torres et al. Reference Torres, Mix and Rugh2005; Miyajima et al. Reference Miyajima, Tsuboi, Tanaka and Koike2009; Mažeika et al. Reference Mažeika, Martma, Petrošius, Jakimavičiūtė-Maselienė and Skuratovič2013; Meier and Sharma Reference Meier and Sharma2015; Sack and Sharma Reference Sack and Sharma2014; Takahashi et al. Reference Takahashi, Handa, Sugiyama, Matsushita, Kondo, Kimura and Tsujimura2019a). A water sample is injected into an acid-containing vial filled with He or N2 gas. CO2 is released into the headspace of the vial, ensured by syringe extraction or carrier gas purging. Because small vials (usually ∼12 mL) are used for δ13C measurement in the headspace method, water samples that can be applied to this method are limited to those with relatively high DIC concentrations. Gao et al. (Reference Gao, Xu, Zhou, Pack, Griffin, Santos, Southon and Liu2014) and Molnár et al. (Reference Molnár, Hajdas, Janovics, Rinyu, Synal, Veres and Wacker2013) established the headspace extraction method for 14C measurement using 60-mL and 36-mL vials, but the volume are still smaller than those used in the bubbling method. When treating waters with low DIC concentration, CO2 must be extracted multiple times from different vials of water. In fact, Takahashi et al. (Reference Takahashi, Minami, Aramaki, Handa, Saito-Kokubu, Itoh and Kumamoto2019c) treated 14C water samples (∼1 mmol·L−1) by combining CO2 obtained through duplicate extractions from two or three different vials. The headspace method is suitable to treat small volumes of water, but it is difficult to treat large volumes of water. This means that the treatable volume of water differs between the bubbling and headspace methods, and thus various water samples with wide ranges of DIC concentrations are difficult to treat by both methods.
The precipitation method has also been widely used, especially in studies of groundwater (Carmi et al. Reference Carmi, Noter and Schlesinger1971; Haynes and Haas Reference Haynes and Haas1980; Drimmie et al. Reference Drimmie, Aravena, Wassenaar, Fritz, Hendry and Hut1991; Aucour et al. Reference Aucour, Sheppard, Guyomar and Wattelet1999; Alvarado et al. Reference Alvarado, Pačes and Purtschert2013; Burg et al. Reference Burg, Zilberbrand and Yechieli2013; Mažeika et al. Reference Mažeika, Martma, Petrošius, Jakimavičiūtė-Maselienė and Skuratovič2013; Minami et al. Reference Minami, Kato, Horikawa and Nakamura2015). In this method, DIC is precipitated as carbonate material (BaCO3 or SrCO3) by adding BaCl2 or SrCl2 to the sample and controlling the pH using alkaline reagents. The precipitated carbonate is filtered or decanted and reacted with acid (normally H3PO4) to release CO2 under a vacuum system. The precipitation method is satisfactory for water samples with a wide range of DIC concentrations and no carrier gas use and can provide reliable 14C results. However, good agreements and disagreements of the 14C results relative to those obtained using the bubbling or headspace methods have been reported (Takahashi et al. Reference Takahashi, Minami, Aramaki, Handa, Saito-Kokubu, Itoh and Kumamoto2019c). Nakata et al. (Reference Nakata, Hasegawa, Iwatsuki and Kato2016) noted that modern carbon contamination was occurring from the NaOH reagent used for pH control. Although this risk of obtaining incorrect values can be prevented by using appropriate reagents and improved procedures, it is possible that the precipitation method may produce inaccurate results. The co-existing SO4 2− in water can inhibit the precipitation of carbonates and affects carbon isotopic analyses (Kusakabe Reference Kusakabe2001; Takahashi et al. Reference Takahashi, Minami, Aramaki, Handa, Saito-Kokubu, Itoh and Kumamoto2019c). Hence, we cannot reliably use the precipitation method as the dominant method.
The gas-permeable polymer membrane contactors have also been utilized to extract carbon from CO2 in water (Gospodinova et al. Reference Gospodinova, McNichol, Gagnon and Walter2016; Yokochi et al. Reference Yokochi, Bernier, Purtschert, Zappala, Yechieli, Adar, Jiang, Lu, Mueller and Olack2018). The membrane contactor acts as an interface between the gas and liquid phases as a physical barrier that separates liquid water from the gas phase. Gas permeates from the liquid side using differential partial pressure, and CO2 in the gas is trapped cryogenically. The membrane contactor extraction method developed by Yokochi et al. (Reference Yokochi, Bernier, Purtschert, Zappala, Yechieli, Adar, Jiang, Lu, Mueller and Olack2018) was originally designed for a large volume of water, from which radiokrypton was extracted. Another potential CO2 extraction approach is the use of headspace equilibration and molecular sieve traps (Garnett et al. Reference Garnett, Billett, Gulliver and Dean2016). This method is focused on analyzing the 14C of aquatic CO2 in water to investigate CO2 evasion from inland water. Therefore, these methods do not include sample acidification and require large water samples (100–200 L or 2–5 L). As a result, they cannot extract carbon species of HCO3 − and CO3 2− from water because of the lack of pH control. When these degassing systems are adapted to analyze the 14C of total DIC, they require modifications that reduce their scale and add an acidification procedure. This would introduce additional complications and is difficult.
In this study, we tried to establish CO2 extraction procedure that can treat water samples with a wide range of DIC concentrations. The required specifications for the developed procedure are as follows: (1) A variable water volume (1–250 mL) injected into the system, depending on the DIC concentration (0.4–100 mmol·L−1 in the case of 1.2 mgC) of the sample. This requirement is compatible with extraction from terrestrial waters, as well as from seawater. (2) A simple procedure and a compact system (easy and inexpensive). The development of an automated carbon extraction system is above the required specifications for hydrological research, which measures two or three dozen samples per year, unlike oceanographic studies. Hence, the implementation cost of such an apparatus is not justified. (3) An acceptable time required to conduct a sample treatment (∼30 min per sample). (4) A high extracted CO2 yield and reliable 14C analysis.
METHODS AND SAMPLES
CO2 Extraction Procedure (ReCEIT)
The bubbling method cannot treat a volume of 1 mL or less water since this amount of water cannot do bubbling. The method that satisfied our required specifications was the headspace method since it can treat a wide range of volumes. However, there were two problems in the existing headspace method: first was the limitation of treatable water volume, and second was the efficiency of CO2 extraction from a large volume of water. In the method developed in this study, a glass flask was used for the extraction container (100, 300, and 500 mL), which was used to treat water samples with a wide range of DIC concentrations (Figure 1). In a previous study, the extraction container was sealed with a rubber septum and a screw nut or swaged aluminum cap, and CO2 gas was extracted by a carrier gas through a needle. We changed the CO2 extraction procedure using the carrier gas to carry it out under vacuum conditions. The flask was connected to the vacuum line using O-ring fittings via a connector with a pierceable septum (Labco grey chlorobutyl septum, Labco Ltd., UK) sealed with a screw cap and a greaseless O-ring stopcock (SD valve; Koshin Rika Ltd., Japan) as shown in Figure 2. Hereafter, the assembled flask and connector (Figure 1) is referred to as the reaction container. By using the connector with a stopcock, the inside of the reaction container can be evacuated. A water sample was injected into the reaction container through the needle that pierced the rubber septum.

Figure 1 Reaction container assembled from a flask and connector. SJ: seal joint (Koshin Rika Ltd., Japan), S: pierceable septum (Labco grey chlorobutyl septum, Labco Ltd., UK), OSJ: O-ring seal joint (Koshin Rika Ltd., Japan), V: greaseless O-ring stopcock (SD valve; Koshin Rika Ltd., Japan), RF: reaction flask.

Figure 2 Schematic illustration of CO2 extraction from DIC in water using the ReCEIT procedure. (1) Set up the reaction container. (2) Water sample injection. (3) Repeated cycles: Water vapor and CO2 were ensured at cryogenic traps #1 and #2, respectively. The alternating opening of valves-A and -C can reduce amount of water condensed at trap #1 to be < ∼1 mL. The tube of trap #1 is exchangeable for every sample to remove water.
The operating procedure is characterized by repeated cycles of gas extraction into the headspace, extracted gas introduced into the vacuum line, and cryogenic trapping (Figure 2). We refer to this procedure as the ReCEIT (repeated cycles of extraction, introduction, and trapping). Step 1: A magnetic stir bar and 5 mL of phosphoric acid (85%, guaranteed grade) were placed into a flask. The flask was attached to the connector (Figure 1). The pierceable rubber septum was placed between the glass of the connector and the plastic spacer in the seal joint (SJ in Figure 1; Koshin Rika Ltd., Japan). The air inside the reaction container was evacuated for over an hour using a vacuum pump below 0.1 Pa. The seal joint was re-tightened slightly five minutes after starting the evacuation in order to ensure a reliable seal. This re-tightening is important because a hard tightening of the seal joint distorts the septum. Step 2: A water sample was injected by vacuum suction into the reaction container through a needle (20 G, 70 mm) connected to a plastic tube. Before injection, the needle and plastic tube were filled with the sample water to remove any air. The volume of water analyzed was calculated using the weights of the reaction container before and after sample injection. The maximum water volume is approximately half of the volume of the flask. If the volume of water injected into the reaction container was small, a gas-tight syringe was used. Step 3: An interval between Steps 2 and 3 is not required. CO2 released into the headspace of the reaction container was introduced into the vacuum line and cryogenically purified. Gases in the headspace of the reaction container are introduced by expansion based on the pressure differential to valve-C in Figure 2. For effective gas introduction, two reservoirs (180 mL and 500 mL) were set into the line. The reaction flask connector valve and the valve immediately before the cryogenic traps (valves -A and -C in Figure 2) were opened in an alternating order to prevent a large volume of water vapor reaching to traps. The expanded gases in the two reservoirs were collected by two cryogenic traps and un-trapped gases were removed by a vacuum pump. Step 4: The ensured gas to trap #2 in Figure 2 is purified to CO2 cryogenically according to the procedures of each laboratory. After that, the CO2 gas is quantified to proceed to the next step of making graphite target for 14C analysis.
When a high CO2 yield is necessary, the cycle of expansion and cryogenic trapping (Step 2) should be repeated several times (e.g., 4 cycles), but we found in this study that one cycle is enough only for 14C analysis (see Results and Discussion). The treatment time depends on the number of cycles not on the water amount. One cycle of Step 3 takes about 3 to 4 minutes. The total times required for Steps 3 and 4 are ca. 20 minutes and ca. 30 minutes for 1 cycle and 4 cycles of Step 3, respectively.
14C and δ13C Measurements
The CO2 extracted from the samples was purified cryogenically using an ethanol-slush trap (ca. −100°C) and liquid nitrogen traps in the vacuum line. The CO2 was quantified using a capacitance manometer (Baratron® 722A low pressure type, MKS Instruments Inc., USA) to compute the yield. Purified CO2 was sealed in a Pyrex tube for storage. For 14C analyses, CO2 gas was treated by with Sulfix (8–20 mesh, Kishida Chemical Co., Ltd., Japan) as appropriate, and reduced to graphite with hydrogen gas to produce measurement targets for 14C analysis.
The 14C concentrations were measured using accelerator mass spectrometry (AMS; model 4130-AMS, HVEE, the Netherlands) at the Institute for Space-Earth Environmental Research at, Nagoya University, Japan (Nakamura et al. Reference Nakamura, Niu, Oda, Ikeda, Minami, Takahashi, Adachi, Pals, Gottdang and Suya2000) relative to the NIST oxalic acid standard (SRM 4990C: HOx-II). Isotope fractionation was corrected using the 13C/12C ratio measured using AMS. The δ13C values of the extracted CO2 were measured using an isotope ratio mass spectrometry (IRMS) with a dual inlet (Delta-V Advantage, Thermo Fisher Scientific, Inc., USA) at the Geological Survey of Japan. The δ13C values were determined with respect to the Vienna Pee Dee Belemnite (VPDB) standardized by NBS-19 (Coplen et al. Reference Coplen, Brand, Gehre, Gröning, Meijer, Toman and Verkouteren2006). The δ13C values and DIC concentrations of water samples were directly measured using a continuous-flow isotope ratio mass spectrometer coupled with gas chromatography (GC-IRMS; Delta-V Advantage with Gas Bench II, Thermo Fisher Scientific, Inc., USA) at the Geological Survey of Japan (Takahashi et al. Reference Takahashi, Handa, Sugiyama, Matsushita, Kondo, Kimura and Tsujimura2019a). Samples measured using GC-IRMS are described in the respective sections. The DIC concentrations were calculated from the peak area of the GC-IRMS measurements. A calibration curve was generated using NaHCO3 solutions with concentrations of 1–50 mmol·L−1, prepared by diluting a 1 mol·L−1 NaHCO3 standard solution for ion chromatography (Kanto Chemical Co. Inc., Japan).
Repeated Cycles of CO2 Extraction
The ReCEIT procedure contains several repeated cycles of CO2 extraction into the headspace of the reaction container, expansion of the extracted gas into the vacuum line, and cryogenic trapping of CO2 (Figure 2). To determine the optimal number of cycles, CO2 extractions were carried out with repeated cycles of 1, 2, 3, and 4 times using NaHCO3 solutions and some artificial water samples. The NaHCO3 solutions were prepared from a 1 mol·L−1 ion chromatography standard (Kanto Chemical Co. Inc., Japan) by dilution with ultra-purified water (Milli-Q Direct 8 or Milli-Q Integral 3, Merck Millipore Co., USA) to 1.2 mmol·L−1, 3 mmol·L−1, and 6 mmol·L−1. The ultra-purified water had an 18.2 MΩ·cm resistivity at 25°C, ≤ 5 ppb TOC, and < 1 particulate·mL−1 (size > 0.22 µm). NaHCO3 is known to have a very low 14C concentration (Takahashi et al. Reference Takahashi, Minami, Aramaki, Handa and Matsushita2019b, 2019c). The artificial water samples (W09–W14) used in this study were made by Takahashi et al. (Reference Takahashi, Minami, Aramaki, Handa, Saito-Kokubu, Itoh and Kumamoto2019c) in order to compare inter-laboratory 14C concentrations. They were designed to have similar chemical contents as natural waters (Table 1). The fraction of modern carbon (F14C) values (Stenström et al., Reference Stenström, Skog, Georgiadou, Genberg and Johannsson2011) of samples W09–W14 were reported to be 0.0055–0.9918 (Takahashi et al. Reference Takahashi, Minami, Aramaki, Handa, Saito-Kokubu, Itoh and Kumamoto2019c), but there is a possibility of secular changes in DIC concentration, 14C concentration, and δ13C. Takahashi et al. (Reference Takahashi, Minami, Aramaki, Handa, Saito-Kokubu, Itoh and Kumamoto2019c) reported such secular changes during the preservation period.
Table 1 Chemical composition and assumed types of natural water of six artificial water samples used in this study. The chemical data, except for DIC, were listed in the chemical composition at the end of the campaign of Takahashi et al. (Reference Takahashi, Minami, Aramaki, Handa, Saito-Kokubu, Itoh and Kumamoto2019c). DIC concentration was measured by GC-IRMS at the time of CO2 extraction in this study.

We measured the CO2 yields, δ13C values, and 14C concentrations to compare the results of 1–4 extraction cycles. Water volumes injected into the reaction containers were 1.16–255 mL, corresponding to ∼1–210 mmol·L−1 DIC concentrations. Before injection samples W09–W14 were homogenized in a single container. Therefore, the results from samples W09–W14 can be compared for 1–4 extraction cycles. Meanwhile, NaHCO3 solution concentrations were 1.2, 3, and 6 mmol·L−1. Due to a flaw in the experimental design, the solutions at each concentration were not homogenized. Therefore, the solutions used in cycles 1 and 4 were a little different from the solutions used in cycles 2 and 3.
Blank Estimation
We estimated the system blank for all the operating processes (e.g., needle piercing to septum, leakage from connections, and acid background) in the ReCEIT procedure using the amount of CO2 extracted from Milli-Q water. Although Milli-Q water has very low concentrations of dissolved materials, it might contain a gas component dissolved from the atmosphere. The amount of dissolved CO2 is proportional to the volume of Milli-Q water. The system blank of the ReCEIT procedure, excluding the water itself, was estimated using several Milli-Q waters (43–248 mL) by extrapolating the data so that the amount of water is zero. The volume of the reaction flask used for the blank estimation analyses was 500 mL. Four extraction cycles were used for all treatments.
It is possible that carbon contamination may occur during water injection into the reaction flask if the injected water was exposed to the ambient air. Such contamination can be eliminated by injecting under CO2-free conditions in a glovebox, where delicate operations are difficult. Moreover, it is difficult to eliminate all CO2 from the box. If there is no effect on carbon contamination, water injection into the reaction flask without using a glovebox saves time and effort. Setting the water intake tube around the bottom of the sample container would prevent samples from being exposed to ambient air CO2. We assessed the CO2 contamination of the injection process with and without eliminating the ambient CO2. A relatively low concentration NaHCO3 solution (0.6 mmol·L−1) was used to sensitively detect any CO2 contamination. The NaHCO3 solution was divided and poured into three plastic bottles outside a glovebox. Two bottles were placed in a glovebox, then the CO2 in the glovebox was absorbed by an alkali reagent (Thomas® Ascarite II CO2 Absorbent, Thomas Scientific, USA). The two NaHCO3 solutions were injected into the reaction containers in the glovebox under CO2-free conditions, while the other solution was injected without using the glovebox (hereafter referred to as NaHCO3-free and NaHCO3-normal, respectively). We consider that the CO2 contamination of the NaHCO3 during preservation is negligible because it was stored in PAN (acrylonitrile butadiene methyl acrylate) bottles with a high performance of gas barrier (Takahashi et al. Reference Takahashi, Minami, Aramaki, Handa and Matsushita2019b).
RESULTS AND DISCUSSION
Optimal Number of Repeated CO2 Extraction Cycles
We compared the CO2 yields with the number of repeated cycles (Table 2). Higher CO2 yields were obtained when more cycles were used for almost all water samples, except W14. A CO2 yield of close to 100% was obtained after 4 cycles of extraction. The δ13C values of these extracted CO2 samples are almost identical to the δ13C values measured using GC-IRMS (Table 3). Sample W14 did not show a clear relationship between the CO2 yield and the number of repeated cycles. In addition, the δ13C values of the CO2 extracted from sample W14 were scattered among the number of cycles. The vacuum conditions inside the reaction container at sample injection splashes some of the sample water on the inside wall of the connector. The reaction container did not tilt over 90° to prevent wetting of the O-ring joint and septum. Therefore, the splashed water could not react with the acid in the flask. In cases where the injected water volume is small, as with sample W14, the influence of splashed and unreacted water on CO2 released from the sample could increase and produce more widely scattered results. Therefore, the CO2 yield and δ13C of sample W14 were not used for further discussion in this study.
Table 2 CO2 yields for 1–4 repeated extraction cycles. Samples A/B: 1.2 mmol·L−1 NaHCO3, C/D: 3 mmol·L−1 NaHCO3, E/F: 6 mmol·L−1 NaHCO3. Samples A, C, and E were used for 1 and 4 repeated cycles, B, D, and F were used for 2 and 3 repeated cycles. The relatively higher error in the CO2 yields of samples W11 and W12 was derived from the large error in the DIC analyses.
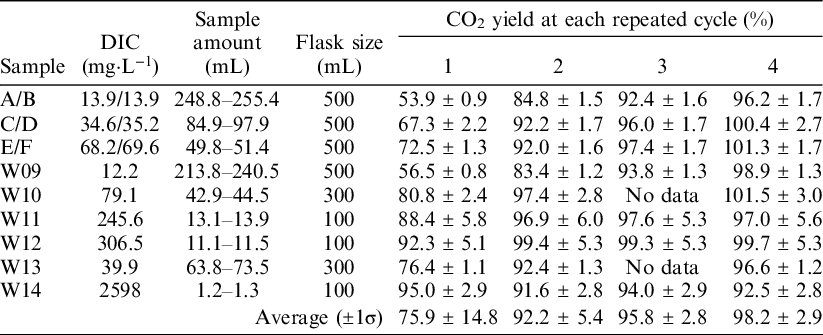
Table 3 δ13C values of the water samples and extracted CO2 from 1–4 repeated extraction cycles, and δ13C discrepancies between the ReCEIT and GC-IRMS results (Δδ13C). The descriptions of sample A–E are same as Table 2. *: Data of sample W14 were not used for calculation.

When the water volume was small, the CO2 was collected with sufficient yield, even when many cycles of CO2 extraction were not carried out (Figure 3a, Table 2). The CO2 yield changed with the sample volume, and the degree of this change decreased gradually with more repeated cycles. The increase in CO2 yield was larger for the first few cycles, especially in the case of a large sample volume. When less than 100 mL was injected, the CO2 yield reached 90% after 2 cycles, 95% after 3 cycles, and 98% after 4 cycles. Four cycles of extraction provided more than 95% CO2 yields for all samples, and 98% yields for almost all of the samples with volumes of less than ∼250 mL. The δ13C values of the extracted CO2 decreased with increasing CO2 yield and the number of cycles (Figure 3b). We postulate that the δ13C changes were caused by isotopic fractionation among the carbon species in water and the headspace CO2. The dominant carbon species in the water is H2CO3 or CO2 (aq) due to the low pH. The δ13C fractionation between the aqueous and gaseous CO2 (εaq-g) was calculated as −1.21‰ at an approximate room temperature of 20°C using the equation from Zhang et al. (Reference Zhang, Quay and Wilbur1995). Hence, the δ13C of the CO2 gas is higher than that of the equilibrium CO2 (aq). The δ13C changes in the extracted CO2 with CO2 yield, shown in Figure 3b, can be explained mainly by Rayleigh fractionation, although they do not match exactly. If the δ13C fractionation is assumed to be −0.6‰ to −0.2‰, the calculated value matches well with the observed changes. The difference in fractionation values reported by Zhang et al. (Reference Zhang, Quay and Wilbur1995) was −1.21‰, and the measured values were −0.6‰ to −0.2‰, which was likely caused by the fact that aqueous and gaseous CO2 did not reach equilibrium in the reaction container. The δ13C changes in the extracted CO2 were expected to be 0.15‰ for a CO2 yield of 90%, 0.10‰ for a 95% yield, and 0.05‰ for a 98% yield, based on Rayleigh fractionation and assuming that the fractionation value was −0.6‰. The δ13C discrepancy between the results using the ReCEIT and GC-IRMS analytical methods decreased with an increasing number of cycles to 0.02 ± 0.06‰ on average (Table 3). The number of repeated cycles should be determined based on the required δ13C measurement precision by referring to the CO2 yield and the respective water volumes shown in Figure 3.

Figure 3 Results of assessments of 1–4 repeated extraction cycles. (a) The relationship between the CO2 yield and the water volume for repeated cycles. DIC concentrations are shown as corresponding to 1 mg carbon at each respective water amount. (b) Changes in δ13C values of the extracted CO2 (Δδ13C) along the CO2 yield. The dashed lines: the isotopic change based on Rayleigh fractionation (fractionation factors: −1.21‰, −0.6‰, and −0.2‰).
With regards to F14C, the individual solutions had identical values for the 1–4 repeated CO2 extraction cycles (Figure 4). This constant relationship is also observed in δ14C, which is not corrected for isotopic fractionation. The isotopic fractionation during CO2 extraction observed in δ13C did not influence the 14C results because the fractionation factor is too small. Therefore, we can extract CO2 gas for 14C measurements from one ReCEIT cycle if a sufficient amount of CO2 gas can be obtained. However, we must pay attention to the fact that CO2 extracted from one cycle does undergo isotopic changes, especially in δ13C, owing to fractionation.
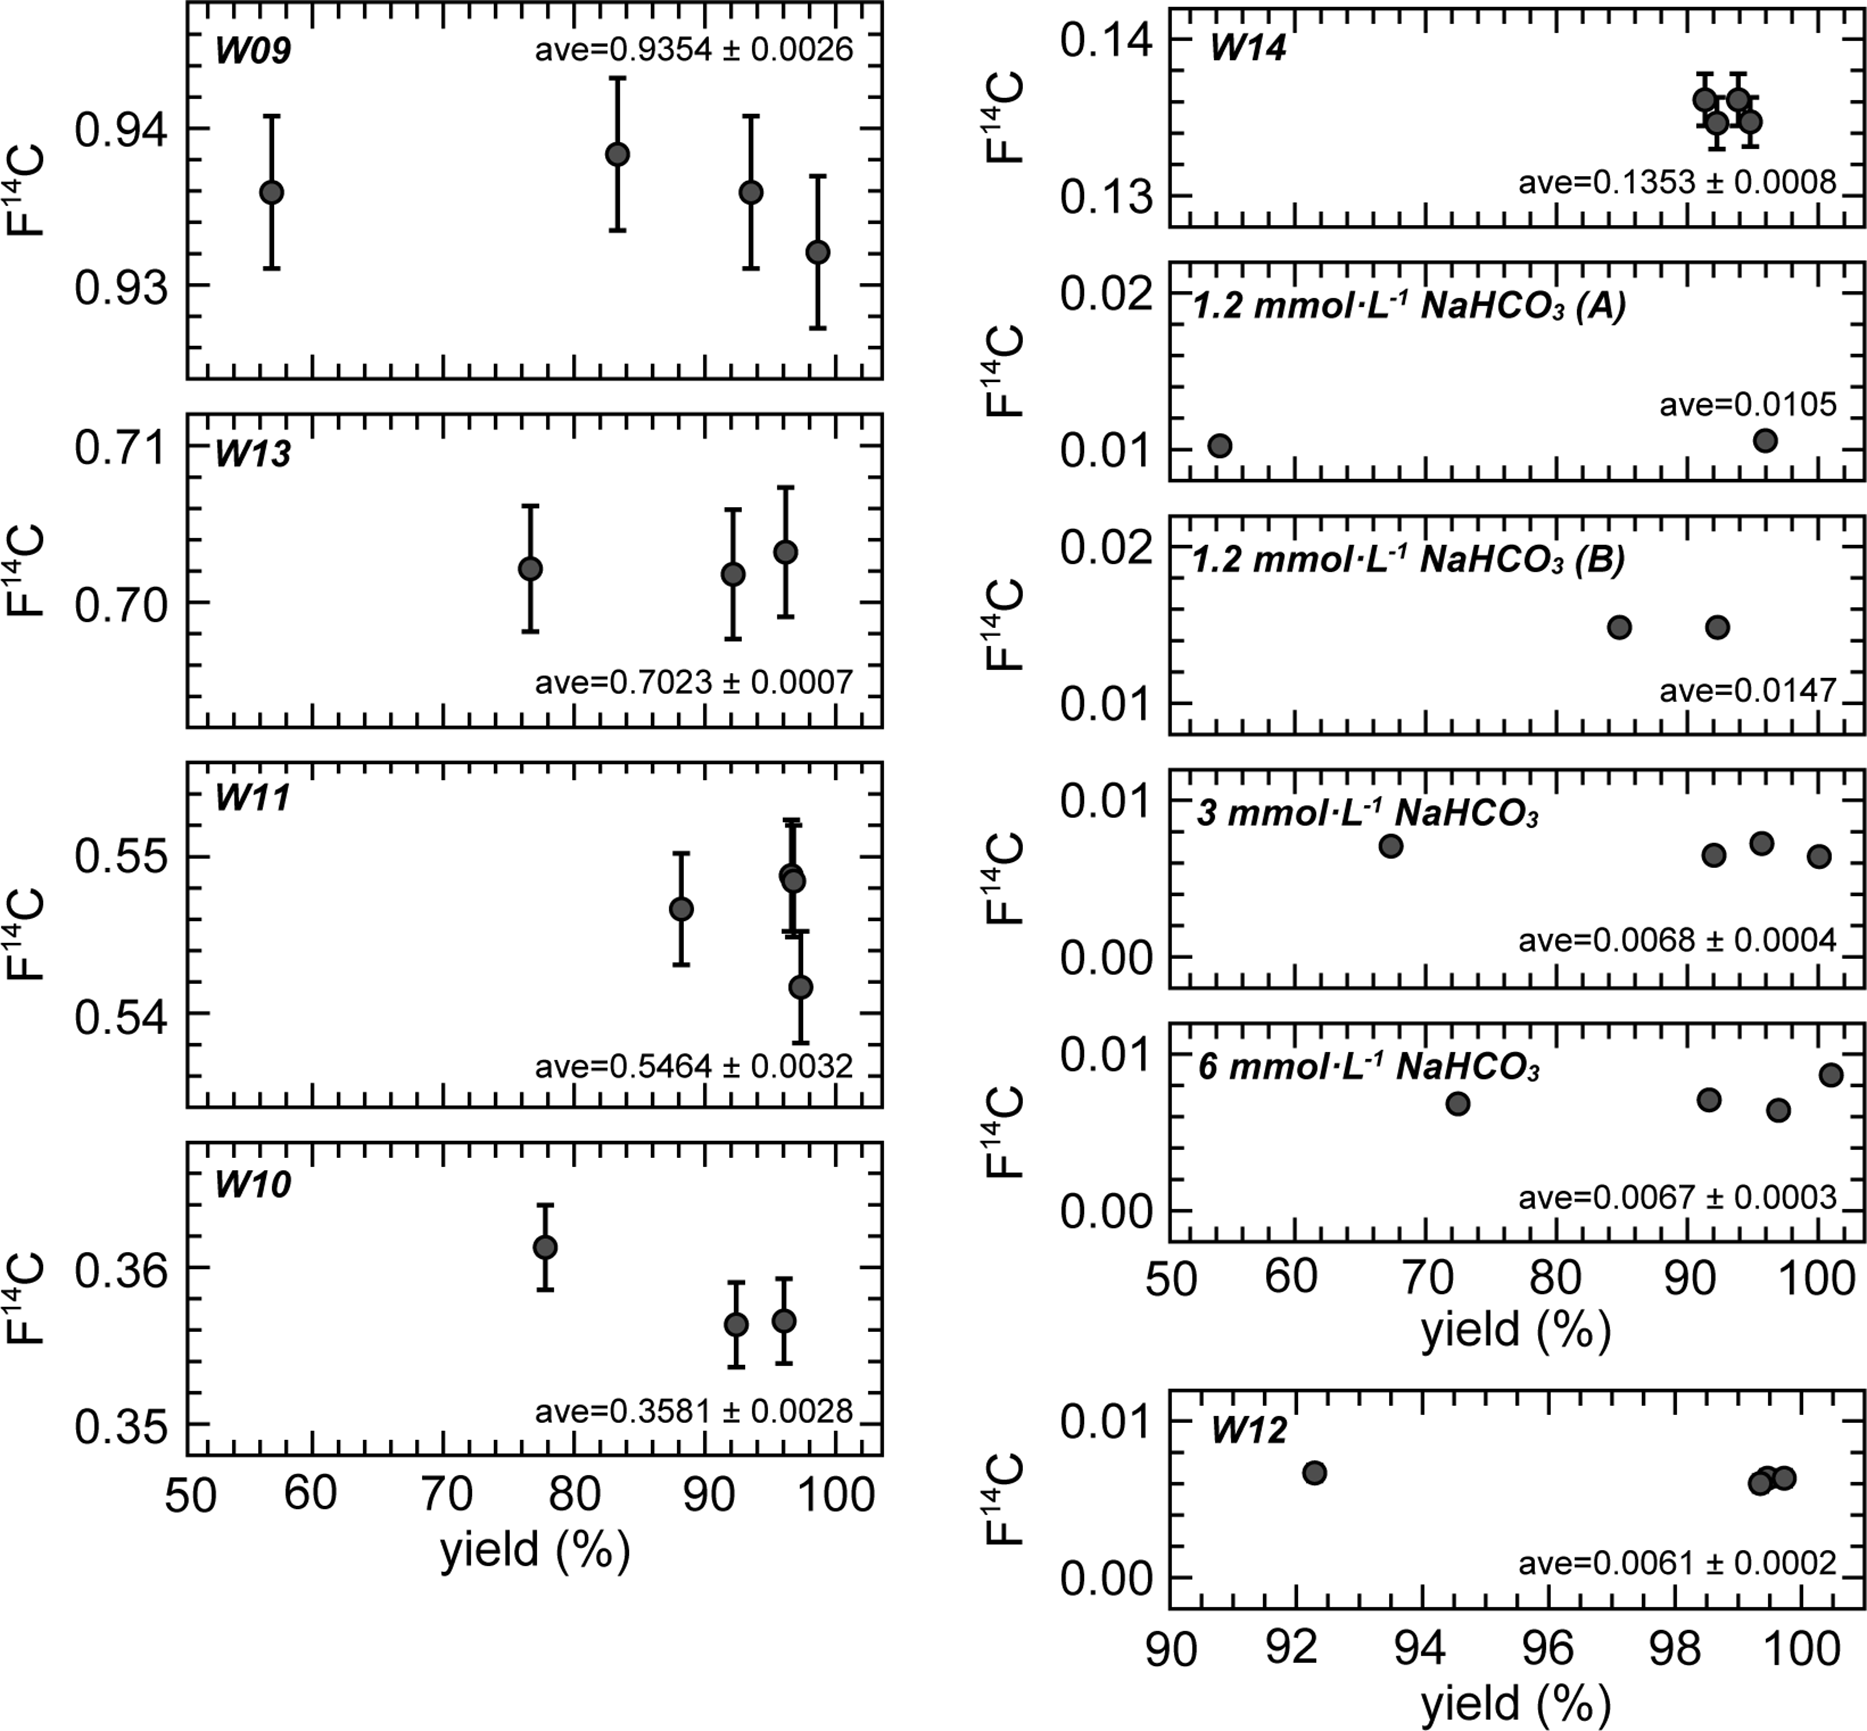
Figure 4 F14C of the extracted CO2 for 1–4 repeated cycles. The “ave” indicates the average values with a standard deviation. CO2 yield of W14 is for reference only (see text).
As mentioned above, two sets of NaHCO3 solutions were independently prepared for 1 and 4 cycles, and 2 and 3 cycles. Two different NaHCO3 solutions of 3 mmol·L−1 and 6 mmol·L−1 exhibited identical F14C values, but the 1.2 mmol·L−1 exhibited different values. Other preliminary experiments using NaHCO3 solutions (1, 2, 3, and 4 mmol·L−1) showed F14C increases of 0.002–0.007 in solutions with concentrations below 2 mmol·L−1. Casacuberta et al. (Reference Casacuberta, Castrillejo, Wefing, Bollhalder and Wacker2020) reported that a 14C blank in Milli-Q water decreased after acidification, heating overnight, and finally flushing with He into Milli-Q water. They showed that the F14C of the Milli-Q containing IAEA-C1 decreased from ∼0.02 to 0.0042 using this treatment. Another cause of the increase in F14C in NaHCO3 solutions below 2 mmol·L−1 is modern CO2 contamination from ambient atmosphere during solution preparation (dilution of the NaHCO3 solution). Such contamination does not become apparent for solutions with higher DIC concentrations. Because the Milli-Q water used to dilute the NaHCO3 reagent in this study did not undergo such pre-treatment, we consider that the F14C results of the NaHCO3 solutions cannot represent the 14C background using the ReCEIT method.
The standard deviations (1σ) in F14C of the NaHCO3 solutions and sample W12, which have low F14C values (note: they are not 14C background), ranged from 0.0002 to 0.0004. Regarding the above 0.1 F14C values, the deviations (1σ) were below 0.8% of the F14C values. We therefore determined that the ReCEIT method can extract CO2 from DIC in water with a high F14C precision. We recommend 4 repeated cycles if a high CO2 yield from a large water volume is required. However, one cycle of extraction was sufficient to obtain CO2 from a sample to measure the 14C when the DIC concentration was greater than ∼10 mg·L−1 and the sample volume was 250 mL that is the maximum water volume analyzed using the ReCEIT method at present. Because the maximum water volume is limited by the size of the reaction container, there is the potential to increase this volume. At the lower limit of analysis, a water sample of ∼1 mL had uncertainties in the CO2 yield and δ13C results, likely due to splashing of the sample in the reaction container at injection, while the F14C result was not influenced. Therefore, a water sample even below 1 mL can be treated by the ReCEIT method for the measurement of 14C. We conclude that the ReCEIT method can treat water samples with a wide range of DIC concentrations.
Blank Estimation of the ReCEIT Method
In order to check for air leaks inside the reaction container, which includes the flask and connector, the pressure changes inside the reaction container were measured for 10 days after evacuation using a capacitance manometer (Baratron® 722A low-pressure type, MKS Instruments, USA) connected to a glass joint with an O-ring fitting. The pressure changes were below 10 Pa, which is the detection limit of the capacitance manometer. If the interior pressure change and ambient CO2 concentration are assumed to be 10 Pa and 400 ppm, respectively, the CO2 contamination in the reaction container was estimated to be 0.013 µgC, even though the dead volume of the joint was considered. This value is the maximum amount of CO2 contamination for a 10-day period because the assumed value of 0.01 kPa was overestimated. The actual amount of CO2 contamination in the reaction container might be smaller. Therefore, we concluded that air contamination during the extraction processes may be negligible.
The amount of CO2 extracted from the Milli-Q water increased as the water volume increased (Figure 5). The range shown in Figure 5 is much smaller than that of the dissolution amount of CO2 at equilibrium with the air. This is likely caused by disequilibrium, because the Milli-Q water was used immediately after purification. The extrapolated value of 0.1 ± 1.9 µgC at a zero water volume was considered as the blank for the ReCEIT extraction system. Modern carbon contamination of 0.1 µgC increased to ∼0.0001 in F14C, when we analyzed a water sample containing 1 mgC of dead carbon. In the case of the maximum error (2.0 µgC of blank), the 14C influence increased to ∼0.002 in F14C. These estimated blanks of F14C are sufficiently low for analyzing water samples.

Figure 5 Relationship between CO2 extracted from Milli-Q water and the analyzed water volume.
The results of the assessment of CO2 contamination during sample injection are shown in Table 4. Although the assessment was carried out under harsh conditions such as low DIC concentrations and high solution pH, the 14C concentrations of the “NaHCO3-normal” were between two of the “NaHCO3-free” results and were identical to each other within error. We concluded that the influence of CO2 contamination during sample injection into the reaction flask is negligible, even though the operation was carried out in air and without a glovebox. Practically, some natural samples are expected to have a F14C of zero and a low DIC concentration in hydrological studies. Therefore, we suggest the use of a glovebox when analyzing these samples by this CO2 extraction method.
Table 4 F14C and δ13C values of the NaHCO3 solutions analyzed for carbon contamination from air during water injection.

CONCLUSIONS
A method for extracting CO2 from DIC in water was developed. This method is simple and cost-effective, as it requires only slight modifications to the vacuum line for CO2 purification and graphitization of organic materials. The operating procedure was composed of repeated cycles of CO2 gas extraction into the headspace of the reaction container, expansion of the extracted gas into the vacuum line, and cryogenic trapping of CO2. We refer to this procedure as repeated cycles of extraction, introduction, and trapping (ReCEIT). The advantages of this method are the lack of a required carrier gas and that samples with a wide range of DIC concentrations can be analyzed. The ReCEIT method can treat various amounts of water with a wide range of DIC concentrations.
The cycle of CO2 extraction and trapping was repeated several times to achieve a high CO2 yield. When volumes under 100 mL were analyzed, their CO2 yields reached 90% after 2 cycles and 95% after 3 cycles. The CO2 yield reached ∼98% when 4 cycles were carried out. The δ13C values of the CO2 extracted from 4 repeated cycles and the GC-IRMS measurements were within 0.02 ± 0.06‰. 14C concentrations can be measured using CO2 gas extracted from one cycle, if a sufficient amount of CO2 gas was obtained, because the F14C values were constant within the error range regardless of the CO2 yield.
The blank level of the ReCEIT system was estimated as 0.1 ± 0.9 µgC using ultra-purified water. This blank provided a 14C increase of ∼0.0001 in F14C when 1 mg of dead carbon sample was analyzed. The exposure of water samples to the air during injection did not influence the 14C results, even if the ambient air was not treated to remove CO2, with the exception of water samples with very low DIC and 14C concentrations. We conclude that the ReCEIT method is useful for effectively extracting CO2 from DIC in water to obtain accurate 14C results.
ACKNOWLEDGMENTS
The authors thank Professor Emeritus Toshio Nakamura and Ms. Rina Sato, Nagoya University for their help with the AMS measurement and the CO2 extraction experiment, respectively. We also thank Associate Editor Dr. Ann McNichol and two anonymous reviewers for their comments and suggestions. This study was partly carried out by the joint research program of the Institute for Space-Earth Environmental Research, Nagoya University.


 Open access