


INTRODUCTION
Precious coral is a valuable fishing resource in Japan, Taiwan, Hawaii, and the Mediterranean countries. Owing to the dense, hard, and beautiful colors of their calcium carbonate skeleton, they have been used for jewelry, art objects, and variable artifacts since ancient times. The decline in yield and some scientific information on the vulnerability of precious coral populations have raised international concern about the sustainability of coral harvest in recent years, and proposals were submitted for listing in Appendix II of the Convention on the Trade in Endangered Species (CITES) in 2007 and 2009 as summarized in Bruckner (Reference Bruckner2014).
In Japan, fishing activities of precious corals began in the Kochi Prefecture in 1871 (Ogi Reference Ogi and Iwasaki2008; Shozakai Reference Shozakai2013), which is the largest field of precious coral fishing in Japan today. To ensure sustainable fishing of precious corals, both the national and prefectural fisheries law and local fishery’s cooperative regulations control the fishing season, time, method, area, weight, conditions (dead or alive), and size for precious corals in Japan. However, the reasonability and effectiveness of the regulations are uncertain because precious coral biology in Japan remains poorly understood when compared to the well-studied Mediterranean precious coral, Corallium rubrum. The colony fecundity, recruitment rate, mortality, growth rate, population structure, and density were surveyed and utilized for management to ensure sustainable harvesting (Cannas et al. Reference Cannas, Follesa, Cau, Cau and Friedman2019, references therein). From Japan, recently reported morphometric and population observations, using ROVs in a non-harvested area (Iwasaki et al. Reference Iwasaki, Fujita, Bavestrello and Cattaneo-Vietti2012), phylogenetic investigations (Uda et al. 2011; Reference Uda, Komeda, Fujita, Iwasaki, Bavestrello, Giovine, Cattaneo-Vietti and Suzuki2013), physiological investigation (Sekida et al. Reference Sekida, Iwasaki and Okuda2016), geochemical analysis (Suzuki et al. Reference Suzuki, Inoue, Yokoyama and Iwasaki2008; Hasegawa et al. Reference Hasegawa, Rahman, Nguyen, Maki and Iwasaki2012; Nguyen et al. Reference Nguyen, Rahman, Maki, Tamenori, Yoshimura, Suzuki and Hasegawa2014; Yoshimura et al. Reference Yoshimura, Suzuki and Iwasaki2015), and growth rate estimation (Iwasaki and Suzuki Reference Iwasaki, Suzuki and Iwasaki2008; Nguyen et al. Reference Nguyen, Rahman, Maki, Iwasaki and Hasegawa2013), have focused only on living precious coral colonies.
In addition to living precious corals, dead precious coral fragments are also harvested and traded at high prices, although most are perforated like bio-erosion and/or are associated with secondary calcification by chemical precipitation and/or sessile organisms, i.e., shells and tubes (Figure 1A). In contrast, a living coral fragment is covered by a whitish, smooth, thin skin, and is easy to distinguish from a dead coral fragment even after harvesting and during trading (Figure 1B). Trading volumes of dead precious corals are larger than those of the living ones every year, accounting for 63–95% of the total trading amount in weight in Japanese markets in the past 30 years (Figure 2). As dead corals have been collected abundantly since the 1900s, when commercial fishing in Japan was still new (Shozakai Reference Shozakai2013), they seem to have an aspect of a fossil resource rather than living fishery resources. Despite their importance, the ages, depositional processes, and preservation assessments have been secondary research subjects thus far owing to the significant lack of useful information on both living and dead precious coral. In this research, we focused on dead precious coral colony fragments, collected from off the southwest coast of Kochi Prefecture, southwest Japan, to examine when they lived as a first step toward understanding their accumulation processes.

Figure 1 Corallium japonicum fragments measured in this study (sample ID: A1 and A3L). (A) A fragment of C. japonicum (A1) that was dead and fossilized when caught. The surface of the fragment was covered by sessile organism carbonates, secondary calcification (outer whitish part), and boring holes (black arrows). The subsample for measurement was chosen from the outermost 2–3 mm layer without boring holes and thick outer precipitation (white arrow). (B) A fragment of C. japonicum (A3L) that was living when it was caught. The surface is covered by a whitish, smooth, thin skin (black dashed arrow).
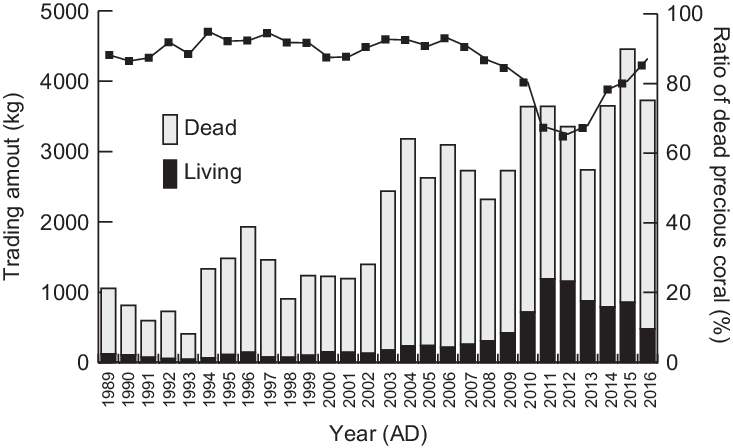
Figure 2 Trading amount in public auctions of precious corals in Japan from 1989 to 2016. Data sets from 1989 to 2011 were from Shozakai (Reference Shozakai2013) and those from 2012 to 2016 were provided by the Development Association and Japan Coral Association. Note that the amounts are not harvesting amounts and include precious corals collected before the harvesting period. Additionally, they are not only from Kochi Prefecture but also from the other fishing fields such as the Ogasawara area, off Wakayama Prefecture, and Nagasaki Prefecture. Dead precious coral fragments account for 63–95% of the whole trading amount in these years.
MATERIALS AND METHODS
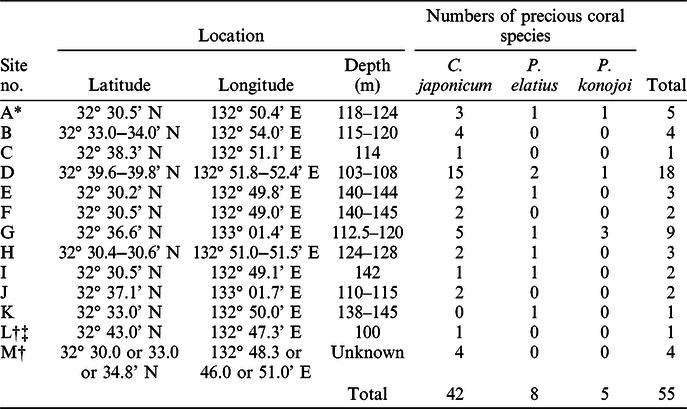
To determine the age of the precious coral colony fragments, radiocarbon (14C) dating was applied to 55 coral fragments collected from 13 sites within the Ashizuri fishing field (site A~M), located off the southwestern coast of Kochi Prefecture (Figure 3). Historically, this fishing field has produced high yields in Japan (Ogi Reference Ogi and Iwasaki2008) and is located on a continental shelf off Ashizuri Cape, with depths ranging from 100 to 200 m (120 m on average; Ikehara Reference Ikehara1988, Reference Ikehara1999). The surface sediments are mostly composed of gravels and cobbles with sands, which are likely lag deposits during the low sea-level periods of the last glacial ages (Ikehara Reference Ikehara1988, Reference Ikehara1999). In total, 51 samples were collected during the fishing season in 2017 and 2018 and 4 samples were caught in a period of days before 2017 and stored as the stock of a fisher. The samples were collected by voluntary fishers using the traditional fishing method—namely, dredging with a broom-like trawling net pulled only by the current. This method non-selectively catches precious corals from the seafloor, irrespective of the size, species, and whether they are living or dead. We collected various samples from a variety of locations, water depths, and coral species. We dated 1 fragment of living C. japonicum (sample ID: A3L), and 54 fragments of dead corals; 42 of C. japonicum, 8 of P. elatius, and 5 of P. konojoi. Sampling locations, sample number, and coral species are summarized in Table 1.
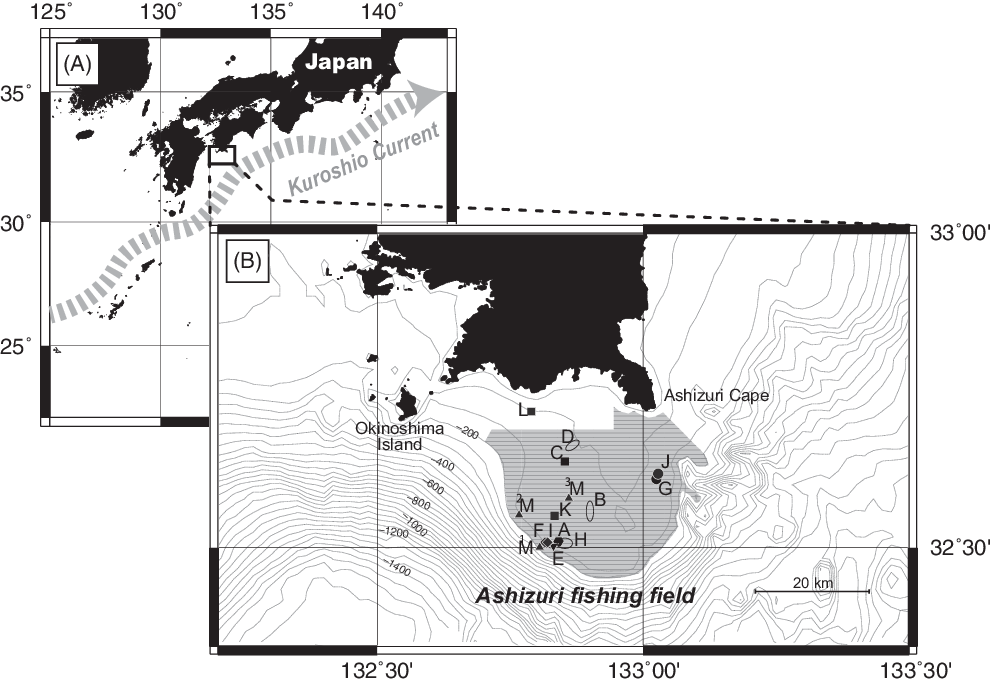
Figure 3 Location of the Ashizuri fishing field in southwest Japan and sampling points of the precious coral fragments measured in this study. (A) The study area is located along the Kuroshio Current. (B) 13 sampling sites (A–M) in the Ashizuri fishing field (gray area).
Table 1 Information on sampling sites and precious coral species of the specimens.

* Including one living precious coral fragment.
‡ This sampling site was permissible area before.
† Sampling dates were someday before 2017 (no record).
In order to identify the age of each coral fragment, the outermost layer of 2–3 mm thickness was cut off by a diamond saw from the upper side of the skeletal growth axis once its top and bottom segments were confirmed from its branching morphology (Figures 1A and 1B). For samples whose top and bottom segments cannot be confirmed, the samples for measurement were cut from the outermost layer with a relatively clean surface. The sessile organism’s carbonates and secondary calcification (as shown in Figure 1A) were carefully scraped off from the outer surface of the cut subsamples, and holes were bored by micro drills to avoid contamination. Subsequently, the trimmed samples were washed with an ultrasonic bath in pure water, etched with 1M HCl for 20 s, washed again with pure water in an ultrasonic bath, and dried at room temperature. Eight specimens were subdivided into a few subsamples (Sample ID: A1a-b, A2a-b, A4a-b-c, A5a-b-c, B3a-b, D16a-b, J2a-b, and L1a-b) to examine the age variability within a specimen. For A5a-b and B3a-b, the replicated samples were taken from the vertically distant position along the coral skeletal growth axis because these samples were relatively long (~15 cm). Conversely, the replicated subsamples (A1a-b, A2a-b, A4a-b, J2a-b, and L1a-b) were collected from the adjoining position along the cross-section of the coral skeletal axis because the samples have a relatively thick diameter (>1 cm) and clear surface (little secondary calcification and/or sessile organisms). Subsamples, A4c-d, A5c, and D16a, were collected from the inner position compared with other subsamples in the same specimens.
The prepared samples were measured using an accelerator mass spectrometry (AMS) system at Yamagata University (YU-AMS: National Electric Company, 1.5SDH; Kato et al. Reference Kato, Tokanai, Anshita, Sakurai and Ohashi2014; Tokanai et al. Reference Tokanai, Morita, Takahaya, Sakurai, Umebayashi, Miyahara, Ohyama, Aaitoh and Okada2020) and the Institute of Accelerator Analysis Ltd. (IAA: 3MV Tandem Accelerator system, NEC Pellerton, 9SDH-2; Miyaoka et al. Reference Miyaoka, Isono, Setani, Sakai, Yamada, Sato, Gunji and Matsui2007), Japan. Skeletal carbon was liberated from the samples as CO2 that was generated by dissolution in phosphoric acid in a vacuum line. The derived CO2 was recovered and deoxidized with iron powder, and graphite was obtained. The carbon in the prepared graphite was ionized, and the ionized carbon was accelerated and measured via AMS. The 14C atoms were detected using a solid-state detector with a semiconductor absorber, while the 13C and 12C atoms were detected in Multi-Faraday cups in the AMS systems. NIST oxalic acid (HOxII) was used as the standard reference material. δ13C, F14C (fraction modern; Reimer et al. Reference Reimer, Brown and Reimer2004), and Δ14C (Stuiver and Polach Reference Stuiver and Polach1977) were calculated for comparison with previous studies.
The AMS 14C ages were corrected for isotopic fractionation and calibrated to calendar years (cal BC/AD) using the OxCal 4.2 program (Ramsey Reference Ramsey2009) with the Marine13 calibration curve (Reimer et al. Reference Reimer, Bard and Bayliss2013). For specimens showing a modern age (after 1950) after calibration by the OxCal 4.2 program, the ages were calibrated by the post-bomb calibration program, CALIBomb (Reimer et al. Reference Reimer, Brown and Reimer2004; available at http://calib.org/CALIBomb/) with the Kure Atoll dataset (Andrews et al. Reference Andrews, Siciliano, Potts, DeMartini and Covarrubias2016). Presently, information about the local marine reservoir correction value (ΔR) is unavailable for the study area. As discussed later, since ΔR in the adjacent area along the Kuroshio Current varies on the order of ±175 years (Konishi et al. Reference Konishi, Tanaka, Sakanoue and Gomez1981; Hideshima et al. Reference Hideshima, Matsumoto, Abe and Kitagawa2001; Yoneda et al. Reference Yoneda, Uno, Shibata, Suzuki, Kumamoto, Yoshida, Sasaki, Suzuki and Kawahata2007; Araoka et al. Reference Araoka, Unoue, Suzuki, Yokoyama, Eswards, Cheng, Matsuzaki, Kan, Shikazono and Kawahata2010; Hirabayashi et al. Reference Hirabayashi, Yokoyama, Suzuki, Miyairi and Aze2017), we tentatively use uncorrected values (ΔR=0) for this study.
RESULTS
The size, δ13C, F14C, Δ14C, and conventional and calibrated (cal) 14C ages of the 55 specimens are summarized in Table 2. The diameters of the specimens range from 3.6 mm to 17.3 mm and length of the specimens range from 30 mm to 240 mm. By using the reported growth rates, given by 0.24 ± 0.04 mm/year for C. japonicum, 0.30 ± 0.04 mm/year for P. elatius, and 0.44 ± 0.04 mm/year for P. konojoi (Nguyen et al. Reference Nguyen, Rahman, Maki, Iwasaki and Hasegawa2013), lifespans of the specimens were estimated to range from 15 to 70 years (Table 2).
Table 2 The results of the radiocarbon dating for 55 precious coral colony specimens collected from the Ashizuri fishing field. For eight specimens, A1a-b, A2a-b, A4a-b-c-d, A5a-b-c, B3a-b, D16a-b, J2a-b, and L1a-b, replicated measurements were applied to understand the age variation within a specimen. One specimen (A3L) was alive when it was caught, and the others were dead.
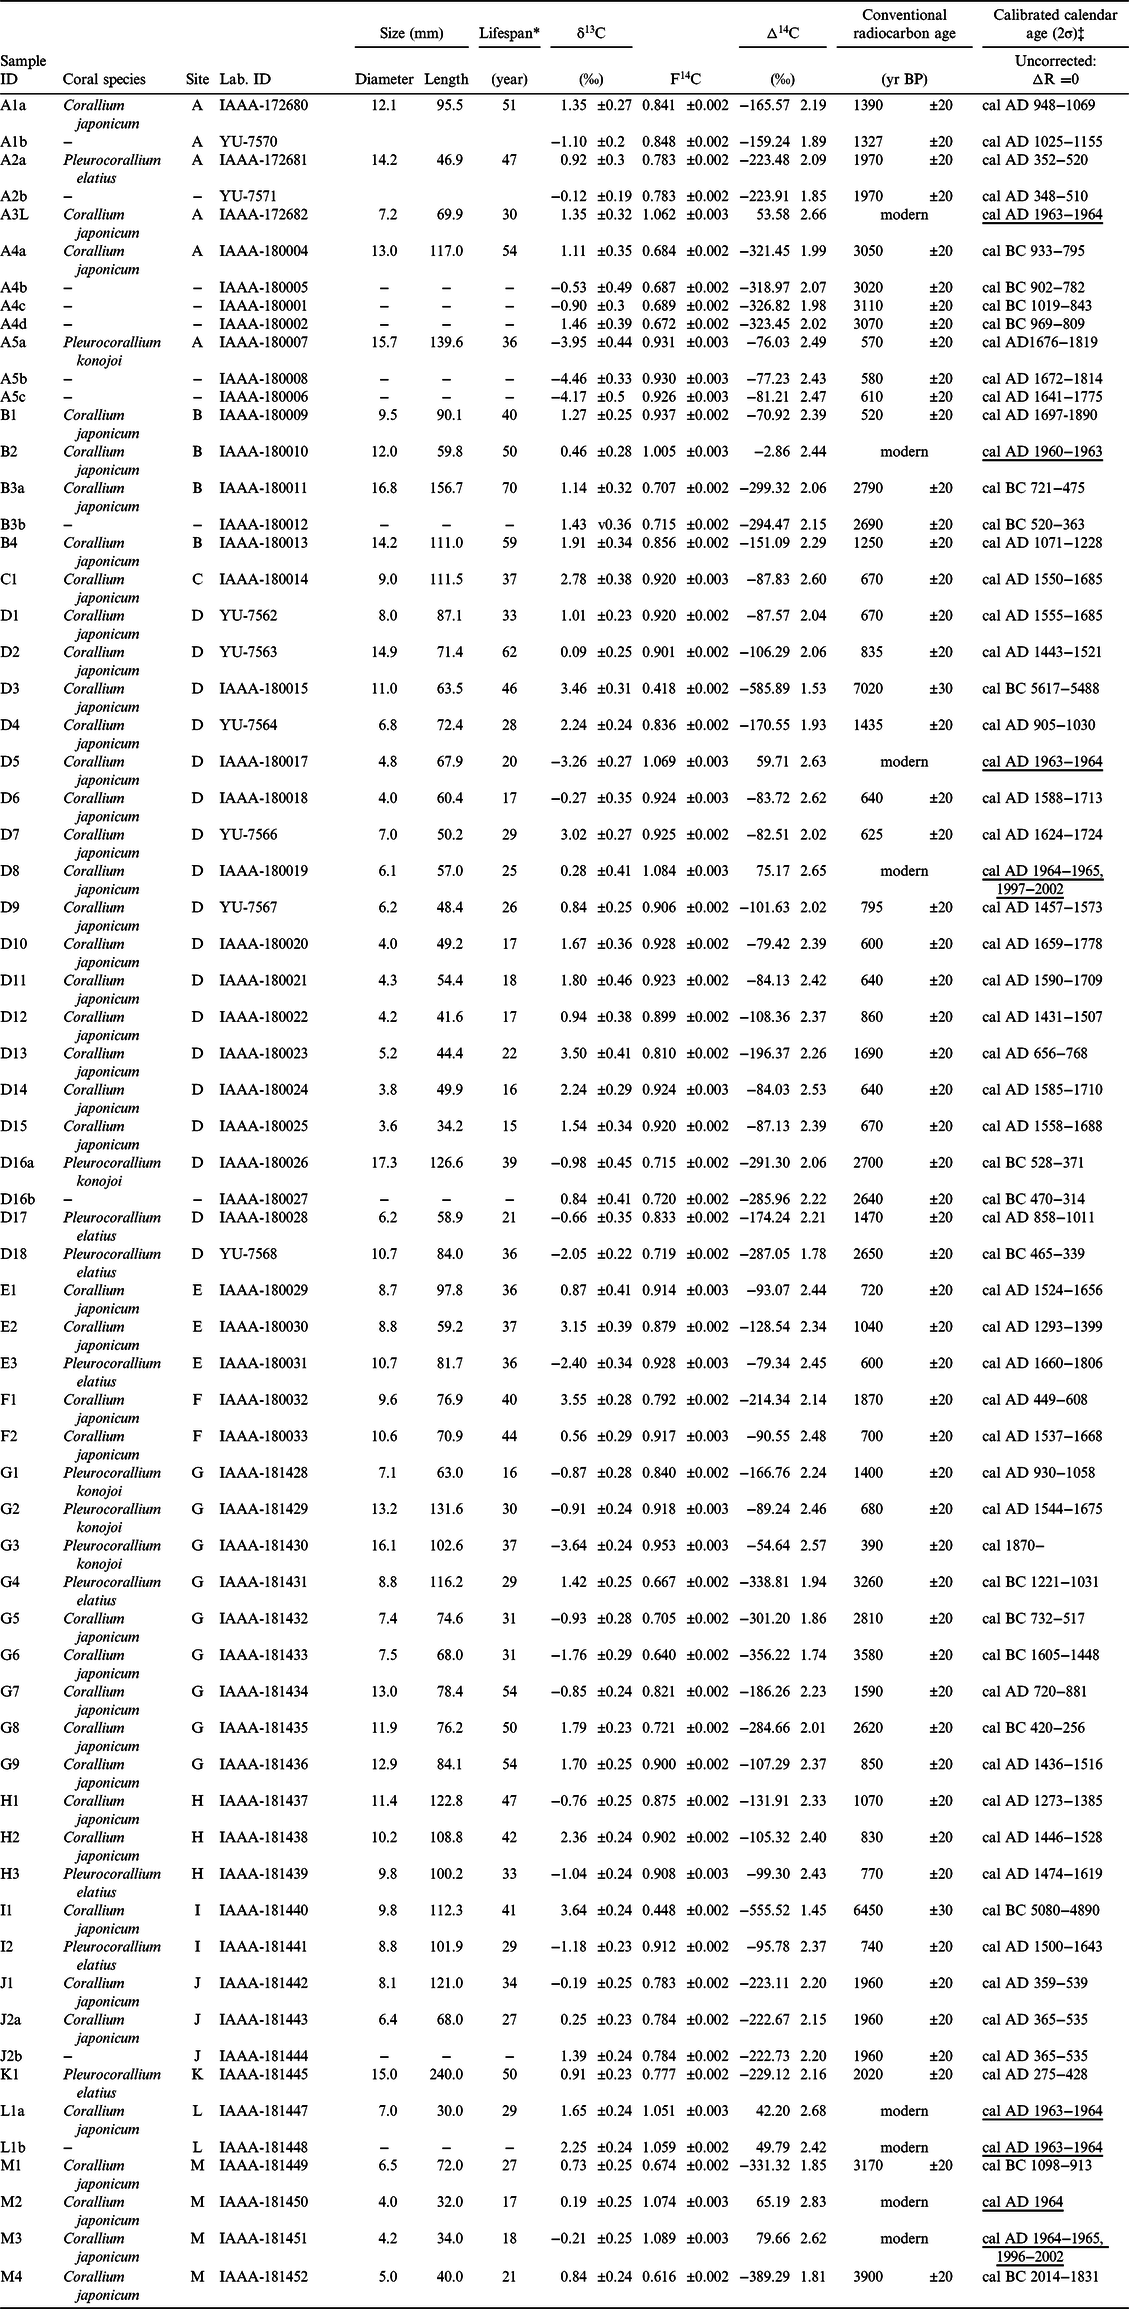
* The lifespan was calculated by using the diameter of specimen and proposed growth rate by Nguyen et al. (2013). Details in the text.
‡ The underlined ages were calibrated with CALIBomb program.
The δ13C values of the subsamples range from –4.5 to 3.6‰, falling within the range of calcareous organisms, given by –9 to 5‰ (Swart Reference Swart1983). The δ13C values of our sample exhibit a wider range than that reported in previous research; –3.63‰ for P. konojoi, 0.00‰ for C. japonicum (Yoshimura et al. Reference Yoshimura, Suzuki and Iwasaki2015) and approximately –2 to –5‰ for P. konojoi (Suzuki et al. Reference Suzuki, Inoue, Yokoyama and Iwasaki2008). No correlation was observed between the δ13C values and age, sampling sites, and water depth. Relatively higher values, over 1.47‰, are only from C. japonicum, while relatively lower values, ranging from –4.46 to –3.64‰, are only from P. konojoi. The F14C values of the measured samples range from 0.48 to 1.89 and the Δ14C values range from –585.89 to 79.66‰.
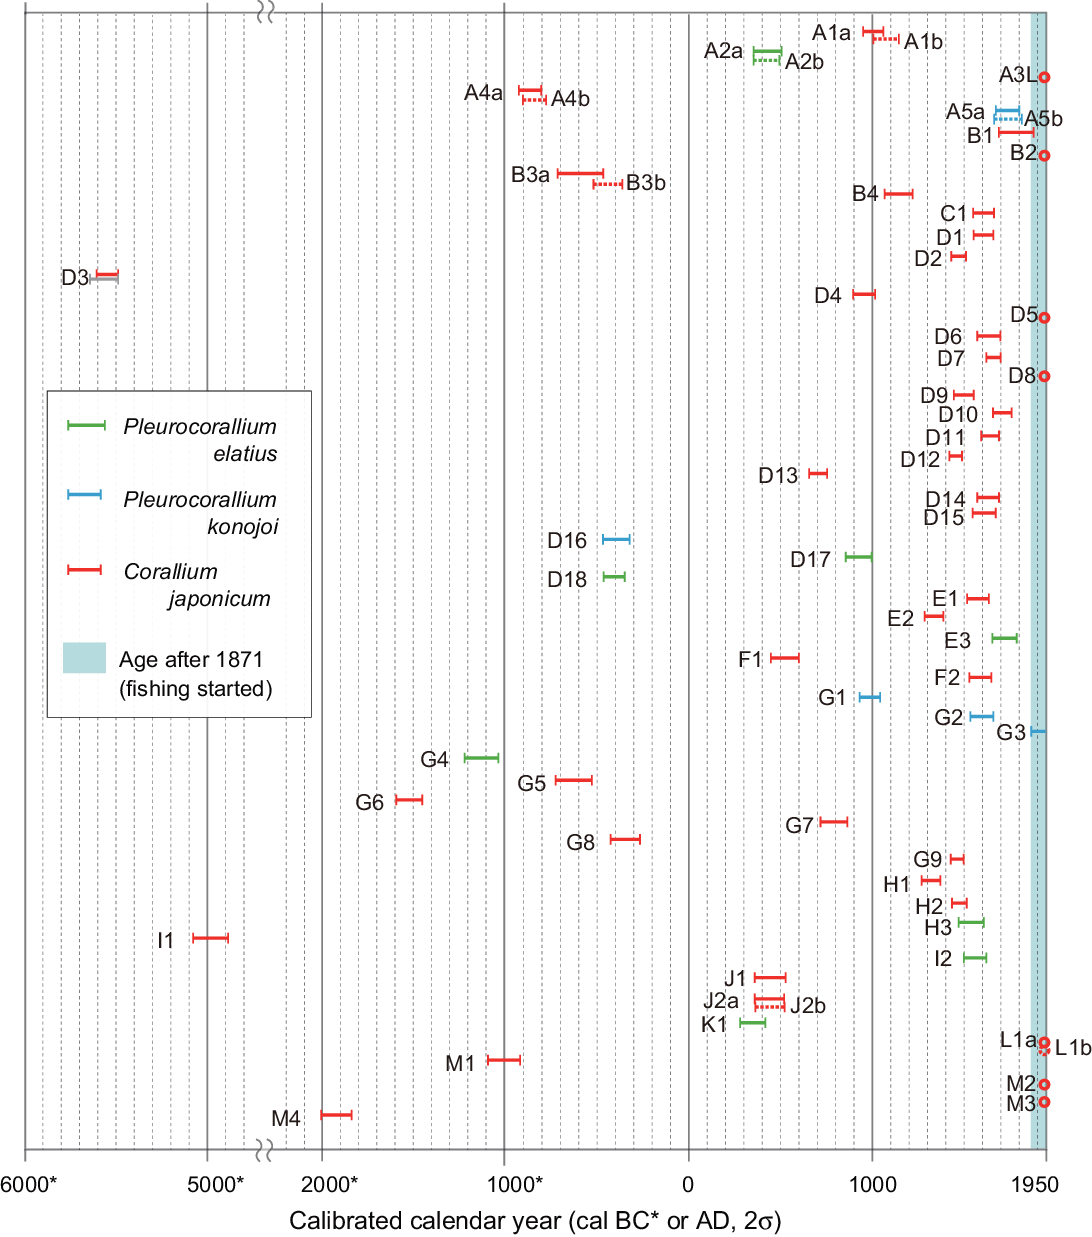
The cal calendar 14C age ranges (2σ) of the outer layer of each sample overlap, as shown in Figure 4. One living sample (A3L) and seven dead specimens (B2, D5, D8, L1 (a and b), G3, M2, and M3) correspond to the modern age, after 1950. The dates of the modern samples are estimated to be approximately cal AD 1960–1964 and 2002 by calculation using the CALIBomb program (Table 2). The oldest calibrated calendar 14C age within the measured samples was cal BC 5617–5411 for Sample D3. The ages of the measured samples are broadly distributed over the past ~7500 years, as presented in Figure 4. No correlation was observed between the cal 14C ages and the sampling sites, water depth, and coral species.

Figure 4 Age distribution of the calibrated calendar years (error bar = 2σ) of the precious coral specimens collected from the Ashizuri fishing field without the local reservoir effect correction (ΔR=0; detail in the text). Each color of the bar corresponds to the coral species as shown in the legend. The dashed bars denote the calibrated calendar years of the replicated measurement samples. The light-blue area in the figure denotes the year range when fishing activities started (since 1871) in the study area.
Age variation of the replicated subsamples and their sampling positions are summarized in Figure 5. The difference in the median value of the 2σ cal calendar year for the outer layer subsamples range from 0 to 157. Since the errors of the conventional radiocarbon age were ±20 years, it can be considered that the replicated subsamples in A2a-b, A4a-b, A5a-b, J2a-b, and L1a-b showed identical ages. Larger age gaps between A1a and A1b (difference in their median values is 82 years) and between B3a and B3b (difference in their median values is 157 years) were from the sample with non-concentric growth (A1) and vertically distant sampling positions of a relatively long specimen (B3), respectively (Figure 5). Age gaps between the outer and inner subsamples for A4a-b-c-d, A5a-b, and D16a-b can be used for growth rate estimation. Using the age gap and the information on the sampling positions, the growth rates were calculated as 0.21 mm/year for A4 (C. japonicum), 0.42 mm/year for A5 (P. konojoi), and 0.30 mm/year for D16 (P. konojoi). These growth rates were similar order to those of the previous reports; 0.24 mm/year (Nguyen et al. Reference Nguyen, Rahman, Maki, Iwasaki and Hasegawa2013) and 0.30–0.34 mm/year (Iwasaki and Suzuki Reference Iwasaki, Suzuki and Iwasaki2008) for C. japonicum, and 0.44 mm/year (Nguyen et al. Reference Nguyen, Rahman, Maki, Iwasaki and Hasegawa2013) for P. konojoi.
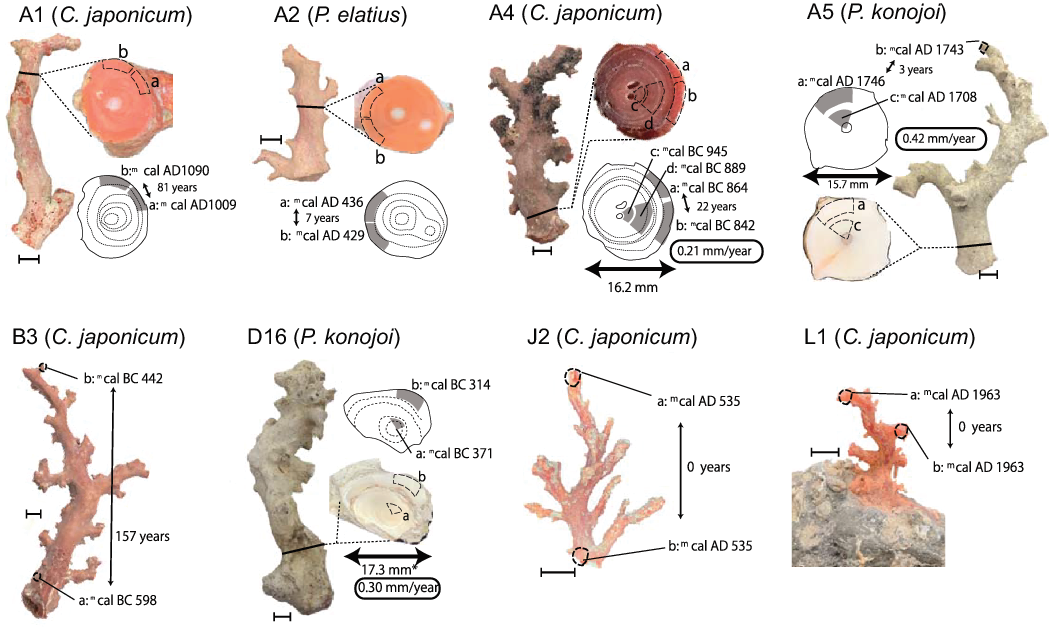
Figure 5 The 14C age variation within a specimen. Replicated subsampling has been done for eight specimens, A1 (a-b), A2 (a-b), A4 (a-b-c-d), A5 (a-b-c), B3 (a-b), D16 (a-b), J2 (a-b), and L1 (a-b). Sampling points and each median value of the calibrated calendar age (mcal) are listed. The scale bar (1 cm) near each specimen, represented by the double-headed arrows, and the adjacent years, illustrates the age variation of the replicated samples collected from the outer layer. The boxed values near A4, A5, and D16 are the growth rates, calculated using the dating results and the diameters.
DISCUSSION
Previous knowledge of the ecological and sociological background of the precious coral at the study site traces back to only century-old history, as shown below. The earliest record of precious coral collection exists in a local historical document dated ~200 years ago, which describes that a precious coral (species unknown) was accidentally caught during bonito fishing in the western Kochi Prefecture in 1812 (Shozakai Reference Shozakai2013). Although such accidental catching was often reported before the beginning of the Meiji period (1868~), targeted fishing for precious corals had not yet begun in earnest because of regulation by the government (Ogi Reference Ogi and Iwasaki2008; Shozakai Reference Shozakai2013). This changed after the execution of the national laws of fishery regulation in 1871 (Ogi Reference Ogi and Iwasaki2008; Shozakai Reference Shozakai2013). As summarized in Figure 6, the harvesting amounts in Kochi Prefecture increased and reached a maximum in the 1900s as a result of high demand from active trade with Europe. A decrease in precious coral fishing occurred due to social and economic changes stemming from the Russo-Japanese War (Shozakai Reference Shozakai2013). It reactivated around the middle of the 1950s after World War II; however, the main fishing fields had spread to areas to foreign areas such as Taiwan, Hong Kong, and Midway Islands (Shozakai Reference Shozakai2013). From 1973, fishery activities in Kochi Prefecture began to be regulated by prefectural rules that had been revised to reflect the local situation.
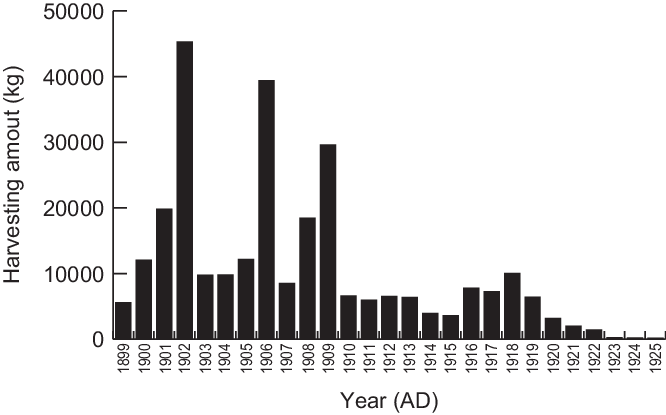
Figure 6 Harvesting amount of the precious corals caught in Kochi Prefecture, Japan. Data were from the Kochi Prefecture Statistics Report (https://www.pref.kochi.lg.jp/soshiki/111901/toukeisho.html). No data documented whether the precious coral was dead or alive.
Although available information is limited, it can be considered that peak harvesting in the study area occurred in the 1900s, as summarized in Figure 6. In addition, it is suggested that the percentage of the living precious coral colony harvested around 1910 was ~20% (Ogi Reference Ogi and Iwasaki2008). Until today, precious corals in the study area have been caught by dredging using a traditional tangle net pulled by the surface current. This potentially inflicts greater damage on the local ecosystem than selective catching methods such as scuba diving and the use of manned submersibles and remotely operated vehicles (ROVs) (Bruckner Reference Bruckner2014; Cannas et al. Reference Cannas, Follesa, Cau, Cau and Friedman2019). From these points of view, it can be thought that the dead precious coral fragments are the remains that were broken during dredging. If this is the case, we can expect that most of the dead coral fragments will have an age of approximately 1900s and would have lived during a period of high fishing activity. However, many samples measured in this study are considerably old; 84 percent of the samples are older than 1871, with the oldest being dated to cal BC 5617–5411 (D3, Table 2, and Figure 4). Eight dead specimens showing the dates after 1871 (B1, B2, D5, D8, G3, L1, M2, and M3) died someday between after 1950 and the collection date in 2017 and 2018 potentially by destruction of the dredging fishery.
These old ages seem not to be caused by dead carbon incorporation during coral skeleton formation. It can be considered that the major carbon source of the coral skeleton was the ambient dissolved inorganic carbon because the δ13C (1.35 ± 0.32‰) and Δ14C (53.58 ± 2.66‰) values of the living specimen (A3L) are similar to those of the dissolved inorganic carbon (DIC) reported from near the study site (station 3; 32.413N and 133.29E, 2004 survey, in GLODAPv2.2020; Olsen et al. Reference Olsen, Lange and Key2020; Key et al. Reference Key, Olsen and van Heuven2015), that is, 0.44–1.18‰ of δ13C and 44.3–73.6‰ of Δ14C at the surface to a depth of 200 m. The Δ14C (53.58 ± 2.66‰) values of the living specimen (A3L) is lower than the other hermatypic corals record at Kikai Islands (Morimoto et al. Reference Morimoto, Kitagawa, Shibata and Kayanne2004) and Kure Atoll (Andrews et al. Reference Andrews, Siciliano, Potts, DeMartini and Covarrubias2016), which are around ~90‰ around 2000. This likely reflects lower Δ14C value of DIC at the deeper habitat of precious corals, by 200 m depth (Olsen et al. Reference Olsen, Lange and Key2020; Key et al. Reference Key, Olsen and van Heuven2015). Additionally, possible contamination was avoided by careful subsampling to remove outer precipitation and boring holes. One uncertainty for the cal 14C dates is the local marine reservoir effect. As described earlier (the Materials and Methods section), there are no reports on ΔR values in the study area so far, and ΔR in the adjacent area along the Kuroshio Current varies on the order of ±175 years (Konishi et al. Reference Konishi, Tanaka, Sakanoue and Gomez1981; Hideshima et al. Reference Hideshima, Matsumoto, Abe and Kitagawa2001; Yoneda et al. Reference Yoneda, Uno, Shibata, Suzuki, Kumamoto, Yoshida, Sasaki, Suzuki and Kawahata2007; Araoka et al. Reference Araoka, Unoue, Suzuki, Yokoyama, Eswards, Cheng, Matsuzaki, Kan, Shikazono and Kawahata2010; Hirabayashi et al. Reference Hirabayashi, Yokoyama, Suzuki, Miyairi and Aze2017). One study investigated the systematic changes in ΔR values along the Kuroshio Current (Yoneda et al. Reference Yoneda, Uno, Shibata, Suzuki, Kumamoto, Yoshida, Sasaki, Suzuki and Kawahata2007), which can be used for estimating possible ΔR values in the study area. Yoneda et al. (Reference Yoneda, Uno, Shibata, Suzuki, Kumamoto, Yoshida, Sasaki, Suzuki and Kawahata2007) used pre-bomb molluscan shells to show that the average ΔR values were 70‰ around Taiwan and Ishigaki Island, 29‰ around the Okinawa and Amami area, and –22‰ around Ogasawara. The Ashizuri fishing field, investigated in this study, is located midway between the Okinawa-Amami region and Ogasawara, and along the Kuroshio Current path irrespective of the outbreak of its meander (Yoshida et al. Reference Yoshida, Maeta, Nakano, Deguchi and Nemoto2014). Therefore, it is reasonable to assume that ΔR is 0 at the Ashizuri fishing field. In addition, subsamples having a thickness of 2–3 mm can be estimated as having no more than ~10 years of growth by using the growth rate in Figure 5 and a previous report by Nguyen et al. (Reference Nguyen, Rahman, Maki, Iwasaki and Hasegawa2013), which is short enough to ignore when considering several decades (~50 years). ΔR variations in the Kuroshio region likely related to the North Pacific gyre circulation (Kuroshio and North Pacific Equatorial Currents) (Hideshima et al. Reference Hideshima, Matsumoto, Abe and Kitagawa2001), El Nino–Southern Oscillation (ENSO), and Pacific Decadal Oscillation (PDO) (Hirabayashi et al. Reference Hirabayashi, Yokoyama, Suzuki, Miyairi and Aze2017). In conclusion, we believe that the dates measured for dead corals in the Ashizuri fishing field roughly show their living ages.
The time distribution of the cal 14C ages of the 55 measured specimens (Figure 4) suggests a possible process of natural accumulation of dead precious corals. Each age potentially has an uncertainty of <160 years at maximum, as shown in two replicated subsamples (A1a-b and B3a-b; Figure 5). The relatively large gap appearing in the specimens with non-concentric growth or complex colony branching shapes (Figure 5) seems to be reflected age heterogeneity within the outer layers of a specimen. Even after considering such a heterogeneity up to ~160 years as described above, the cal 14C ages would not concentrate after 1871 and 1900. The death of most of the precious coral fragments showing an age before 1871 might have resulted from natural circumstances such as natural mortality, predation, and destruction due to environmental factors such as storms, strong currents, and movement of basement gravels.
The relation between the specimen size and age provides an insight into the precious coral lifespan. The estimated lifespan of the 55 specimens ranges from 15 to 70 years (Table 2); the average lifespan is 35 years. There was no significant difference in the lifespan between the 47 specimens that lived before 1871 and the eight specimens that lived after 1871 (t-test, p>0.1). This indicates that fragmentation of the precious coral colonies could occur every several decades regardless of whether dredging is performed or not.
Based on the dates measured in this study, precious corals have inhabited the Ashizuri fishing field from at least ~7500 years ago. The Ashizuri fishing field, which is 100 to 200 m deep (120 m on average), is situated on a continental shelf submerged by sea-level rise after the last deglaciation about 12,000 years ago, judging from the Marine Oxygen Isotope Curve LR04 (Lisiecki and Raymo Reference Lisiecki and Raymo2005). A previous study on sediment cores collected from the continental slope located to the south of our study area suggests that the marine environment became similar to that of the present at least 8000 years ago (Ohba and Yasuda Reference Ohba and Yasuda1992). The oldest age of the measured samples is consistent with the environmental background, and precious corals started inhabiting the study area soon after the marine conditions became identical to those of the present after the last glacial period.
The area of the Ashizuri fishing field is ~1000 km2, and the sea floor is mostly covered by gravels and sands (Ikehara Reference Ikehara1988, Reference Ikehara1999). As modern fine-grained sediments such as mud and fine-grained sand was removed by strong currents related to the Kuroshio Current (Ikehara Reference Ikehara1988, Reference Ikehara1999), there are non-depositional areas in the Ashizuri fishing field. Such an environment with a low supply of silt/mud particles, is an appropriate habitat for filter-feeding animals such as precious corals. Additionally, the gravels offer a basal matrix for precious coral growth, as precious corals are sometimes caught with attached gravels. Furthermore, the chemical conditions might favor the preservation of the coral carbonate skeleton for a long time. As mentioned earlier, dead coral fragments are often covered by white carbonate precipitation (Figure 1A). Fishers often dredge carbonate conglomerates composed of shell fragments and worm tubes cemented by carbonates. These are formed as a result of the supersaturation of calcium carbonate in the study area that is located above the local lysocline (Feely et al. Reference Feely, Sabine, Lee, Berelson, Kleypas, Fabry and Millero2004). These environmental conditions likely contribute to the long-term accumulation of dead precious corals on the continental shelf floor and create good precious coral fishing grounds in the study area.
This study is the first to conduct systematic 14C dating focusing on dead precious coral fragments collected from one of the major fishing fields in Japan and has revealed that most of the dead precious corals might be natural accumulations as fossil resources. The stock of dead corals may be somewhat larger than that of living ones and can lengthen the timespan of precious coral fishery. Until today, dead precious corals have not been a focus in both scientific research and resource management (for example, the current Kochi prefectural law does not restrict the harvesting amount of dead precious corals); however, the dead precious corals will begin to disappear without appropriate resource management. For sustainable fisheries collecting precious corals, we must distinguish dead precious corals from living ones and manage it as a fossil resource by introducing new guidelines for dead coral harvesting. To make this possible, higher-resolution dating and investigations into the local marine reservoir effect should take precedence in future research so that a more detailed reconstruction of precious coral habitat history can be obtained. In addition, to build upon the current study, systematic dating needs to be performed again to assess the biases of collection time, species, and location. Furthermore, scientific research on the living precious colony fecundity, recruitment rate, mortality, growth rate, population structure, and density need to be conducted in the study area. Collection of reliable fishery data that discriminates the status (living/dead), species, and fishing field through history is also essential, as available data are limited at this time. Data collection will allow for resource amounts to be determined by calculation and reasonable and effective fishery regulations to be established. We hope that our results will motivate reconsideration into the management of precious coral resources in Japan and will promote further scientific investigation.
CONCLUSION
We conducted 14C dating for 55 precious coral specimens collected from the Ashizuri fishing field off the southwest coast of Kochi Prefecture, Japan, to understand the historical background of one of the largest precious coral fishing fields in Japan. The oldest cal 14C ages within the measured samples were ~7500 years ago. Most of the specimens collected in this study predated both the beginning of coral fishing activities in 1871 and the peak of fishing activities in the 1900s and covered several thousand years of coral bed growth and recruitment. Our results suggest that most of the precious coral colonies died due to natural causes, and not by destructive fishing activities. This study is the first to focus on the age of dead precious coral fragments and has revealed that dead corals are a type of fossil resource that must be appropriately managed for sustainable use.
ACKNOWLEDGMENTS
The authors would like to thank Mr. Yoshihiko Niiya, Mr. Keishiro Yasuoka, and Mr. Satoshi Taniwaki for sample provision, Mr. Noriyoshi Yoshimoto, Mr. Hideo Kiuchi, Mr. Ryuji Kondo, Ms. Harumi Isshiki, and Ms. Reika Kawamura for coordinating the sample provision and information on precious coral fishing in the study area. We would also like to thank Editage (www.editage.com) for English language editing. The authors wish to thank Dr. Allen H. Andrews and an anonymous reviewer for constructive comments on an earlier version of this paper. Water depth data in Figure 3 were obtained from the Japan Oceanographic Data Center. This study was funded by a donation from the Non-Government Organization of the Precious Coral Protection and Development Association and Japan Coral Association, and an internal grant for the Woman Successor Tenure Track at Kochi University.


 Open access