


INTRODUCTION
Means of recovering and analyzing ecologically informative environmental DNA (eDNA) have improved substantially thanks to ongoing developments in high-throughput sequencing (HTS) technologies (Taberlet et al., Reference Taberlet, Bonin, Zinger and Coissac2018). Sedimentary ancient DNA molecules (sedaDNA, referring to a subset of ancient eDNA sample types; see Rawlence et al. [Reference Rawlence, Lowe, Wood, Young, Churchman, Huang and Cooper2014, p. 614]) have been successfully recovered from a diverse range of depositional settings to evaluate what is thought to be the local (Parducci et al., Reference Parducci, Bennett, Ficetola, Alsos, Suyama, Wood and Pedersen2017, p. 930; Edwards et al., Reference Edwards, Alsos, Yoccoz, Coissac, Goslar, Gielly and Haile2018) diachronic presence of animals (Haile et al., Reference Haile, Froese, MacPhee, Roberts, Arnold, Reyes and Rasmussen2009; Giguet-Covex et al., Reference Giguet-Covex, Pansu, Arnaud, Rey, Griggo, Gielly and Domaizon2014; Graham et al., Reference Graham, Belmecheri, Choy, Culleton, Davies, Froese and Heintzman2016; Pedersen et al., Reference Pedersen, Ruter, Schweger, Friebe, Staff, Kjeldsen and Mendoza2016; Slon et al., Reference Slon, Hopfe, Weiß, Mafessoni, de sa Rasilla, Lalueza-Fox and Rosas2017), plants (Anderson-Carpenter et al., Reference Anderson-Carpenter, McLachlan, Jackson, Kuch, Lumibao and Poinar2011; Willerslev et al., Reference Willerslev, Davison, Moora, Zobel, Coissac, Edwards and Lorenzen2014; Epp et al., Reference Epp, Gussarova, Boessenkool, Olsen, Haile, Schrøder-Nielsen and Ludikova2015; Alsos et al., Reference Alsos, Sjögren, Edwards, Landvik, Gielly, Forwick and Coissac2016; Niemeyer et al., Reference Niemeyer, Epp, Stoof-Leichsenring, Pestryakova and Herzschuh2017), fungi (Bellemain et al., Reference Bellemain, Davey, Kauserud, Epp, Boessenkool, Coissac and Geml2013), microbiota (D'Costa et al., Reference D'Costa, King, Kalan, Morar, Sung, Schwarz and Froese2011; Ahmed et al., Reference Ahmed, Parducci, Unneberg, Ågren, Schenk, Rattray and Han2018), and eukaryotic parasites (Søe et al., Reference Søe, Nejsum, Seersholm, Fredensborg, Habraken, Haase and Hald2018). It is thought that much of sedaDNA survives in the absence of tissues through the formation of organo-mineral complexes (Greaves and Wilson, Reference Greaves and Wilson1970; Lorenz and Wackernagel, Reference Lorenz and Wackernagel1987a; Reference Lorenz and Wackernagel1987b; Ogram et al., Reference Ogram, Sayler, Gustin and Lewis1988; Blum et al., Reference Blum, Lorenz and Wackernagel1997; Arnold et al., Reference Arnold, Roberts, Macphee, Haile, Brock, Möller and Froese2011; Morrissey et al., Reference Morrissey, McHugh, Preteska, Hayer, Dijkstra, Hungate and Schwartz2015; Gardner and Gunsch, Reference Gardner and Gunsch2017) as extracellular genetic material binds to common constituents of sediments such as humics (Crecchio and Stotzky, Reference Crecchio and Stotzky1998), calcite (Cleaves et al., Reference Cleaves, Crapster-Pregont, Jonsson, Jonsson, Sverjensky and Hazen2011), clays (Goring and Bartholomew, Reference Goring and Bartholomew1952; Greaves and Wilson, Reference Greaves and Wilson1969; Cai et al., Reference Cai, Huang, Zhang and Chen2006), and other silicates (Lorenz and Wackernagel, Reference Lorenz and Wackernagel1987b; Bezanilla et al., Reference Bezanilla, Manne, Laney, Lyubchenko and Hansma1995). Soil minerals have been found to stabilize a fraction of such complexes, allowing DNA molecules to resist decomposition (Morrissey et al., Reference Morrissey, McHugh, Preteska, Hayer, Dijkstra, Hungate and Schwartz2015). However, strong mineral binding can also result in poor sedaDNA mineral release when attempting to isolate these molecules during DNA extraction (Alvarez et al., Reference Alvarez, Khanna, Toranzos and Stotzky1998; Saeki et al., Reference Saeki, Sakai and Wada2010).
Mineral-bound sedaDNA is recovered in bulk in the form of short, disseminated biomolecules from a diverse range of organisms. This generally prohibits genomic reconstructions of single individuals from eDNA samples, but it can allow for identifying the presence (and, potentially, absence and relative abundance) of organisms through time. SedaDNA methods show the most promise in reconstructing palaeoflora (Anderson-Carpenter et al., Reference Anderson-Carpenter, McLachlan, Jackson, Kuch, Lumibao and Poinar2011; Willerslev et al., Reference Willerslev, Davison, Moora, Zobel, Coissac, Edwards and Lorenzen2014; Pedersen et al., Reference Pedersen, Ruter, Schweger, Friebe, Staff, Kjeldsen and Mendoza2016; Niemeyer et al., Reference Niemeyer, Epp, Stoof-Leichsenring, Pestryakova and Herzschuh2017; Sjögren et al., Reference Sjögren, Edwards, Gielly, Langdon, Croudace, Merkel, Fonville and Alsos2017), or the variable presence of a particular taxon temporally (Graham et al., Reference Graham, Belmecheri, Choy, Culleton, Davies, Froese and Heintzman2016). Comparative analyses using eDNA, palynology, macroremains, and vegetation surveys have argued that eDNA currently functions best as a complement to traditional palaeoecological methods (Jørgensen et al., Reference Jørgensen, Haile, Möller, Andreev, Boessenkool, Rasmussen and Kienast2012a; Reference Jørgensen, Kjær, Haile, Rasmussen, Boessenkool, Andersen and Coissac2012b; Pedersen et al., Reference Pedersen, Ginolhac, Orlando, Olsen, Andersen, Holm, Funder, Willerslev and Kjær2013), as often each proxy tends to identify a partially-overlapping (complementary) set of organisms (Parducci et al., Reference Parducci, Bennett, Ficetola, Alsos, Suyama, Wood and Pedersen2017, p. 932). With ongoing progress in ancient DNA (aDNA) methods, a single DNA library (DNA fragments with artificial adapter sequences attached [ligated] to allow for high-throughput sequencing [HTS]) can increasingly be used to identify a diverse range of prokaryotic and eukaryotic organisms simultaneously from a single sample with shotgun sequencing (sequencing a random subset of a DNA library to a select depth, e.g., ten million molecules) or can be targeted to amplify or enrich for specific taxa of interest. Using a targeted approach significantly improves the informative fraction of sequenced DNA reads over shotgun sequencing by reducing the proportion of off-target molecules—especially microbial DNA that otherwise tends to proportionally dominate shotgun data.
Despite rapid advances in aDNA techniques, two extraction related challenges persist that can limit the ability to fully exploit sedimentary genetic archives: 1) the presence of enzymatic inhibitors in sediment extracts, and 2) the loss of ecologically informative sedaDNA due to overly vigorous inhibitor removal. Inhibitors are substances that inhibit a broad array of enzymatic reactions necessary to prepare DNA for sequencing, such as adapter-ligation during library preparation or polymerase chain reaction (PCR) amplification during metabarcoding (described in the following subsection). Enzymatic inhibitors are often present in higher concentrations in samples that are prepared with techniques designed to maximize the recovery of aDNA (characteristically short, damaged fragments; Dabney et al., Reference Dabney, Meyer and Pääbo2013a). Commercial kits have been designed with reagents that remove inhibitors from lysed samples, but these reagents can also remove potentially informative DNA that is already in low concentrations in ancient remains (Dong et al., Reference Dong, Yan, Liu, Zhang and Xu2006).
To address these challenges, this study evaluates various inhibitor removal treatments for their ability to reduce the carryover of enzymatic inhibitors in sedaDNA extracts while maximally retaining endogenous palaeoenvironmental DNA that can successfully undergo library adapter-ligation and targeted enrichment. Our aim is to minimize the need for excessive PCR amplifications on purified eluates by instead utilizing a capture enrichment approach (Carpenter et al., Reference Carpenter, Buenrostro, Valdiosera, Schroeder, Allentoft, Sikora and Rasmussen2013) that to date has typically been applied only to discrete, rather than disseminated, materials (Rawlence et al., Reference Rawlence, Lowe, Wood, Young, Churchman, Huang and Cooper2014, p. 614). We also wanted to determine whether this approach would be as viable for open-air sediments as the technique has been in cave contexts (Slon et al., Reference Slon, Hopfe, Weiß, Mafessoni, de sa Rasilla, Lalueza-Fox and Rosas2017). Capture enrichment would theoretically aid in part to minimize the propagation of stochastic PCR biases and allow for a far greater range of targetable genetic loci that are more amenable to aDNA fragment sizes and damage characteristics.
Four previously studied sediment core samples (D'Costa et al., Reference D'Costa, King, Kalan, Morar, Sung, Schwarz and Froese2011; Sadoway, Reference Sadoway2014; Mahony, Reference Mahony2015) recovered from Yukon permafrost exposures (Fig. 1, Table 1) in the Klondike region were chosen to experimentally optimize a new sedaDNA extraction procedure. Further details of these iterative extraction experiments are included in the supplementary materials. We based these modifications on our in-house lysis solution and high-volume binding buffer, silica-spin column extraction method as described by Dabney et al. (Reference Dabney, Knapp, Glocke, Gansauge, Weihmann, Nickel and Valdiosera2013b). Our sedaDNA modified Dabney et al. (Reference Dabney, Knapp, Glocke, Gansauge, Weihmann, Nickel and Valdiosera2013b) extraction protocol is described here (Fig. 2) and referred to in-text as the cold spin method. Experiments with alternative inhibition removal techniques are detailed in the supplementary materials as sediment extraction/enrichment testing SET-A through SET-D. The main-text experiment is referred to throughout as SET-E.
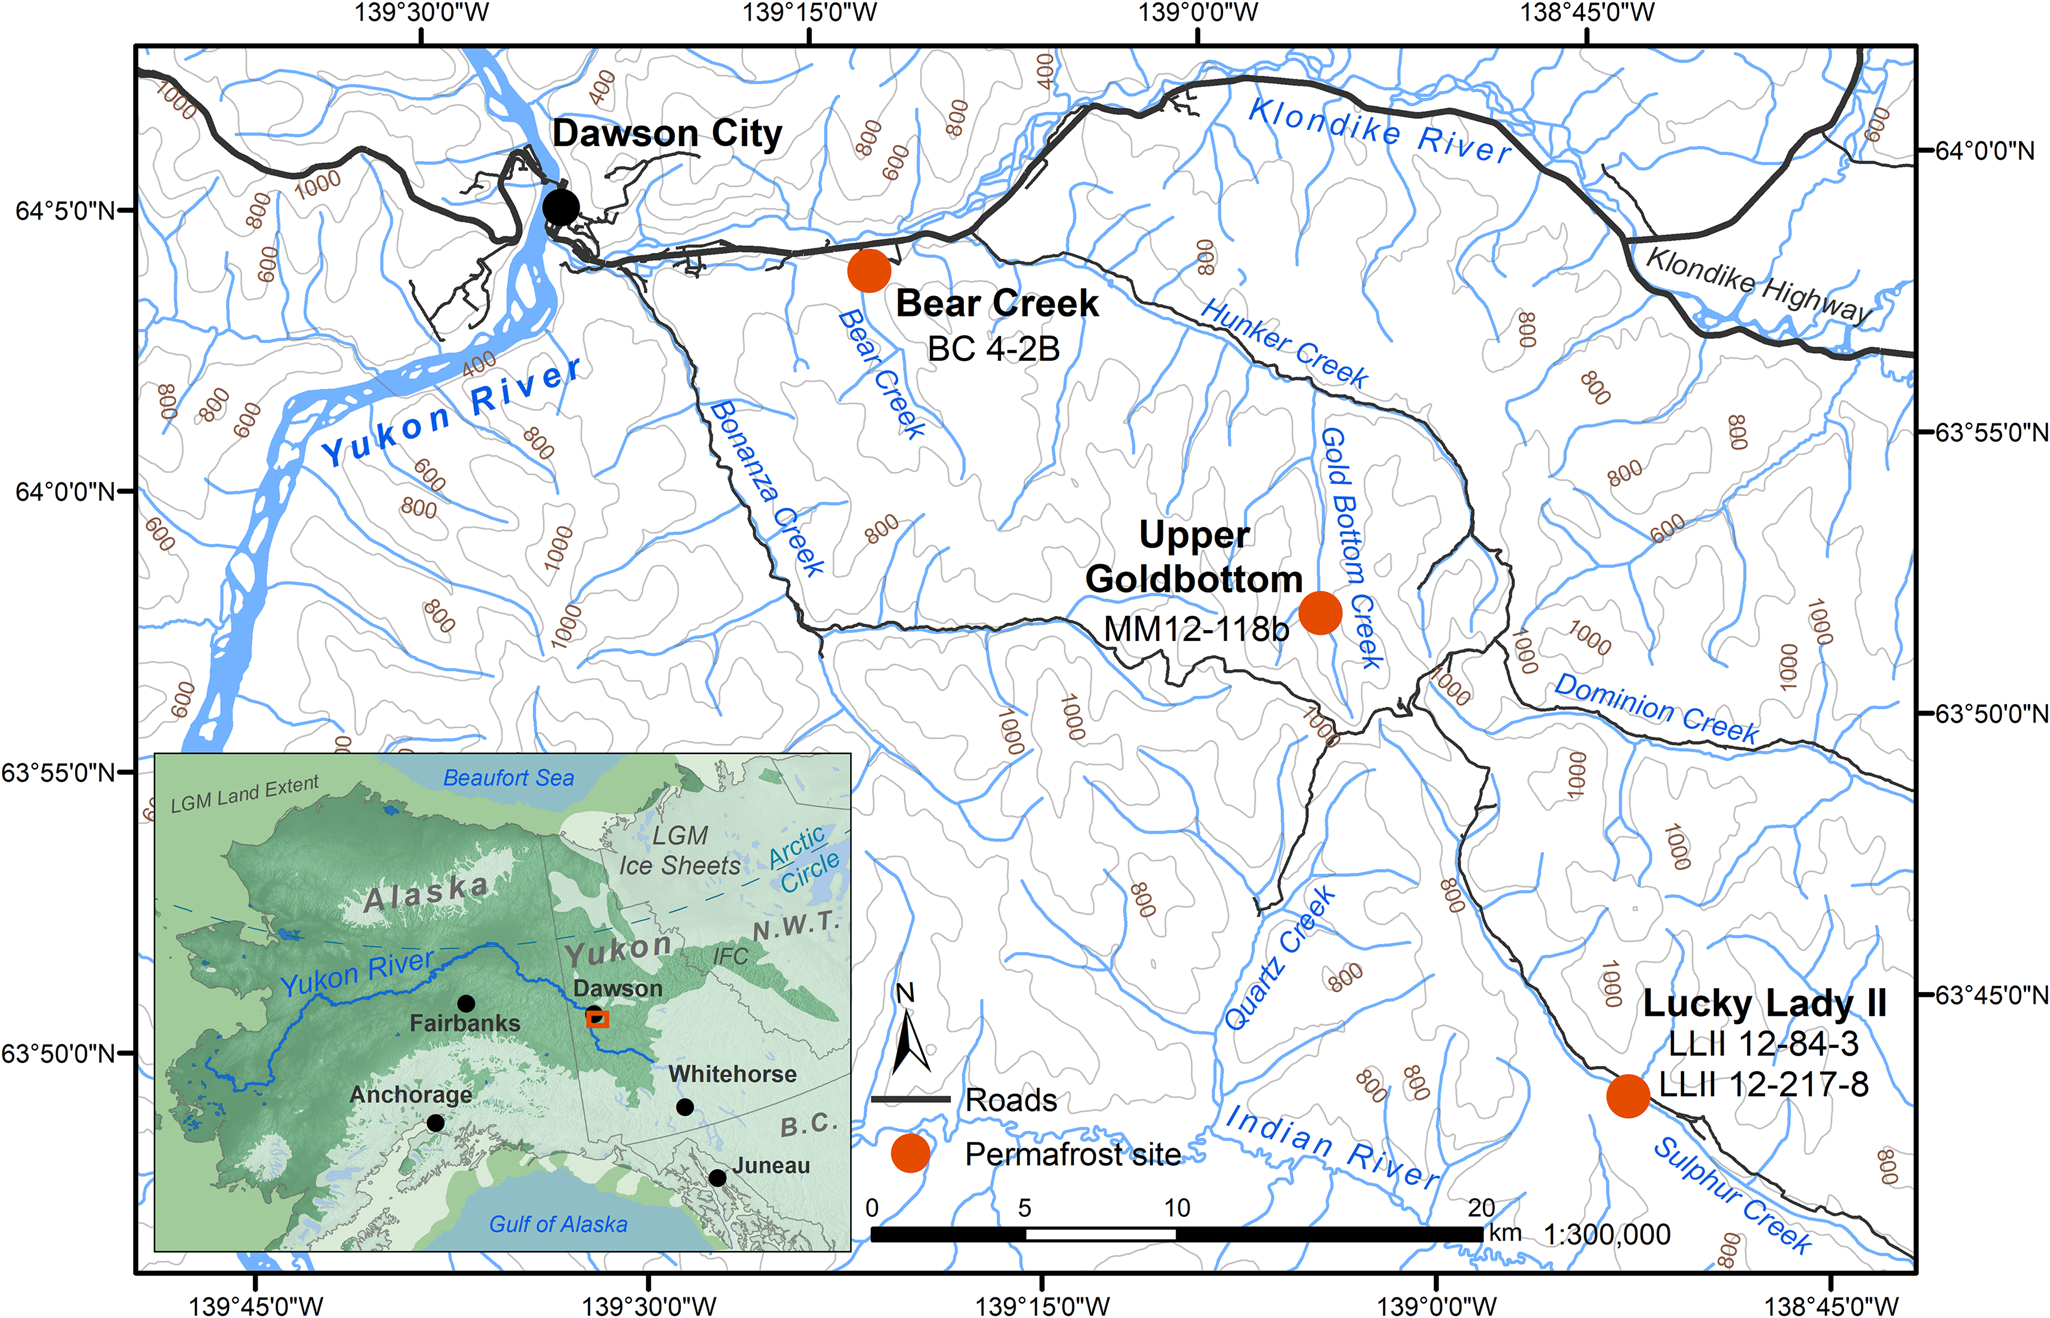
Figure 1. (color online) Permafrost sampling sites in the Klondike region of Yukon, Canada (Table 1). Ice sheet data from Dyke (Reference Dyke2004). Sea level at last glacial maximum (LGM, 26.5–19 ka BP) (Clark, Reference Clark2009) set to 126 meters below sea level (m bsl) based on midpoint between maximum and minimum eustatic sea level estimation models in Clark and Mix (Reference Clark and Mix2002). IFC = ice-free corridor. Base map data retrieved from GeoYukon (https://mapservices.gov.yk.ca/GeoYukon/, hosted by the Government of Yukon); contours elevation unit: meters above sea level.

Figure 2. (color online) Subsampling to taxon assignment schematic comparing extraction, targeting, and bioinformatic filtering strategies. See the Methods section for further details on extraction, double-stranded library preparation, capture enrichment, qPCR assays, and the bioinformatic workflow.
Table 1. Sample descriptions and read counts (SET-E).

*Reads map-filtered to animal and plant baits, size filtered to ≥ 24 bp, de-duplicated, BLASTn aligned, and MEGAN LCA assigned. **Reads map-filtered to plant references, with the same subsequent filtering parameters. Core section ages as per D'Costa et al. (Reference D'Costa, King, Kalan, Morar, Sung, Schwarz and Froese2011), Mahony (Reference Mahony2015), and Sadoway (Reference Sadoway2014).
The cold spin optimized extraction protocol was used to evaluate taxonomic assignments between shotgun sequenced and target enriched datasets from four Yukon permafrost samples. These were enriched using a bait-set designed to capture mitogenomes of extinct and extant northern animals (focused on megafauna) as well as the chloroplast barcoding loci trnL, rbcL, and matK from arctic and subarctic plants. This bait/probe set is referred to here as the PalaeoChip Arctic-1.0 bait-set. Results were also compared with shotgun and enriched libraries extracted from the same samples using the DNeasy PowerSoil DNA extraction kit (QIAGEN)—one of the most commonly utilized sedaDNA extraction procedures. For each of the four permafrost core sections, sediments were subsampled and homogenized, then split into three 250 mg replicates for both extraction methods and subsequent targeting strategies in order to also assess intrasample variability. We compared our results with previously sequenced PCR metabarcoding data (Sadoway, Reference Sadoway2014) derived also from 250 mg of the same core sections that had been extracted with a similar (but different) approach (D'Costa et al., Reference D'Costa, King, Kalan, Morar, Sung, Schwarz and Froese2011). We then used metabarcoding to amplify the chloroplast intron trnL (Taberlet et al., Reference Taberlet, Coissac, Pompanon, Gielly, Miquel, Valentini, Vermat, Corthier, Brochmann and Willerslev2007) on all of the same PowerSoil and sedaDNA optimized extracts to evaluate the variation in DNA recovery between our data and the previous Sadoway (Reference Sadoway2014) metabarcoding approach.
Background: current approaches to analyzing sedaDNA
PCR metabarcoding
PCR metabarcoding is the most popular technique in eDNA research (Taberlet et al., Reference Taberlet, Bonin, Zinger and Coissac2018, ch. 2). This approach targets short, highly variable regions of the genome (regions with enough variation to identify organisms to family, genus, or species ranks) which also happen to be immediately flanked by deeply conserved regions (an identical genetic sequence region across many organisms, such as all plants). Primers are designed to bind to these two conserved flanking regions, facilitating a PCR reaction (Saiki et al., Reference Saiki, Scharf, Faloona, Mullis, Horn, Erlich and Arnheim1985, Reference Saiki, Gelfand, Stoffel, Scharf, Higuchi, Horn, Mullis and Erlich1988; Mullis and Faloona, Reference Mullis, Faloona, Wu, Grossman and Moldave1989) that amplifies the hyper-variable internal barcode at an exponential rate. A metabarcoding approach exponentially amplifies the selected metabarcode for all DNA fragments of this target region from multiple organisms simultaneously, overwhelming any other off-target eDNA left in the sample extract. After these molecules are sequenced and processed, the reads can then be identified similarly to other approaches to determine a probable host organism using algorithmic packages such as OBITools (Boyer et al., Reference Boyer, Mercier, Bonin, Bras, Taberlet and Coissac2016) or BLASTn (Altschul et al., Reference Altschul, Gish, Miller, Myers and Lipman1990), which compare the sequenced reads against a nucleotide reference database such as GenBank NCBI (National Center for Biotechnology Information; Benson et al., Reference Benson, Cavanaugh, Clark, Karsch-Mizrachi, Lipman, Ostell and Sayers2013; Agarwala et al., Reference Agarwala, Barrett, Beck, Benson, Bollin, Bolton and Bourexis2016) or otherwise curated references. To some degree, PCR metabarcoding can mitigate the aforementioned challenges of inhibition through dilutions or additional purifications (McKee et al., Reference McKee, Spear and Pierson2015), with the addition of reagents such as bovine serum albumin (BSA) (Kreader, Reference Kreader1996; Garland et al., Reference Garland, Baker, Phillott and Skerratt2010), with high cycle numbers to facilitate inhibitor denaturation, and with high polymerase concentrations. The technique can also theoretically cope with substantial DNA loss from inefficient DNA purifications (in part, from overly aggressive inhibitor removal techniques) by exponentially amplifying low abundance molecules to sufficient concentrations for downstream manipulations.
PCR metabarcoding is widely used in eDNA applications to great effect (e.g., Giguet-Covex et al., Reference Giguet-Covex, Pansu, Arnaud, Rey, Griggo, Gielly and Domaizon2014; Willerslev et al., Reference Willerslev, Davison, Moora, Zobel, Coissac, Edwards and Lorenzen2014; Alsos et al., Reference Alsos, Sjögren, Edwards, Landvik, Gielly, Forwick and Coissac2016; Epp et al., Reference Epp, Gussarova, Boessenkool, Olsen, Haile, Schrøder-Nielsen and Ludikova2015; Sjögren et al., Reference Sjögren, Edwards, Gielly, Langdon, Croudace, Merkel, Fonville and Alsos2017), but the technique has several aspects that theoretically limit the information that can be acquired from ancient samples. Perhaps most significantly, if the few genetic regions amenable to metabarcoding fail to preserve for particular organisms in the sediment samples being tested (due to variable eDNA input as related to biomass turnover and stochastic taphonomic processes), DNA from those organisms will not be sequenced, resulting in abundant false negatives, even with a large number of PCR replicates per sample to control for stochastic amplifications (Nichols et al., Reference Nichols, Vollmers, Newsom, Wang, Heintzman, Leighton, Green and Shapiro2018, p. 8). This problem is significant for palaeoenvironmental DNA applications where substantial DNA damage and loss has occurred. Regions suitable for metabarcoding often exist on the high end of the aDNA fragment spectrum (typically >100 bp [base pairs]) whereas most aDNA fragments have an average fragment length of approximately 50 bp or less. The chloroplast trnL intron P6 loop, used for metabarcoding plants, is a relative exception with a amplicon range of 49–188 bp (with primer landing sites added [Taberlet et al., Reference Taberlet, Coissac, Pompanon, Gielly, Miquel, Valentini, Vermat, Corthier, Brochmann and Willerslev2007]). However even these short amplicons can exceed the typical DNA fragment sizes expected with degraded aDNA. Also, most sedaDNA does not come from suitable metabarcoding regions, but rather from a random metagenomic mixture of fragments in varying states of decay across a range of nuclear and organelle genomes. These non-barcoding regions are still useful in taxonomic identifications if they can be sequenced, either through expensive and inefficient deep shotgun sequencing (sequencing a library to near exhaustion) or another targeted approach. Metabarcoding is also vulnerable to differential amplification rates due to variable molecular abundance per taxa, unequal damage (by region and taxa), variability in metabarcode amplification efficiency, and variably optimal PCR conditions depending on the eDNA mixture (Kanagawa, Reference Kanagawa2003; Bellemain et al., Reference Bellemain, Carlsen, Brochmann, Coissac, Taberlet and Kauserud2010; Krehenwinkel et al., Reference Krehenwinkel, Fong, Kennedy, Huang, Noriyuki, Cayetano and Gillespie2018; Nichols et al., Reference Nichols, Vollmers, Newsom, Wang, Heintzman, Leighton, Green and Shapiro2018; Sze and Schloss, Reference Sze and Schloss2019). These factors compound downstream biases in taxonomic determinations, especially if during inhibitor removal there was substantial loss of low-abundance molecules from taxa with comparatively low biomass turnover (Yoccoz et al., Reference Yoccoz, Bråthen, Gielly, Haile, Edwards, Goslar and Von Stedingk2012, p. 3651). Metabarcoding also does not allow one to evaluate DNA damage patterns (such as cytosine deamination causing C to T base modifications on the terminal ends of aDNA fragments) due to the reliance on PCR amplifications of discrete genetic loci with intact primer landing sites. By contrast, shotgun sequencing and enrichment techniques can utilize these characteristic damage signals to build a case for ancient DNA authenticity (Ginolhac et al., Reference Ginolhac, Rasmussen, Gilbert, Willerslev and Orlando2011; Jónsson et al., Reference Jónsson, Ginolhac, Schubert, Johnson and Orlando2013).
Capture enrichment
As an alternative to PCR metabarcoding, capture enrichment (also referred to as targeted capture) is a powerful means of increasing the fraction of target molecules that can be recovered from a DNA library (Mamanova et al., Reference Mamanova, Coffey, Scott, Kozarewa, Turner, Kumar, Howard, Shendure and Turner2010; Schuenemann et al., Reference Schuenemann, Bos, DeWitte, Schmedes, Jamieson, Mittnik and Forrest2011; Carpenter et al., Reference Carpenter, Buenrostro, Valdiosera, Schroeder, Allentoft, Sikora and Rasmussen2013; Marciniak et al., Reference Marciniak, Klunk, Devault, Enk and Poinar2015). Capture enrichment involves designing a set of RNA probes or baits that closely match DNA sequences (including whole genomes) from organisms of interest, which are then allowed to hybridize to the predetermined target molecules that may be present in the DNA library. After hybridizing (either with in-solution biotinylated baits or on a solid-state microarray with pre-attached baits, see Marciniak et al., Reference Marciniak, Klunk, Devault, Enk and Poinar2015, p. 29), the target molecules are sequestered while the non-target fraction is washed away for discard or storage for alternative use (Klunk et al., Reference Klunk, Duggan, Redfern, Gamble, Boldsen, Golding and Walter2019). The technique allows for whole genome capture of multiple target organisms simultaneously, resulting in a huge increase in the proportion and diversity of informative sequenced DNA without the need for exponential PCR amplifications and the compounding biases therein—as well as substantially reduced costs compared to deep shotgun sequencing. Capture enrichment has been primarily utilized with discrete materials such as bone, having seen limited use to date with eDNA sample types (Slon et al., Reference Slon, Glocke, Barkai, Gopher, Hershkovitz and Meyer2016; Reference Slon, Hopfe, Weiß, Mafessoni, de sa Rasilla, Lalueza-Fox and Rosas2017). Targeted capture has its own associated limitations such as incomplete off-target exclusion, GC biases (due to stronger hybridization of sequences rich in guanine or cytosine bases versus those that are AT rich), and limitations in finding unexpected molecules due to reference-based bait design. However, capture enrichment has the potential to allow for a far more diverse recovery of ecologically informative eDNA across entire genomes, especially in geographic regions with relatively complete nucleotide reference databases of organisms, such as the arctic (Sønstebø et al., Reference Sønstebø, Gielly, Brysting, Elven, Edwards, Haile and Willerslev2010; Willerslev et al., Reference Willerslev, Davison, Moora, Zobel, Coissac, Edwards and Lorenzen2014). Being unrestricted by intact priming sites (compared to metabarcoding) can also allow for an assessment of molecular damage on an organism-by-organism basis (Ginolhac et al., Reference Ginolhac, Rasmussen, Gilbert, Willerslev and Orlando2011). Capture enrichment has the best potential when using a DNA extraction procedure intended to maximize DNA recovery. But, as discussed previously, this becomes a significant challenge with sedaDNA because of the high co-elution of inhibitory substances that inhibit enzymes used for adapter-ligation during library preparation.
METHODS
Field sampling
The Yukon permafrost core samples (Fig. 1, Table 1) used in this analysis were previously collected and analyzed by D'Costa et al. (Reference D'Costa, King, Kalan, Morar, Sung, Schwarz and Froese2011), Mahony (Reference Mahony2015), and Sadoway (Reference Sadoway2014) from near-vertical sediment exposures, then kept in cold storage at the McMaster Ancient DNA Centre. All four samples were analyzed by Sadoway (Reference Sadoway2014) using PCR metabarcoding. Prior to core collection by all three original research teams, the sampling area was cleared of eroded materials back to frozen sediments to create a fresh coring surface for a ~10 cm diameter coring tube ~30 cm in length. Horizontal core samples were drilled with a small portable drill, recovered frozen, stored individually in plastic bags, and transported frozen to the University of Alberta or McMaster University for subsampling. Subsamples for aDNA were taken only from core interiors (described below in Methods subsection 3) as exterior and cut surfaces are more likely to contain contaminant DNA.
Bear Creek (sample BC 4-2B)
The Bear Creek site is located 11 km east of Dawson City, Yukon, in the Klondike mining district. Mining activities exposed a ~10 m vertical sampling surface consisting of 3 m of alluvial sediment overlain by ~7 m of ice-rich loessal silt (D'Costa et al., Reference D'Costa, King, Kalan, Morar, Sung, Schwarz and Froese2011, p. Supp. 3). The Dawson tephra is prominent at the site, dating to 25,300 14C yr BP (~30,000 cal yr BP) (Froese et al., Reference Froese, Zazula and Reyes2006), and is situated between 5.2 and 6 m from the base of the exposure. Horizontal core sample BC 4-2B was collected 50 cm below the tephra under a stratified lens of ice, likely the remnant of a surface icing similar to other sites associated with Dawson tephra in the area (Froese et al., Reference Froese, Zazula and Reyes2006). The core sample was collected from reddish-brown ice-poor silts that extend below the tephra. These sediments are interpreted as the palaeosurface and include the palaeoactive layer that existed at the time of Dawson tephra deposition. This unit was preserved due to the rapid deposition of the tephra (~80 cm thick at this site) that shifted the active layer upward. Observations of the palaeoactive layer and preservation of the ice body indicate that there was no thawing or water migration in these relict permafrost sediments following deposition of the Dawson tephra (D'Costa et al., Reference D'Costa, King, Kalan, Morar, Sung, Schwarz and Froese2011, p. Supp. 3).
Upper Goldbottom (sample MM12-118b)
This site is located 28 km south of Dawson along Goldbottom Creek, a tributary of Hunker Creek and the Klondike River. The 28.5 m exposure was divided by Mahony (Reference Mahony2015, pp. 65–82) into five units, dating roughly between ~46,000 cal yr BP near the base, to ~6000 cal yr BP near the surface. The core sample MM12-118b used in this study comes from Unit 4 near the top of the exposure. The sediments consist of black and grey organic-rich silts with thin interbedded lenses of gravels and sand, as well as components of green-grey silts and interbedded humified brown organic silts. In situ graminoid and shrub macrofossils were also identified. Unit 4 is estimated to have begun deposition ca. 10,600 cal yr BP (9395 ± 25 14C yr BP, UCIAMS-114910) (Mahony, Reference Mahony2015, p. 77). The permafrost core used in this analysis (MM12-118b) was dated to the early Holocene at ca. 9685 cal yr BP (Mahony, Reference Mahony2015, p. 189).
Lucky Lady II (samples LL2-12-84-3 and LL12-12-217-8)
The Lucky Lady II site is located 46 km south of Dawson in the Sulphur Creek tributary of the Indian River. The site has an 11.5 m exposure that Mahony (Reference Mahony2015, pp. 82–95) divided into two units; five vertical cores were taken at the site for high-resolution isotopic and radiocarbon analyses. The two core samples utilized in this study come from the lowermost unit, 0–3.5 m, which is estimated to have been deposited from ca. 16,500 to 13,140 cal yrs BP (13,680 ± 35 14C yr BP, UCIAMS-51324 to 11,290 ± 160 14C yr BP, UCIAMS-56390) (Mahony, Reference Mahony2015, p. 85). This unit consists of grey silt with a thick black organic-rich horizon (palaeosol) at 2.7 m dating from 13,410 to 13,140 cal yrs BP (11,580 ± 35 14C yr BP, UCIAMS-143308; 11,290 ± 160 14C yr BP, UCIAMS-56390) with several thinner palaeosol horizons above. The unit includes in situ graminoid macrofossils and multiple Spermophilus parryii (arctic ground squirrel) nests; several Equus sp. (horse) and Bison sp. (bison) bones were also identified. The unit is suggestive of a steppe-tundra landscape. Two core samples were selected from this site for experimental testing based on work by Sadoway (Reference Sadoway2014). Core sample LLII-12-84-3 was dated to 13,205 cal yr BP, while core sample LLII-12-217-8 was dated to 15,865 cal yr BP (Sadoway, Reference Sadoway2014, p. 29).
Lab setting
Laboratory work was conducted in clean rooms at the McMaster Ancient DNA Centre. These rooms are subdivided into dedicated facilities for sample preparation, stock solution setup, and DNA extraction through library preparation. Post-indexing and enrichment clean rooms are in a physically isolated facility, while high-copy PCR workspaces are in separate building with a one-way workflow progressing from low-copy to high-copy facilities. Each dedicated workspace is physically separated with air pressure gradients between rooms to reduce exogenous airborne contamination. Prior to all phases of laboratory work, dead air hoods and workspaces were cleaned using a 6% solution of sodium hypochlorite (commercial bleach) followed by a wash with Nanopure purified water (Barnstead) and 30 minutes of UV irradiation at >100 mJ/cm2.
Subsampling
Metal sampling tools were cleaned with commercial bleach, rinsed with Nanopure water immediately thereafter, and heated overnight in an oven at ~130°C. Once the tools had cooled, work surfaces were cleaned with bleach and Nanopure water and covered with sterile lab-grade tin foil. Sediment cores previously split into disks (D'Costa et al., Reference D'Costa, King, Kalan, Morar, Sung, Schwarz and Froese2011, p. SI. 4–5; Sadoway, Reference Sadoway2014, ch. 1) and stored at −20°C had the upper ~1 mm of external sediment chiselled off to create a fresh sampling area free of exogenous contaminants for a hollow cylindrical drill bit. The drill bit (diameter 0.5 cm) was immersed in liquid nitrogen prior to sampling and a drill press was used to repeatedly subsample the disk sections (see D'Costa et al., Reference D'Costa, King, Kalan, Morar, Sung, Schwarz and Froese2011, Fig. S3). Sediment was pushed out of the drill bit using a sterile nail and the bottom 1–2 mm of sediment from the bit was removed before dislodging the remaining sample. This exterior core portion was carefully removed as it has a higher chance of containing sedaDNA from other stratigraphic contexts due to coring and core splitting. A bulk set of subsampled sediment from the same core disk was homogenized by stirring in a 50 mL falcon tube and stored at −20°C for subsequent extractions. This process was repeated individually for each core sample (Fig. 2).
Physical disruption, chemical lysis, and extraction
Subsamples from the four cores were homogenized by core and split into triplicates for each extraction method (24 extracts + 3 blanks), which were each used for shotgun, enrichment, and trnL metabarcoding. DNeasy PowerSoil DNA Extraction kit samples were extracted following manufacturer specifications; purified DNA was eluted twice with 25 μL EBT buffer (10 mM Tris-Cl, 0.05% Tween-20). Samples extracted with our cold spin extraction method (a sedaDNA modified version of the Dabney et al. [2013b] extraction) were processed as follows (see Fig. 2):
Lysis (DNA release)
1) 500 μL of a digestion solution (see Table S1) initially without proteinase K was added to PowerBead tubes (already containing garnet beads and 750 μL 181 mM NaPO4 and 121 mM guanidinium isothiocyanate from the manufacturer).
2) 250 mg of homogenized sediment was added to each PowerBead tube.
3) PowerBead tubes were vortexed at high speed for 15 minutes, then centrifuged briefly to remove liquid from the lids.
4) 15.63 μL of proteinase K (stock 20 mg/mL) was added to each tube to reach a proteinase K concentration of 0.25 mg/mL in the digestion and PowerBead solution (a total volume of 1.25 mL).
5) Tubes were finger vortexed to disrupt sediment and beads that had pelleted in step 3.
6) PowerBead tubes were securely fixed in a hybridization oven set to 35°C and rotated overnight for ~19 hours, ensuring that the digestion solution, sediment, and PowerBeads were moving with each oscillation.
7) PowerBead tubes were removed from the oven and centrifuged at 10,000 x g for 5 minutes (the maximum speed recommended for PowerBead tubes). Supernatant was transferred to a MAXYMum Recovery 2 mL tube and stored at −20°C.
Purification (DNA isolation)
8) The digestion supernatant was thawed, briefly centrifuged, and added to 16.25 mL (13 volumes) of high-volume Dabney binding buffer (see Table S2) in a 50 mL falcon tube and mixed by repeatedly inverting the tube by hand.
9) Falcon tubes were spun at 4500 x g in a refrigerated centrifuge set to 4°C for 20 hours overnight. (In subsequent experiments, we have found that this speed can be reduced to 2500 x g with no noticeable declines in inhibitor precipitation [data not shown].)
10) After centrifugation, falcon tubes were carefully removed and the supernatant was decanted, taking care to not disturb the darkly coloured pellet that had formed at the base of the tube during the cold spin.
11) The binding buffer was passed through a high-volume silica column (High Pure Extender Assembly, Roche Diagnostics) and extraction proceeded as per Dabney et al. (Reference Dabney, Knapp, Glocke, Gansauge, Weihmann, Nickel and Valdiosera2013b).
12) Purified DNA was eluted off the silica columns with two volumes of 25 μL EBT.
Prior to all subsequent experiments, both the cold spin and PowerSoil extracts were centrifuged at 16,000 x g for 5 minutes to pellet remaining co-eluted inhibitors.
Library preparation
Double-stranded libraries were prepared for each extract as described in Meyer and Kircher (Reference Meyer and Kircher2010) with modifications from Kircher et al. (Reference Kircher, Sawyer and Meyer2012) and a modified end-repair reaction to account for the lack of uracil excision (Table S3). Samples were purified after blunt-end repair with a QIAquick PCR Purification Kit (QIAGEN) to maximally retain small fragments and after adapter ligation (Table S4) with a MinElute PCR Purification Kit (QIAGEN), both using manufacturers protocols. Library preparation master mix concentrations can be found in Tables S3-S6.
qPCR: Inhibition spike tests, total quantification, and indexing
Quantitative PCR (qPCR) is a technique that uses fluorescent dyes that intercalate with double-stranded DNA to monitor PCR amplifications in real-time, as opposed to at the end of the reaction with standard PCR. When paired with DNA standards at known concentrations, qPCR can be used to quantify the starting concentrations of particular DNA molecules in a sample (such as all DNA fragments derived from plants or mammals) or to quantify the total number of molecules that were successfully adapter-ligated during library preparation. The technique can also be used to assess the inhibition load of a sample as these inhibitory substances affect the rate of PCR amplification (King et al., Reference King, Debruyne, Kuch, Schwarz and Poinar2009). See supplementary Appendix A (section SET-A. Inhibition Index and Fig. S6) for details on the inhibition spike test. Total library DNA quantifications reported here and in the supplementary materials used the short amplification primer sites on the library adapters to quantify total DNA copies per 1 μL with averaged PCR duplicates prior to indexing PCR (Table S8).
For each of the four cores and two extraction methods the subsampled triplicate with the highest total DNA concentrations (as based on the short amplification qPCR) was indexed for shotgun sequencing (8 samples + 3 blanks). All subsampled triplicates (24 samples + 3 blanks) were indexed separately thereafter for targeted enrichment and sequencing. Metabarcoded samples were processed identically, but with a trnL PCR amplification prior to library preparation.
Targeted capture enrichment
The PalaeoChip Arctic-1.0 hybridization enrichment bait-set was designed in collaboration with Arbor Biosciences to target the mitogenomes of extinct and extant Quaternary animals (focused primarily on megafauna; number of taxa ≈ 180), and high-latitude plants based on curated reference databases developed by Sønstebø et al. (Reference Sønstebø, Gielly, Brysting, Elven, Edwards, Haile and Willerslev2010), Soininen et al. (Reference Soininen, Gauthier, Bilodeau, Berteaux, Gielly, Taberlet and Gussarova2015), and Willerslev et al. (Reference Willerslev, Davison, Moora, Zobel, Coissac, Edwards and Lorenzen2014), initially targeting the trnL locus (n ≈ 2100 taxa) in the chloroplast genome with the addition of rbcL and matK loci where available (see Appendix B in the online supplementary materials for taxonomic list). Baits were hybridized at 55°C for 24 hours. Further details on design and wet-lab procedures can be found in the supplementary online materials (Appendix A, section SET-E. Enrichment).
Post-indexing total quantification, pooling, size-selection, and sequencing
Post-indexed libraries were quantified using the long-amplification total library qPCR assay with averaged PCR duplicates (Table S10). Thereafter, those libraries were pooled to equimolar concentrations using the qPCR derived molarity estimates. This is to equalize sequencing depth between samples with wide ranges in molarity. Libraries that were enriched, shotgun sequenced, or that had been amplified with PCR metabarcoding were each pooled separately. The three pools were size-selected with gel excision following electrophoresis for molecules ranging from 150 bp to 600 bp. Gel plugs were purified using the QIAquick Gel Extraction Kit (QIAGEN), according to manufacturer's protocols, then sequenced on an Illumina HiSeq 1500 with a 2 x 90 bp paired-end protocol at the Farncombe Metagenomics Facility (McMaster University).
PCR metabarcoding
Sadoway (Reference Sadoway2014) previously worked with these and many other Yukon permafrost core samples using a metabarcoding approach. These libraries had been extracted in duplicate with guanidinium protocols (Boom et al., Reference Boom, Sol, Salimans, Jansen, Wertheim-Van Dillen and van der Noordaa1990; D'Costa et al., Reference D'Costa, King, Kalan, Morar, Sung, Schwarz and Froese2011) from 250 mg of the same core sections, purified with silica (Höss and Pääbo, Reference Höss and Pääbo1993), and eluted twice (Handt et al., Reference Handt, Krings, Ward and Pääbo1996). Further details of Sadoway's metabarcoding approach can be found in the supplementary Appendix A, section SET-E. Sadoway (Reference Sadoway2014) PCR metabarcoding.
As a follow-up to assess whether metabarcoding with PowerSoil or our cold spin extractions would produce different results than those from Sadoway, we used the same P6 loop trnL primers (Taberlet et al., Reference Taberlet, Coissac, Pompanon, Gielly, Miquel, Valentini, Vermat, Corthier, Brochmann and Willerslev2007) to amplify all of the extracts from the SET-E experiments (Table 1). Each sample extract was PCR amplified in triplicate (PCR conditions and qPCR results are detailed in the supplementary Appendix A, SET-E. PCR metabarcoding trnL), then purified with a 10K AcroPrep Pall plate using a vacuum manifold and pooled into a single 50 μL sample extract in EBT. These trnL metabarcoded extracts were then library prepared, indexed, and pooled at equimolar concentrations following the same aforementioned procedures, but in a post-PCR facility. They were sequenced at the Farncombe Metagenomics Facility on an Illumina HiSeq 1500 with a 2 x 90 bp paired-end protocol to an approximate depth of 500,000 reads.
Bioinformatic processing, MEGAN LCA, false positives, and bubble-charts
Additional details on the bioinformatic workflow can be found in supplementary Appendix A (section SET-E. Bioinformatic workflow). In brief, after trimming and merging with leeHom (Renaud et al., Reference Renaud, Stenzel and Kelso2014), the sequenced DNA reads were mapped with network-aware-BWA (Li and Durbin, Reference Li and Durbin2009) (https://github.com/mpieva/network-aware-bwa) to both the animal and plant baits as well as to the original plant target references (targeting trnL, matK, rbcL) in order to filter out off-target molecules, hereafter referred to as map-filtering (see Fig. 2). Two map-filtering approaches were used as we observed that while mapping to the baits is more conservative, it may unfairly bias against metabarcoding amplicons as they may not map well to the artificially tiled (and highly curated) 80 bp probes (see section SET-E. Map-filtered to plant reference sequences in supplementary Appendix A for more details). Map-filtered reads were length filtered to ≥ 24 bp (as smaller sequences generally have low support when assessing taxonomy), string de-duplicated (to remove molecules artificially duplicated during PCR) with the NGSXRemoveDuplicates module of NGSeXplore (https://github.com/ktmeaton/NGSeXplore), and then BLASTn (Altschul et al., Reference Altschul, Gish, Miller, Myers and Lipman1990) aligned against a July 2018 local copy of the GenBank NCBI nucleotide database set to return the top 100 alignments (taxonomic hits) per read. Fasta and blast files (file types containing sequenced reads [fasta] and the taxonomic alignments [blast]) were passed to MEGAN (Huson et al., Reference Huson, Auch, Qi and Schuster2007; Reference Huson, Beier, Flade, Górska, El-Hadidi, Mitra, Ruscheweyh and Tappu2016) where the BLAST results were filtered through a lowest common ancestor (LCA) algorithm (selected parameters detailed in supplementary Appendix A, section SET-E. Bioinformatic workflow).
MEGAN LCA
The MEGAN LCA algorithm determines the lowest taxonomic rank at which a set of reads can be assigned based on the assigned threshold of confidence values. For example, to call Bison bison as being present in this instance, at least 3 unique reads must align to a region of the B. bison mitogenome with ≥ 95% identical similarity, with low e-values and high bit scores (metrics used by BLASTn to assess the likelihood of misalignments), and by matching or exceeding other parameters used to define confidence in the taxon identification (the rational for select LCA parameters are discussed further in supplementary Appendix A SET-E. Bioinformatic workflow). Adjusting LCA parameters shifts the trade-off ratio of false positive to false negative assignments, although it would seem that optimal LCA parameters may only exist on a project-by-project or even sample-by-sample basis depending on the taxonomic molecular constituents present, the degree of aDNA damage, and the research question (see Huson et al., Reference Huson, Albrecht, Bağci, Bessarab, Górska, Jolic and Williams2018). For example, if percent identity is set to 100, only exact matches will be considered, but then aDNA fragments with terminal base modifications (the majority of aDNA molecules) will be unassigned when their taxonomic classification might otherwise be obvious. Further, increasing the number of reads necessary to call a taxon node as being present can artificially bias the data to organisms that release more eDNA irrespective of actual biomass or had better organo-mineral complex preservation characteristics. For example, woody plants at boreal sites have been observed by Yoccoz et al. (Reference Yoccoz, Bråthen, Gielly, Haile, Edwards, Goslar and Von Stedingk2012, p. 3652) to have proportionally less DNA presence relative to above-ground biomass as compared with graminoids and forbs. This would imply that DNA recovery cannot be easily correlated with plant biomass across functional types without some form of calibration, which would likely require extensive region-specific experimentation. If minimum read counts are set too high, we might expect that some rarer woody plants would become undetectable while others would appear to be in low abundance, and that forbs would bias towards an over-representation.
Similarly, the LCA parameter top percent sets a percentage threshold of hits to be used for taxonomic classification based on the top bit-scores for a read as reported by BLAST. If this value is set too high (> 50%), reads that might otherwise have obviously best hits to a species or genus will instead be assigned to higher (less taxonomically useful) ranks such as family or order due to other BLAST hits for the same read with lower bit-scores (less sequence similarity), thus inaccurately influencing read assignment. Setting this value too low (< 5%), can likewise make taxonomic assignments inaccurately specific by artificially ignoring hits with marginally lower bit-scores that are just as likely to represent the host organism. These ambiguities in optimal LCA threshold values are compounded by database incompleteness and the overrepresentation of certain organisms of economic or scientific interest, the unknowns of palaeo-biogeography (Jackson, Reference Jackson2012), variably specific genetic loci (Kress and Erickson, Reference Kress and Erickson2007), erroneous GenBank references (Shen et al., Reference Shen, Chen and Murphy2013; Lu and Salzberg, Reference Lu and Salzberg2018), limitations of NCBI BLASTn and equivalent algorithms (Shah et al., Reference Shah, Nute, Warnow and Pop2019), and other evolutionary complexities that blur species boundaries such as introgressive hybridization (Whitworth et al., Reference Whitworth, Dawson, Magalon and Baudry2007; Percy et al., Reference Percy, Argus, Cronk, Fazekas, Kesanakurti, Burgess, Husband, Newmaster, Barrett and Graham2014).
Alternative approaches, such as the phylogenetic intersection analysis (PIA) recently reported by Cribdon et al. (Reference Cribdon, Ware, Smith, Gaffney and Allaby2020), may be better suited to resolving some of these uncertainties in determining optimal criteria for taxonomic identification. These challenges are relatively typical of proxy measures of palaeobiota (e.g. Jackson, Reference Jackson2012; Baker et al., Reference Baker, Bhagwat and Willis2013; Fiedel, Reference Fiedel2018) and are in need of further research. In a rough sense here, the more unique reads assigned to a taxon node (relative to similar organisms), the higher the likelihood that those taxa were indeed present. Further, relative shifts in read proportion through time (such as the ratio of graminoids and forbs to conifers and woody shrubs) can serve as a very rough estimate of past relative abundance (although this must be interpreted carefully as many stochastic processes are involved in eDNA release, degradation, preservation, and recovery). We suggest that the LCA parameters utilized here balance the challenges of false positive and false negative assignments well for these particular samples, although more research is needed to improve the criteria by which confidence parameters are selected and utilized algorithmically.
False positives
To alleviate observations of sporadic false positives in the plant data for the genus level comparisons, all plant genera were individually inspected and queried online to determine if any extinct or extant species from those clades have been observed in northern or alpine North America or northeastern Eurasia. Clades assessed to be highly improbable (those with known biogeographic extents limited to non-Holarctic regions) were added to a running list of disabled taxa in MEGAN that repeatedly were identified in this and other parallel research (Table S18). We believe these false positives are driven by an abundance of genetic research on specific taxa within these unlikely clades and an absence of data for whatever the real taxon is. Cribdon et al. (Reference Cribdon, Ware, Smith, Gaffney and Allaby2020, pp. 2–4) refers to these false positive hits as oasis taxa. In uneven databases, sparsely populated genetic references within a clade can succumb to oases where a set of well-studied organisms drive an illusion of confidence in genetic alignments because those are the only ‘good’ alignments available for that read. This makes the alignment seem confident and highly specific because the wider range of organisms within those clades have yet to be sequenced. This confidence due to reference oases makes it difficult to remove false positive hits via stricter LCA parameters without also dropping a significant proportion of reads that have equally confident metrics, but are instead driven by genetically well represented clades that happen to make ecological sense. The MEGAN LCA algorithm has been demonstrated to be robust to false positives (Huson et al., Reference Huson, Auch, Qi and Schuster2007; Reference Huson, Albrecht, Bağci, Bessarab, Górska, Jolic and Williams2018), but Cribdon et al. (Reference Cribdon, Ware, Smith, Gaffney and Allaby2020) argue that oasis taxa can remain a problem unless addressed via manually removing so-called problematic taxa or using an approach such as their PIA algorithm. We were unaware of this software approach at the time of analysis, and instead opted for a manual removal of suspected oasis taxa. A manual exclusion approach may limit the possibility of identifying biogeographically unknown and ‘rare’ taxa that may otherwise have evaded detection in Quaternary records to date, but does allow for a more nuanced decision process that might otherwise be obfuscated by a set of arbitrary cut-off values. The oasis problem could also likely be alleviated with a highly curated, non-redundant, and regionally specific reference database, but this would further limit the ecological reconstruction to only organisms one expects to find. Oasis reference taxa are likely to become less problematic as reference databases are improved over time, and as alignment algorithms are better designed to cope with uneven database coverage. Increasing the BLASTn top hits to 500 or more, as suggested by Cribdon et al. (Reference Cribdon, Ware, Smith, Gaffney and Allaby2020), is also something we have found in parallel research aids in combating database unevenness (data not reported here), but does often create very large blast files.
To address the probable false positive assignments here, for all genus-level plant bubble-chart comparisons (Figs. 6–7, S23–S27, as well as Fig. 4), we used a manual exclusion approach using a list of improbable taxa (oasis candidates) observed in these metagenomic reconstructions as well as other permafrost and lake sediments processed in parallel (list available in supplementary Appendix A, Table S18). Other metagenomic comparisons reported here (Figs. 6, S20–S22, S28–S33) do not include these improbable taxa as disabled in MEGAN. Probable oasis references appear to have very low LCA-assigned read counts even when summed to high taxonomic ranks (e.g., Zingiberales) when compared with taxonomic nodes that make palaeoecological sense (see Figure 5 for an example). As such, these highly improbable taxa do not appear to constitute a sizable fraction of the organisms identified in this analysis.
Bubble-charts
Libraries were compared using bubble-charts with logarithmically scaled bubbles for visually proportional normalizations, but with absolute read counts retained. For the site-by-site charts reporting both animal and plant reads (Figs. 6, S20–S22, S28–S31), the plants were collapsed to higher taxonomic ranks to allow for summarized comparisons. For the plant map-filtered charts (Figs. 6–7, S23–S27), all data were collapsed to the genus rank—meaning all LCA assignments to species or subspecies were pushed up to the rank genus and summed with other species within that clade. This is to mitigate species-specific resolution problems, driven in part by database incompleteness, where only a subset of species in a genus may have been sequenced for a particular locus to date. This can be seen for example with Sitka willow (Salix sitchensis), which has yet to be sequenced (and uploaded to GenBank) for the trnL locus, as compared to Arctic willow (Salix arctica), which is represented. This would theoretically increase the likelihood of species misassignment within that genus if the actual organism from which those DNA fragments is derived has yet to be sequenced or if that locus is not species-specific for the clade—compounded again with ancient samples by taphonomy, diachronic biogeographic shifts, and molecular evolution.
RESULTS
Methodological comparison
qPCRs on the DNA libraries show an up to 7.0x increase in total adapted DNA over PowerSoil extractions among the four core samples (average 3.6x increase) with our cold spin extraction procedure, and an up to 5.6x increase in ‘endogenous’ trnL library adapted chloroplast DNA (average 3.0x increase) (Figs. 3 and S16). Inhibition indices for our cold spin extractions were lower than PowerSoil (average = 0.75 versus 0.95 for PowerSoil, see section SET-A. Inhibition Index in supplementary Appendix A for a description of the inhibition index), meaning that more inhibitors were retained with our cold spin extractions compared with PowerSoil. However, these inhibitors did not dramatically reduce enzymatic efficiency during adapter ligation; in post-library preparation qPCR assays (Figs. 3 and S16) these cold spin samples quantify with significantly more library adapted DNA than PowerSoil extracts, despite some inhibitor retention. When these samples were extracted following standard Dabney et al. (Reference Dabney, Knapp, Glocke, Gansauge, Weihmann, Nickel and Valdiosera2013b) procedures without the cold spin, they were completely inhibited (see supplementary Appendix A, SET-A).
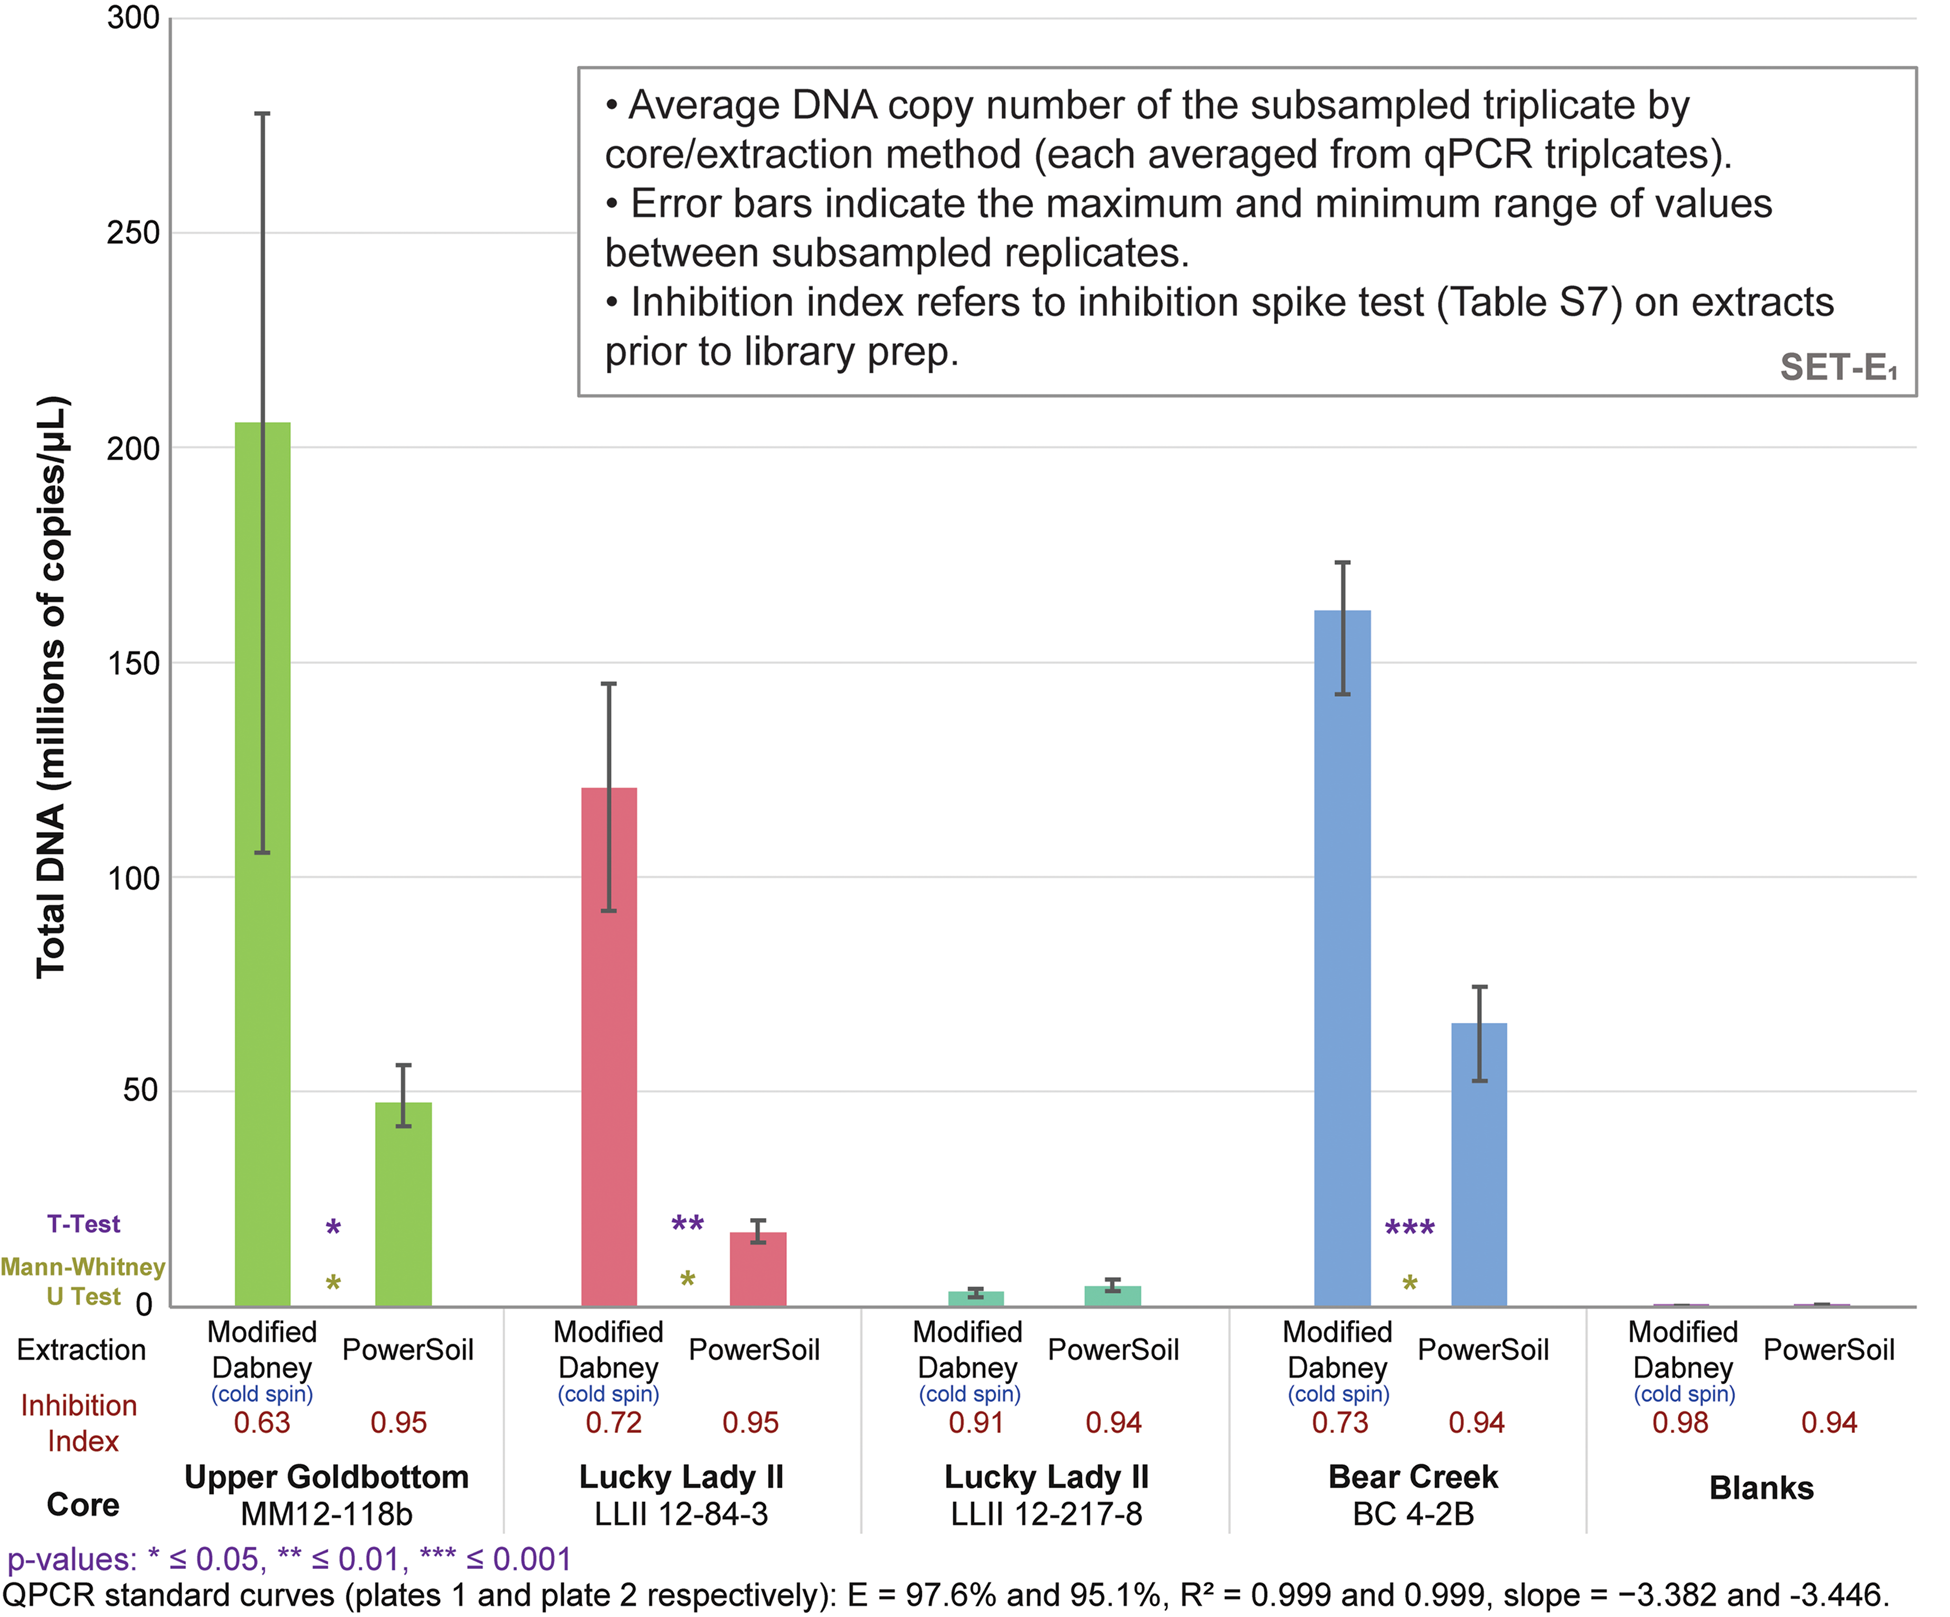
Figure 3. (color online) Total DNA quantification of library-adapted molecules comparing both extraction methods by core sample (see Table S8 for qPCR specifications). The large range for modified Dabney extraction on core MM12-118B is driven by a single extraction replicate with a lower copy number. Core LLII 12-217-8 consistently has low DNA recovery but also a low co-elution of DNA-independent inhibition. Core LLII 12-127-8 likely contains predominantly highly degraded sedaDNA compared with the other three samples (discussed further in supplementary Appendix A, subsection SET-D). Values indicate total reads assigned to that taxon node.
LCA-assigned reads from samples extracted using our sedaDNA modified Dabney protocol paired with PalaeoChip enrichments show a 7.7–19.3x increase in LCA assigned reads over enriched PowerSoil extracts, and a 1.2–59.9x increase compared with Sadoway's (Reference Sadoway2014) plant and animal PCR metabarcoding approach (Table S21). An equivalent increase is observed when comparing the trnL metabarcoded PowerSoil and cold spin extracts with those that were extracted with the cold spin and enriched (2.3–23.0x and 2.9–19.5x increases, respectively). Compared with shotgun, the increase in map-filtered DNA for the cold-spin enriched samples is consistently three orders of magnitude, where shotgun sequencing recovered almost no ecologically informative DNA from our plant mapped references for any of the core slices at a depth of 2 million reads. However, several nuclear and broader chloroplast loci were identified in the non-mapped shotgun data; this is discussed further in supplementary Appendix A, SET-E. Additional data. LCA-assigned read count is not necessarily the most informative metric when comparing these methods, however, as many reads in all variants were assigned to high taxonomic ranks with limited interpretive utility. More important is the breadth of organisms identified by being able to target multiple loci simultaneously and capture fragments too small for metabarcoding. Targeted enrichments, when paired with the cold spin extractions, recover the same predominant taxa as the two metabarcoding approaches, but with a far greater diversity of identified organisms (Figs. 4–7, S20–S27). Taxa with sufficiently high LCA-assigned read counts from the enriched libraries also show characteristic aDNA deamination patterns and fragment length distributions with mapDamage (Jónsson et al., Reference Jónsson, Ginolhac, Schubert, Johnson and Orlando2013) (Fig. 8). We also observe that extraction replicates show minimal variation in terms of taxonomic assignments between homogenized subsamples, suggesting that the trends observed are a result primarily of differences in method and not intrasample variation.

Figure 4. (color online) Metagenomic summary comparison of all four permafrost core samples that were extracted with the sedaDNA modified Dabney (cold spin) method, capture-enriched with the PalaeoChip baits, and map-filtered to the target bait sequences. Metabarcoding and PowerSoil libraries are not depicted. Subsampled replicates merged in MEGAN. Only select organisms depicted.

Figure 5. (color online) Metagenomic comparison of the Bear Creek core sample (BC 4-2B). Reads map-filtered to the baits and compared with absolute counts and logarithmically scaled bubbles. Sample dated to ~30,000 cal yr BP (D'Costa et al., 2011; Sadoway, 2014; Mahony, 2015). Values indicate total reads assigned to that taxon node for Animalia, and a clade summation of reads for Viridiplantae. Note: hits to Arecales, Bromeliaceae, Restionaceae, Zingiberales, and Diosoreales are likely false positives driven by uneven reference coverages within Commelinids (see Methods subsection 10).

Figure 6. (color online) Metagenomic comparison of Upper Goldbottom core MM12-118b with reads map-filtered to the plant references, part 1 of 2. Compared with absolute counts and logarithmically scaled bubbles. Core slice dated to 9685 cal yr BP (Sadoway, 2014; Mahony, 2015). Values indicate total reads assigned to that taxon node.

Figure 7. (color online) Metagenomic comparison of Upper Goldbottom permafrost core MM12-118b with reads map-filtered to the plant references, part 2 of 2. Compared with absolute counts and logarithmically scaled bubbles. Core slice dated to 9685 cal yr BP (Sadoway, 2014; Mahony, 2015). Values indicate total reads assigned to that taxon node.

Figure 8. (color online) Example mapDamage plots showing aDNA characteristic terminal deamination patterns and short fragment length distributions (FLD) (length filter ≥ 24 bp, mapping quality filter ≥ 30). We suspect that the bimodal distributions in some of the plant FLDs is due to non-specific mapping of closely related taxa. Taxa chosen for mapping are not necessarily accurate species of the ancient molecules, such as in this case Equus caballus, but rather a closely related organism with an available NCBI-RefSeq organelle genome.
While qPCR amplifications indicate much higher starting quantities of DNA for samples extracted with the cold spin method compared to PowerSoil (Fig. S17), the downstream metagenomic comparisons show no noticeable differences in taxonomic profiles between the two extraction methods for trnL metabarcoded libraries (Figs. 6–7, S22–S26). In multiple instances, the cold spin metabarcoded samples recovered a somewhat taxonomically broader set of eDNA across subsampled replicates, but the effect is marginal at best. We suspect that the high cycle numbers during PCR amplification compensated for the relative DNA loss of the PowerSoil extracts (observable in Fig. S17), amplifying the lower concentration sedaDNA of PowerSoil to the same relative taxonomic proportions. Further modifications to the cold spin extraction method may aid a metabarcoding approach. But at this time, only samples intended for enrichment or shotgun sequencing would be best served with the cold spin.
Palaeoecology
We observed a diverse range of molecularly identified animals and plants from well-preserved sedaDNA in these permafrost samples (Fig. 4). These data correspond well with palaeoecological understandings of environmental change around the Pleistocene-to-Holocene transition (Dyke, Reference Dyke2005; Zazula et al., Reference Zazula, Froese, Westgate, la Farge and Mathewes2005, Reference Zazula, Schweger, Beaudoin and McCourt2006), but with some notable exceptions. Our cold spin extraction method paired with targeted enrichment (using the PalaeoChip Arctic-1.0 bait-set) recovered potential sedaDNA evidence for the late survival of mammoth (Mammuthus sp.) and horse (Equus sp.) in the Klondike region of Yukon, Canada, as well as an early indication of low abundance pine (Pinus sp.) (Fig. 4). The significance and means by which to interpret these data is discussed further under Palaeoecology below.
DISCUSSION
Our cold spin inhibitor removal procedure, paired with Dabney et al. (Reference Dabney, Knapp, Glocke, Gansauge, Weihmann, Nickel and Valdiosera2013b) aDNA purifications and capture enrichment, consistently recovered a broader taxonomic set of on-target environmental molecules than the PowerSoil extraction kit paired with targeted enrichment, shotgun sequencing (with either extraction method), an older PCR metabarcoding approach, or a plant-specific trnL metabarcoding approach (with either extraction method). Over 70% of the taxon classifications identified with cold spin extractions paired with the PalaeoChip enrichments would not have been identified with alternative approaches (Figs. 4–7, S20–S27). These results demonstrate the viability of targeted enrichment for taxonomically diverse environmental samples from permafrost exposures without the necessity of PCR metabarcoding and the associated compounding biases therein. These data also demonstrate the significantly improved breadth and sequencing efficiency of eDNA recovery when using capture enrichment compared with a shotgun approach. While some of the taxa identified are biogeographically implausible, most make ecological sense. The breadth of taxa identified with a capture enrichment approach (and high DNA recovery extraction method) aid in expanding the ecological scope of environmental changes that can be observed when not restricted to DNA fragments amenable to a metabarcoding approach. Deep shotgun sequencing to library exhaustion would be ideal as it is the least biased approach. However, until data storage, computational power, database completeness, and sequencing costs are significantly improved, deep sequencing strategies are largely unachievable for most users except for those with immense computational and sequencing resources.
Overcoming enzymatic inhibitors
Our ongoing experiments with a diverse range of sediments suggest that extracts with inhibition indices over ~0.3 are still amenable to library preparation, but with reduced adapter ligation efficiency (see section SET-D in supplementary Appendix A for a discussion of extract qPCR inhibition). Solution C3 (120 mM aluminum ammonium sulfate dodecahydrate) in the PowerSoil kit is effective at precipitating humic substances, resulting in clear, inhibitor-free extracts. However, aluminum sulfate has also been demonstrated to readily precipitate DNA along with those humic substances (Dong et al., Reference Dong, Yan, Liu, Zhang and Xu2006). We have found that the PowerSoil kit is effective at removing DNA inhibition, but that this approach often resulted in less adapted DNA. The kit would seem to be most effective with modern sediments and soils, where degradative processes are comparatively limited, but this inhibitor removal approach might be too aggressive at precipitating the tightly bound organo-mineral complexes in which rare fragments of sedaDNA are preserved. There seems to be an important balance between releasing enough DNA but not releasing too many inhibitors during the lysis stage, and also removing enough inhibition for enzymatic reactions, while not removing the majority of the endogenous sedaDNA during purification (Fig. 9). We suspect that with further optimization, the cold spin extraction procedure could be improved to better remove DNA independent inhibitors (such as humic substances) that impact enzymatic activity (Allison, Reference Allison2006) in other sediment contexts. Samples with inhibitor types unaffected by the cold spin may still be best extracted with a modified PowerSoil protocol or alternative approaches. Of course, the inhibitor constituent (as well as distribution of preserved aDNA) of a site or sample likely varies considerably even at the molecular scale, making it difficult to estimate the best approach at the outset of an investigation without extensive site-specific experimentation.
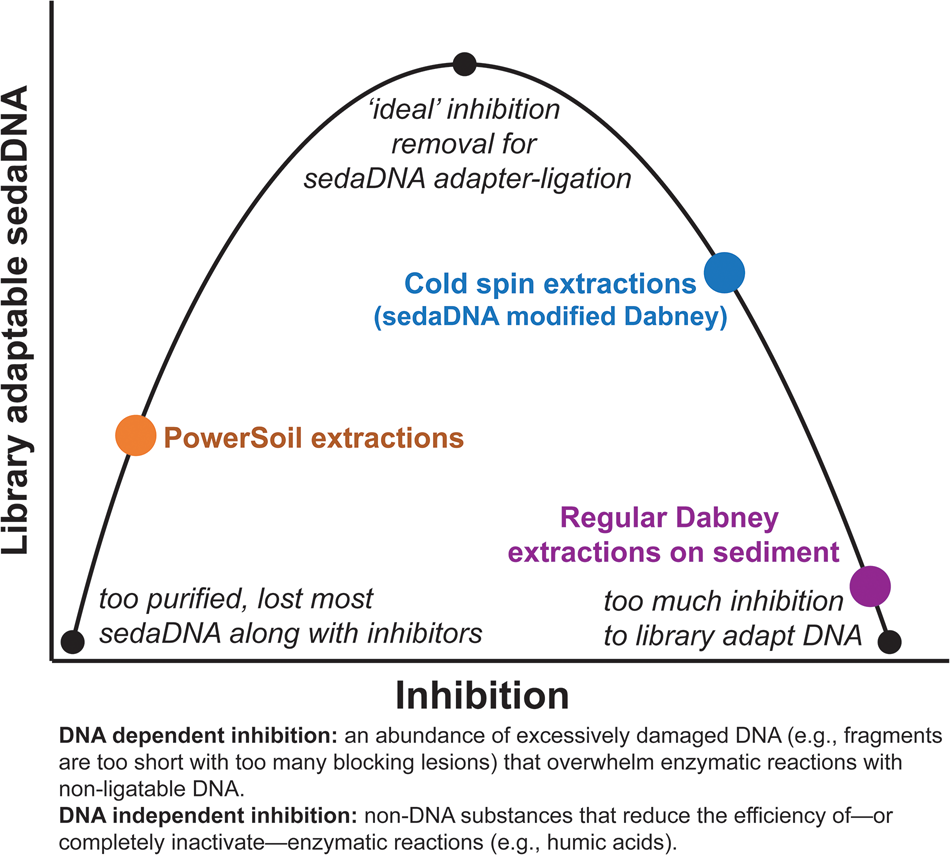
Figure 9. (color online) Conceptual representation of the balance needed to overcome sedaDNA inhibition.
Of interest for further research is how inhibitor precipitation is affected by the interaction between the lysing detergent sodium dodecyl sulfate (SDS) and the cold spin for (see section SET-D. SDS and sarkosyl in supplementary Appendix A). We suspect that the efficiency of inhibitor precipitation with the long cold spin method could be further optimized, as our experiments suggest that the presence of SDS in the lysis buffer significantly contributes to the precipitation of humics and other inhibitors, compared with extracts where sarkosyl was used as the lysing detergent. For the permafrost samples in this study, we have found that the cold spin technique is effective at removing enough inhibition for effective library preparation while maximally retaining sedaDNA. However, other samples (not in this study) with especially high concentrations of humics and other unidentified inhibitors retain much of their inhibition despite the cold spin (with the cold spin producing thick pellets of inhibitor precipitates [≳ 1 ccm], such as illustrated in Fig. 2), necessitating further sample-specific modifications. We have observed generally (data not reported here) that lowering the sediment input (<0.2 g), splitting the subsample into multiple low-input lysing tubes and pooling after the cold spin over a Roche column, as well as increasing the duration of the cold spin, helps further reduce the inhibitor load of especially challenging samples. Our cold spin technique is unlikely to be optimal for all forms of sedaDNA inhibition however, as it has been observed that identifying the specific inhibitory substances involved is critical to mitigating the compound-specific mechanisms that affect enzymatic reactions (Opel et al., Reference Opel, Chung and McCord2010). Further research is needed to identify the inhibitor constituents of sedaDNA target samples in order to improve the inhibitor precipitation we observed while maximizing sedaDNA retention.
SedaDNA authenticity
DNA damage is often used as a proxy indicator for assessing whether sets of molecules are ancient or the result of modern contamination (Mitchell et al., Reference Mitchell, Willerslev and Hansen2005; Gilbert et al., Reference Gilbert, Binladen, Miller, Wiuf, Willerslev, Poinar, Carlson, Leebens-Mack and Schuster2007; Ginolhac et al., Reference Ginolhac, Rasmussen, Gilbert, Willerslev and Orlando2011; Sawyer et al., Reference Sawyer, Krause, Guschanski, Savolainen and Pääbo2012; Dabney et al., Reference Dabney, Meyer and Pääbo2013a; Jónsson et al., Reference Jónsson, Ginolhac, Schubert, Johnson and Orlando2013). Damage profiles for taxa with sufficiently high read counts (≳200 reads at minimum map quality 30) show characteristic aDNA deamination patterns and short fragment length distributions (Fig. 8). When mapping to the mitogenome, taxa with ≲200 reads typically show an insufficient overlap of fragments to identify modifications of the terminal bases. This precludes confident assessment of damage patterns and makes it difficult to authenticate rare taxa with low read counts in this dataset. Comparisons of the map-filtered with non-mapped libraries (in supplementary Appendix A section SET-E. Additional data) suggests that our quality filtering steps are sufficiently conservative to reduce the noise characteristic of metagenomic datasets (Lu and Salzberg, Reference Lu and Salzberg2018; Eisenhofer et al., Reference Eisenhofer, Minich, Marotz, Cooper, Knight and Weyrich2019), but may also strip out some potentially informative (but less confidently assigned) reads. Our pre-BLASTn map-filtering approach allows for a more conservative and streamlined analysis. Using a more regionally curated BLAST database might alleviate some of the potential for false positives due to ecologically nonsensical oasis taxa as discussed in Methods, subsection 10. However, this will also potentially come at the cost of alternative false positives and negatives due to biases in database representation that result from limitations in our proxy-driven understandings of palaeoecosystems (Jackson, Reference Jackson2012). This theoretically could drive taxonomic assignments towards organisms one is comfortable identifying, because the actual unexpected organism is not included as a possibility for taxonomic assignment, driving a false sense of confidence in the specificity of those reads. An approach incorporating elements from the PIA algorithm (Cribdon et al., Reference Cribdon, Ware, Smith, Gaffney and Allaby2020) with the interface and flexibility of the MEGAN software (Huson et al., Reference Huson, Auch, Qi and Schuster2007, Reference Huson, Beier, Flade, Górska, El-Hadidi, Mitra, Ruscheweyh and Tappu2016; Huson and Mitra, Reference Huson, Mitra and de Bruijn2011) would likely be a good trajectory for moving forward with an eDNA capture enrichment or shotgun based approach.
Blank controls
Blank extraction, library, indexing, and metabarcoding reactions (used to identify buffer and cross-contaminants) in the shotgun and enriched libraries do not contain any map-filtered reads (Table S23). The non-mapped LCA-assigned reads for these blanks are predominantly adapter-contaminated sequences (≥ 95%) (Fig. S32). The map-filtered metabarcoding blanks only contain reads that could be LCA assigned to high taxonomic ranks (Fig. S33). This would suggest that patterns of library sequence composition observed in the sample replicates are at minimum originating from the samples themselves and are not the result of laboratory contamination.
Palaeoecology
This study is intended as a proof of concept to demonstrate the viability of targeted enrichment for the recovery of ecologically complex, molecular taxonomic proxies from open-air eDNA samples. Further research will utilize these methods, and complementary palaeoecological techniques, on Yukon lake sediments and permafrost cores from the Klondike area to track ecological shifts during the Pleistocene-Holocene transition. However, it is worth briefly contextualizing these broad taxonomic trends here for authenticity purposes (as summarized in Fig. 4).
The Bear Creek (BC 4-2B, 30,000 cal yr BP [D'Costa et al., Reference D'Costa, King, Kalan, Morar, Sung, Schwarz and Froese2011]) and older Lucky Lady II samples (LLII 12-217-8, 15,865 cal yr BP [Mahony, Reference Mahony2015]) both date to a period in which eastern Beringia is thought to have been largely a herb tundra biome, dominated by exposed mineral surfaces, prostrate willows, grasses, forbs (non-graminoid herbs), and occupied by diverse and abundant megafauna (Dyke, Reference Dyke2005; Zazula et al., Reference Zazula, Froese, Westgate, la Farge and Mathewes2005, Reference Zazula, Schweger, Beaudoin and McCourt2006). Our data reflect this environmental setting, particularly in the case of Bear Creek (Figs. 4–5, S26–S27) (D'Costa et al., Reference D'Costa, King, Kalan, Morar, Sung, Schwarz and Froese2011). We identified a similar range of mammalian species as D'Costa et al. (Reference D'Costa, King, Kalan, Morar, Sung, Schwarz and Froese2011) did using the same core sample, but with additional taxa (e.g., caribou [Rangifer tarandus]). More specific taxonomic assignments, especially if novel or possibly controversial, need to be treated with caution. Thus, while D'Costa et al. (Reference D'Costa, King, Kalan, Morar, Sung, Schwarz and Froese2011) identified Bos sp., we recovered a more specific signal for yak (with hits to both B. grunniens and B. mutus [domestic and wild yak, respectively]. Web-BLASTing these yak-specific reads to the top 5000 hits (rather than top 100) drops the LCA-assignment to Bos sp., which is consistent with the results reported by D'Costa et al. (Reference D'Costa, King, Kalan, Morar, Sung, Schwarz and Froese2011). A follow-up investigation with deeper sequencing is intended to assess the possibility of B. mutus (wild yak) in eastern Beringia during the Pleistocene.
Results from the younger Lucky Lady II sample (LLII 12-84-3, 13,205 cal yr BP [Sadoway, Reference Sadoway2014]) indicate an expansion of birch shrub tundra (Dyke, Reference Dyke2005), reflected by a decrease in grasses and a proportional increase in birch (Betula sp.) and willow (Salix sp.) (Figs. 4, S23–S24) relative to the earlier two core samples. The youngest core sample (MM12-118b, 9685 cal yr BP; Mahony, Reference Mahony2015) shows a proportional increase in conifers, particularly spruce (Picea sp.) but also potentially pine (Pinus sp.), that is consistent with pollen records in southern Yukon for the expansion of forests (Gajewski et al., Reference Gajewski, Bunbury, Vetter, Kroeker and Khan2014) and the establishment of the northern boreal forest by ~9000 cal yr BP (Dyke, Reference Dyke2005). Assignments to Pinus sp. are unexpected as previous research has found that lodgepole pine (Pinus contorta var. latifolia) had a northern extent of 60°N (the Yukon-B.C. border) during the early Holocene, and only reached its present-day northern limit (~63°N) by ~1790 cal yr BP (Strong and Hills, Reference Strong and Hills2013). When the relevant set of pine positive samples is subjected to more stringent bioinformatic testing (see supplementary Appendix A, SET-E. Stringent LCA filtering for unexpected taxa), these reads unambiguously retain their assignments to the genus Pinus. The stratigraphic reliability of these sedaDNA molecules in permafrost might be questionable, however (see below), but if their age is accurate, it would suggest a low-density northern expansion of pine beyond southern Yukon ~3500 years earlier than pollen and stomata records have yet indicated (Schweger et al., Reference Schweger, Froese, White and Westgate2011; Strong and Hills, Reference Strong and Hills2013; Edwards et al., Reference Edwards, Franklin-Smith, Clarke, Baker, Hill and Gallagher2015).
The mammalian sedaDNA constituents of these permafrost samples also display a marked change, dwindling in relative abundance and richness with time into the Holocene (Figs. 4–5, S20–22), but perhaps less sharply than commonly thought. For example, we recovered genetic evidence of both woolly mammoth (Mammuthus primigenius) and horse (Equus sp.) in the Upper Goldbottom core dated to ~9700 cal yr BP (Mahony, Reference Mahony2015). Previous radiocarbon dates on fossils indicate that horses disappeared from high-latitude northwestern North America relatively early, ca. 13,125 cal yr BP (“last appearance date” 11,500 14C BP, based on AMNH 134BX36 from Upper Cleary Creek [Guthrie, Reference Guthrie2003]). This ~3400-year difference implies the existence of a substantial ghost range (i.e., a spatiotemporal range extending beyond the last appearance age, as indicated by directly dated fossils or other associated remains; Haile et al., Reference Haile, Froese, MacPhee, Roberts, Arnold, Reyes and Rasmussen2009). While this find cannot be corroborated by the macrofossil record for Equus, it is consistent with previous sedaDNA results from central Alaska (Haile et al., Reference Haile, Froese, MacPhee, Roberts, Arnold, Reyes and Rasmussen2009).
In the absence of additional information, it is difficult to assess whether this small signal (Fig. 4) may be considered chronostratigraphically reliable or whether it has been affected by factors such as leaching, cryo- or bioturbation, or reworking (redeposition) (Arnold et al., Reference Arnold, Roberts, Macphee, Haile, Brock, Möller and Froese2011), altering the relative positions of sedaDNA complexes. In the case of the mammoth reads, after merging the sequenced data from the three Upper Goldbottom core (MM12-118b) subsampled replicates, coverage was insufficient (low read counts mapping across the mitogenome) to reliably assess characteristic aDNA damage patterns (Fig. S38). There is arguably some indication of terminal damage with the merged mapDamage and particularly short fragment length distribution (FLD) profiles, but greater sequencing depth is needed to assess their authenticity. These LCA-assigned mammoth (n = 41) and horse (n = 10) reads from the Upper Goldbottom core (~9700 cal yr BP, Fig. 4) were extracted, concatenated, queried with the web-based BLASTn, and subjected to stricter LCA parameters (see supplementary Appendix A SET-E. Stringent LCA filtering for unexpected taxa). Despite stricter filtering, three reads were LCA-assigned to M. primigenius, 25 to Mammuthus sp., and 11 were identified as Elephantidae. Equus sp. retained five assigned reads. A follow-up analysis with deeper sequencing of this sample will further address the veracity of this signal.
Limitations of comparison
There are several caveats to keep in mind when assessing our comparison of protocols and the potential of the PalaeoChip Arctic-1.0 bait-set. First, the lysis stage of our PowerSoil and of the sedaDNA modified Dabney protocols were not equivalent in duration or reagents. We followed manufacturer specifications for PowerSoil, but the lysis stage of extraction with equivalent kits can be increased in duration and augmented with additional reagents to theoretically increase DNA yield (Niemeyer et al., Reference Niemeyer, Epp, Stoof-Leichsenring, Pestryakova and Herzschuh2017). Further, a recently released update to the PowerSoil kit, the DNeasy PowerSoil Pro, claims to have an 8-fold increase in DNA yield compared with comparative commercial kits (it is unclear what the n-fold increase over standard PowerSoil is with this updated kit). Our experiments with the PowerSoil inhibitor removal solution C3 found consistently low DNA retention compared with our longer duration 4°C spin as an inhibitor removal technique (SET-B in supplementary Appendix A). The PowerSoil inhibitor removal solution is effective at rapidly precipitating enzymatic inhibitors, but this study suggests that it is often overly aggressive and consistently precipitated viable sedaDNA in the process (Fig. S7). We suspect that a longer lysis stage with PowerSoil would increase overall yields, but would not mitigate the substantial losses associated with overly aggressive humic precipitation when utilizing solution C3 (at least at manufacturer recommended concentrations). We found that the cold spin is sufficiently effective at removing enzymatic inhibition with these permafrost samples to allow for successful adapter ligation, even if the extracts were not as inhibitor free as PowerSoil (Fig. 3). However, we have also found that samples from bogs or sites with high organic loads remained highly inhibited despite the cold spin, likely due to the high humic concentrations (among other forms of inhibition). For difficult samples such as these, further fine-tuning is needed to improve inhibitor removal.
Second, metabarcoding is not directly equivalent to enrichment when comparing taxonomic coverage and LCA-assigned read counts. Mapping our data back to the baits does strip out taxonomically informative hits—potentially to a greater degree than with metabarcoding data that might not map well to the curated bait sequences. To mitigate this, we mapped the second set of plant specific trnL comparisons (Figs. 6–7, S22–26) to the plant references rather than the baits sequences to increase the metabarcoding reads available for BLAST. We observe that mapping to the curated baits (which have low complexity and non-diagnostic regions masked or removed) substantially reduces the number of low confidence (potential false positive) spurious hits but does result in data loss (see Figs. S18–19). Map-filtering to the plant references alleviates this to some degree but in the future this strategy might be better paired with a regionally curated reference database or PIA approach (Cribdon et al., Reference Cribdon, Ware, Smith, Gaffney and Allaby2020) as discussed earlier.
Finally, it should be emphasized that the PCR metabarcoding data re-analyzed from Sadoway (Reference Sadoway2014) targeting multiple plant and animal loci were from samples not purified with our cold spin sedaDNA optimized extractions. The libraries that were extracted with PowerSoil and our sedaDNA modified Dabney procedure were only PCR amplified for trnL (rather than the suite of loci initially assessed by Sadoway [Reference Sadoway2014]). We observe that PowerSoil and cold spin extracted metabarcoding samples generally outperform their counterparts processed by Sadoway with the Boom et al. (Reference Boom, Sol, Salimans, Jansen, Wertheim-Van Dillen and van der Noordaa1990) and D'Costa et al. (Reference D'Costa, King, Kalan, Morar, Sung, Schwarz and Froese2011) extractions in terms of taxonomic breadth, but that these three metabarcoding approaches do generally identify the same predominant taxa. We suspect that either of these newer extraction methods would have resulted in a wider breadth of plant and animal taxa identified for the Sadoway metabarcoded libraries. This limitation of our comparison should moderate conclusions drawn from this work.
The key observation in this study is that enrichment clearly outperforms alternative targeting strategies in this dataset, including the PowerSoil or cold spin extracted trnL metabarcoded libraries. We suspect this is driven in large part by the smaller fragment lengths available to an enrichment approach compared with metabarcoding. For example, in the Upper Goldbottom core (MM12-118b), LCA-assigned hits to Betula sp. (Figs. 4 and 7) in the enriched libraries have a FLD mode of 49 bp (n = 5397), whereas hits to Betula sp. from the same extracts but with metabarcoded libraries have a FLD mode of 98 bp (n = 500). In this case, the metabarcoding libraries were restricted to targeting much longer fragments that are comparatively rare with sedaDNA. This bias towards large fragments with metabarcoding is likely one of the main reasons why many rarer taxa are missed with this approach. Low biomass organisms would have an expectedly lower proportion of eDNA, with taphonomic processes making long fragments (those needed for metabarcoding) even more unlikely to survive. As an example where this might be driving taxonomic false negatives, Lupinus sp. (lupine) was identified in the Upper Goldbottom core with a combined count of 353 unique reads in the cold spin enriched libraries, but was absent from all of the metabarcoding libraries. Lupinus sp. enriched libraries have a FLD mode of 41 bp, with 79% of the reads being shorter than 69 bp. The trnL metabarcode for L. arcticus (Arctic lupine) is 52 bp, but with primer landing sites this fragment increases in length to 91 bp. With such a large fragment necessary for metabarcoding detection, it is not surprising that this taxon and other low biomass organisms were not detected with metabarcoding when aDNA fragments of this length are exceedingly rare. In the same way, 73% of Betula sp. reads in the enriched sample are shorter than 69 bp, and only 12% are 80–110 bp, whereas 83% of the metabarcoding reads for Betula sp. fall in the larger fragment range. Figure S39 in supplementary Appendix A depicts an FLD histogram of this example.
The goal of this analysis was to establish the viability of enrichment for complex sedaDNA contexts, and to report on a new inhibitor removal technique that may yet be further optimized. Despite the limitations of the comparisons discussed above, the data clearly demonstrate the power of targeted enrichment for eDNA, and we intend to further expand on the PalaeoChip Arctic-1.0 bait-set with additional target sequences for regionally specific vegetation, mammals, insects, fungi, and microbiota. We also intend to optimize PalaeoChip for other non-arctic/subarctic regions.
CONCLUSIONS
The experiments outlined in this report demonstrate the utility of our cold spin inhibitor removal technique, paired with Dabney et al. (Reference Dabney, Knapp, Glocke, Gansauge, Weihmann, Nickel and Valdiosera2013b) purifications, for overcoming enzymatic inhibitors in sedimentary materials. This technique utilizes the high aDNA recovery potential of Dabney purifications, while also addressing the unique challenges of sediments and soils where many inhibitory substances tend to co-elute with target sedaDNA molecules. Other extraction approaches, such as the PowerSoil kit, struggle with significant aDNA loss that ultimately limits the targeting options for maximally exploiting the genetic archives preserved in sedimentary contexts. The improved DNA retention of the cold spin inhibitor removal technique described here facilities the significantly expanded targeting scope of a capture enrichment approach for sedaDNA, in this case using the PalaeoChip Arctic-1.0 bait-set. With this approach, we were able to capture a highly complex set of plant and animal DNA from permafrost sediments that outperformed an alternative extraction strategy, shotgun sequencing, and two versions of a PCR metabarcoding approach. Many of the organisms identified here with our cold spin and enrichment strategy were entirely missed with alternative methods, including the potential late survival of woolly mammoth (Mammuthus primigenius) and horse (Equus sp.) in the Klondike of Yukon Canada, and the early Holocene appearance of pine (Pinus sp.). Further work is needed to refine the potential for false positives and negatives in metagenomic datasets due to a variety of factors, but most notably database incompleteness and unevenness. Recent work reported by Cribdon et al. (Reference Cribdon, Ware, Smith, Gaffney and Allaby2020) may serve as a viable next step towards further improving molecular taxonomic identifications to make full use of the eDNA archives of palaeobiota being rapidly unlocked by new methods.
An enrichment approach for eDNA avoids the myriad limitations of a PCR metabarcoding strategy, and opens many new possibilities for further study, such as whole genome capture and assembly, as well as phylogenetic placement without any surviving macroremains. By increasing the taxonomic breadth of our environmental baits, and further optimizing enrichment and sedaDNA extraction conditions, this technique can continue to improve the sequenced fraction of on-target molecules without deep shotgun sequencing, or potentially biased PCR amplifications. This technique enables the recovery of a more holistic set of palaeoenvironmental DNA of widely varying molecular fragment lengths from a diverse range of genetic loci. This expanded set of captured DNA targets allows for the simultaneous molecular identification of organisms that might not have the biomass to be readily detected with other palaeoecological methods, and even in the complete absence of surviving tissues or microfossils. PCR metabarcoding is likely to remain a viable and important eDNA workhorse for the foreseeable future. As the costs of metagenomic analysis continue to decrease, and especially in situations where DNA preservation is favorable and a wide set of targets are of interest, an enrichment approach as shown here has the potential to recover a far greater diversity of molecular taxonomic identifiers to better complement traditional palaeoenvironmental approaches.
ACKNOWLEDGMENTS
Our thanks to Alison Devault at Arbor Biosciences for her invaluable assistance with designing the bait-set, as well as Brian Golding and members of his bioinformatics research team at McMaster University for their computational resources and assistance, and all members of the McMaster Ancient DNA Centre. We also wish to thank the editors at Quaternary Research and peer-reviewers who provided detailed and carefully considered critiques, which significantly improved the quality of this report. We wish to thank the Arctic Institute of North America, the Garfield Weston Foundation, the Natural Sciences and Engineering Research Council of Canada, McMaster University and the Department of Anthropology, Polar Knowledge Canada (POLAR), and the Social Sciences and Humanities Research Council of Canada for each funding various components of this research.
SUPPLEMENTARY MATERIAL
The supplementary material for this article can be found at https://doi.org/10.1017/qua.2020.59


